

How to run checks on internal services with Grafana Cloud Synthetic Monitoring
Many critical services run inside private networks, where traditional monitoring tools and practices can’t offer full visibility. This makes it difficult to validate service availability and performance before problems impact your users.
Synthetic Monitoring — a Grafana Cloud solution that helps you proactively monitor the performance of your applications and services — addresses this gap with a feature known as private probes. With private probes, you can run checks from within private environments, improving visibility into internal services, such as APIs, staging environments, or resources behind a firewall, without exposing them publicly.
In this post, we walk through how to set up and run private probe checks using Grafana Cloud Synthetic Monitoring. You can also follow along with the video below.

What exactly is a private probe?
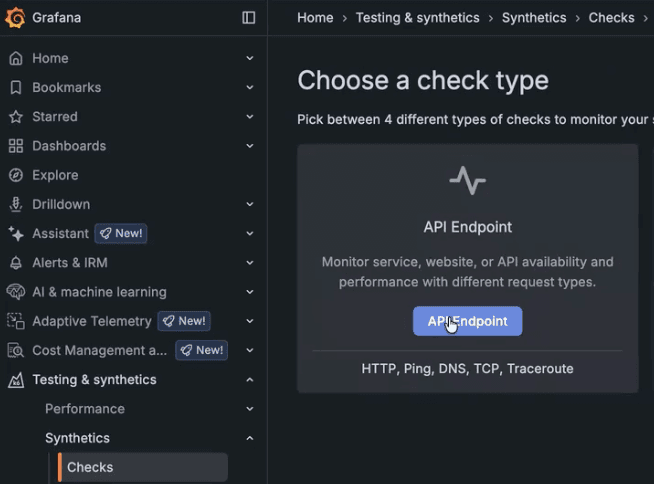
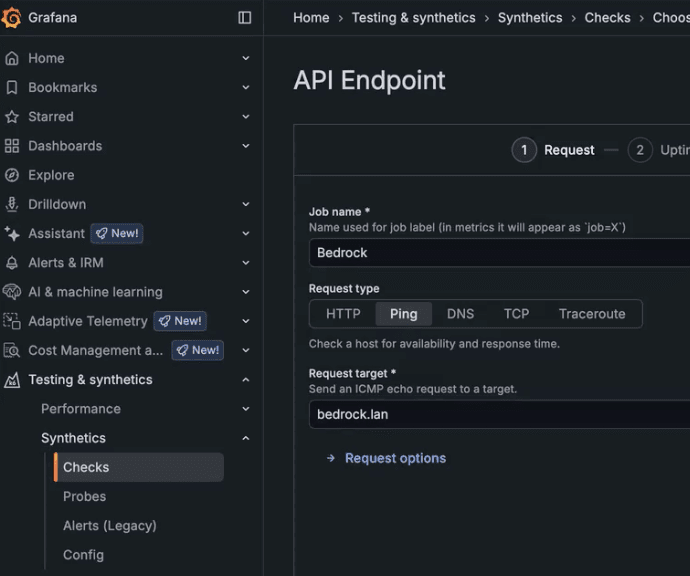
Grafana Cloud Synthetic Monitoring lets you run a variety of synthetic monitoring checks, such as browser, ping, DNS, HTTP, and TCP checks, from either:
- Public probes, which are fully managed by Grafana Labs and distributed across more than 20 global locations
- Private probes, which are self-hosted agents that you deploy within your own infrastructure
A private probe runs inside your network, executes the checks you configure, and sends the results back to Grafana Cloud. This gives you the same observability and alerting capabilities for private services that you already have for public-facing ones. Private probes are especially useful for monitoring services that are not publicly accessible, including:
- Services running on private networks
- Internal or private APIs
- Staging or pre-production environments
- Services behind authentication
- Endpoints restricted by IP allowlists or firewalls
With private probes, you can validate service availability and performance from the same environment your users or internal systems depend on, without exposing those services to the public internet.
How to run a private probe
Setting up a private probe involves two main steps:
- Step 1: Deploy the private probe agent
- Step 2: Configure synthetic checks to use the private probe
Private probes can be deployed in several environments, including Kubernetes, Docker, and Ubuntu or Debian systems. In this walkthrough, we use Kubernetes. For additional deployment options and code samples, refer to the documentation.
Step 1: Deploy the private probe
Navigate to the Probes page
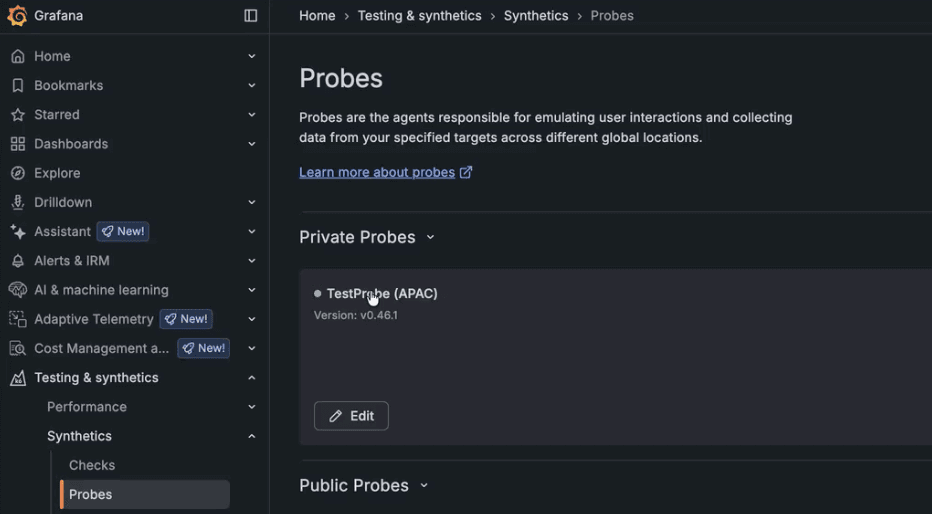
In Grafana Cloud Synthetic Monitoring, navigate to the Probes page. This page lists all available public probes along with their reachability status.
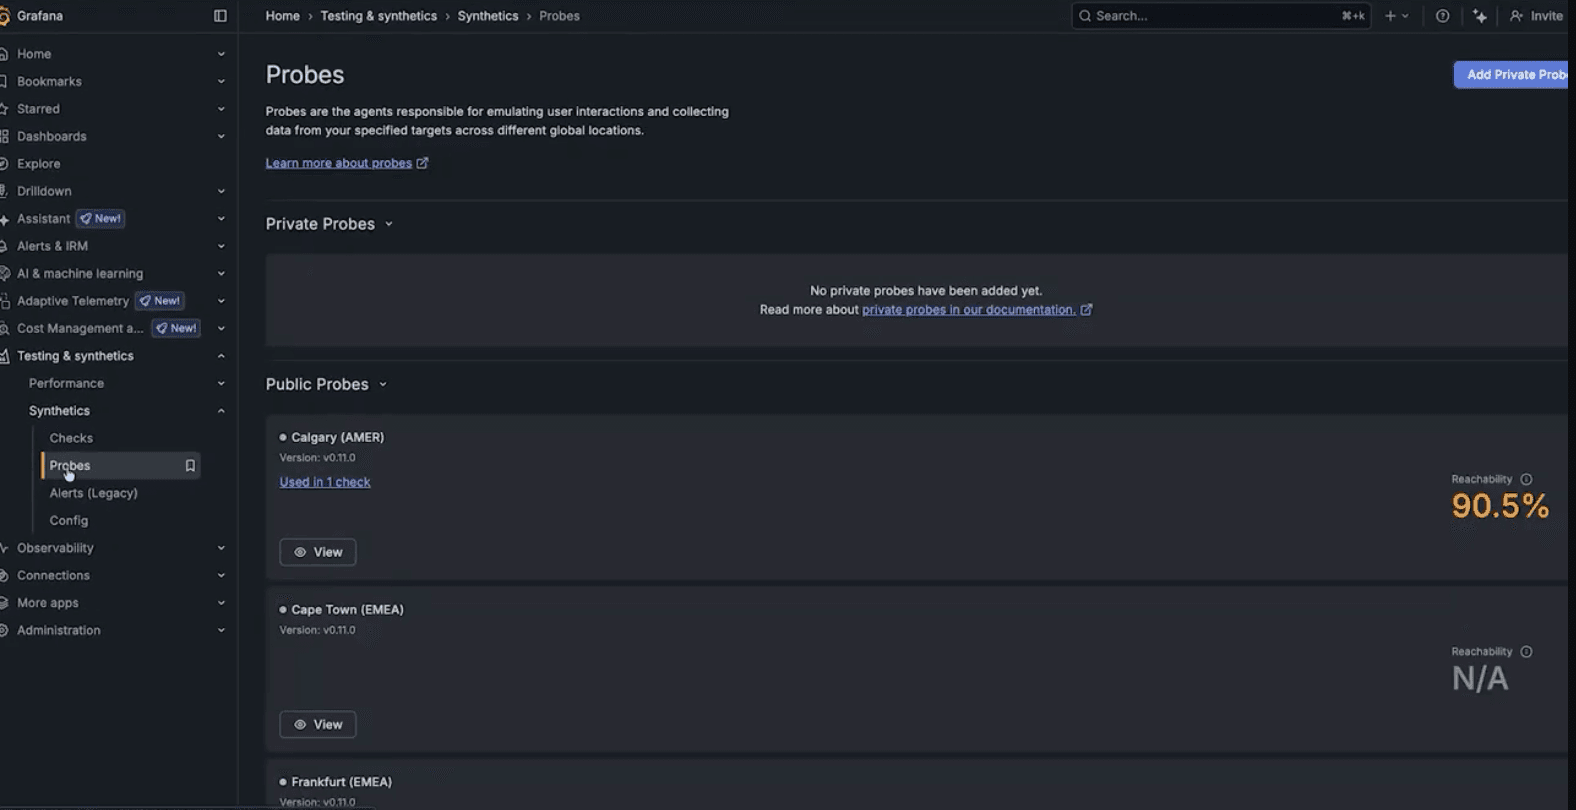
Create a new private probe
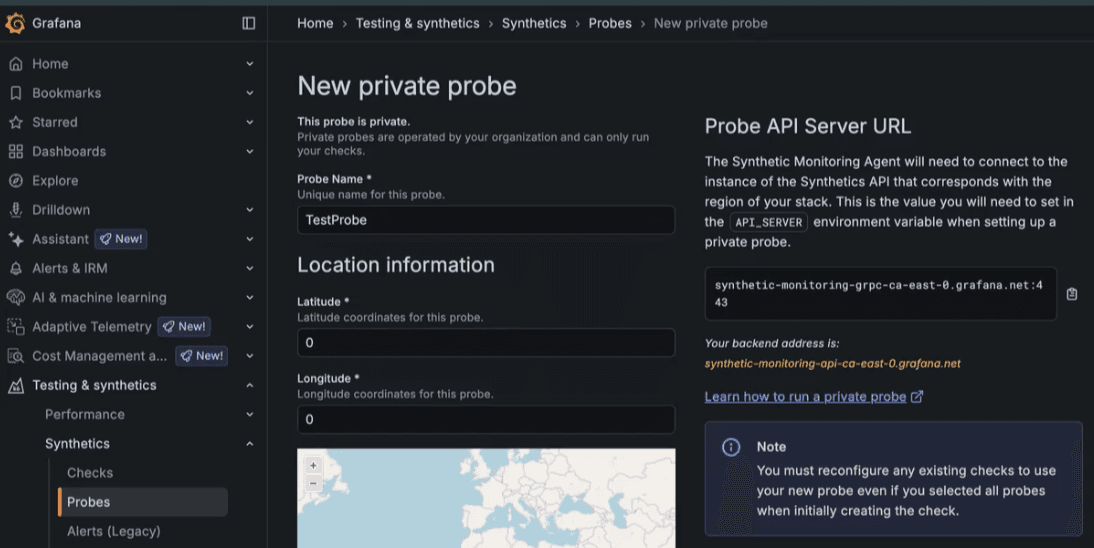
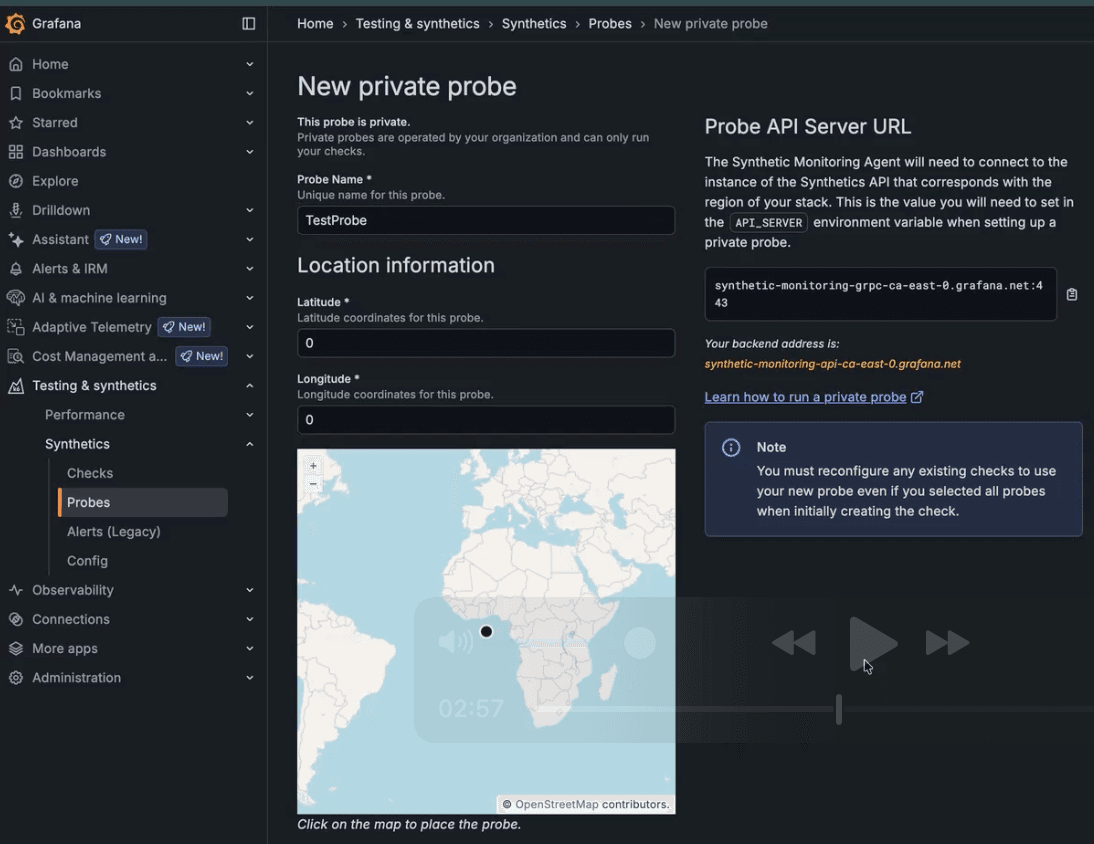
Under Testing & synthetics, navigate to Synthetics → Probes. Select Add Private Probe and provide the following details:
- A descriptive name, such as
test-probe - Location information, which is used for map display
- Optional custom labels, which are helpful when managing multiple probes
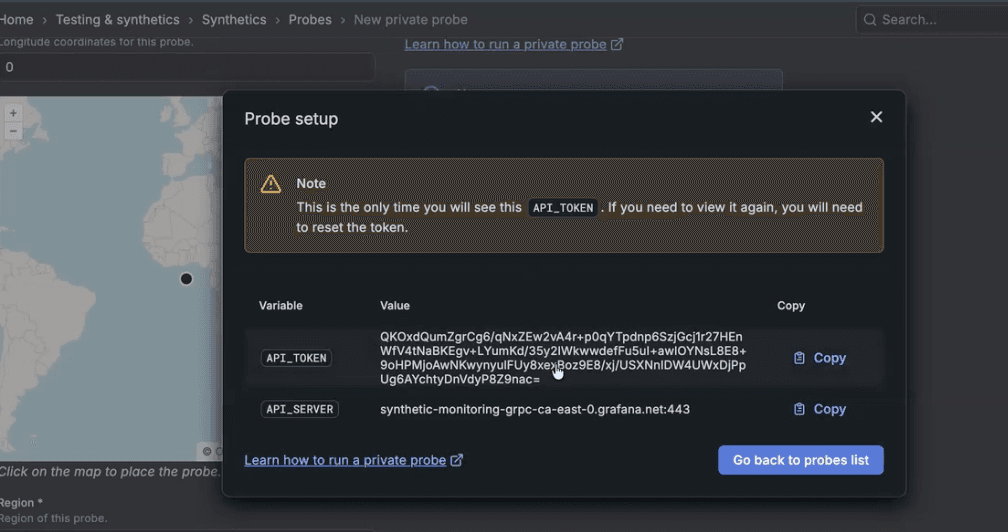
Register the probe
After creating the probe, Grafana Cloud generates a one-time registration token and provides the server location. You will need both values in the next step when deploying the probe agent.
Prepare and deploy the Kubernetes manifests
To deploy the private probe to Kubernetes, you need three manifests:
- A Namespace
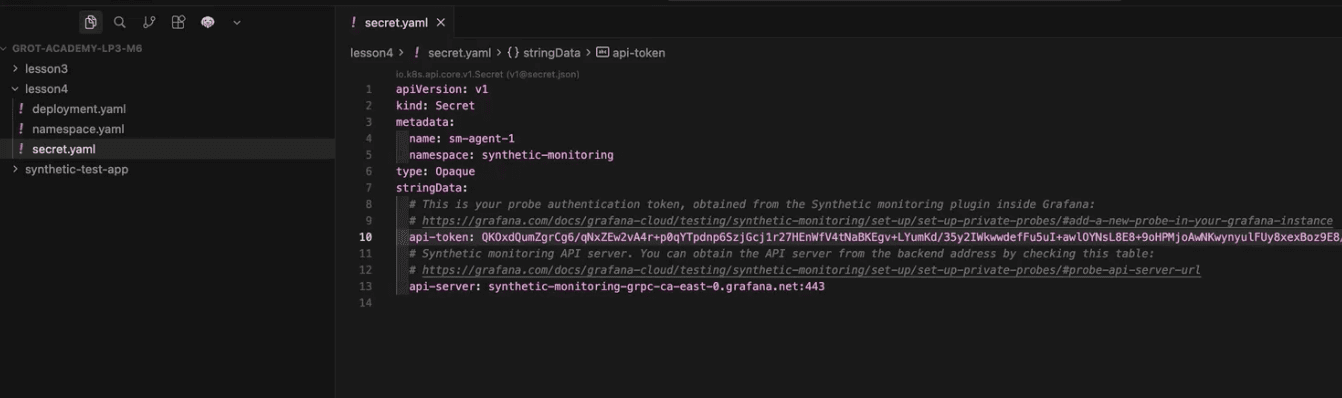
- A Secret containing the registration token
- A Deployment for the private probe agent
These can be found in Grafana Cloud documentation.
Configure the secret with your one-time registration token and server location. In production environments, use pass-through environment variables or a secure secret management solution instead of hardcoding tokens in YAML files.
Apply the manifests to your Kubernetes cluster in the following order:
- Namespace
- Secret
- Deployment
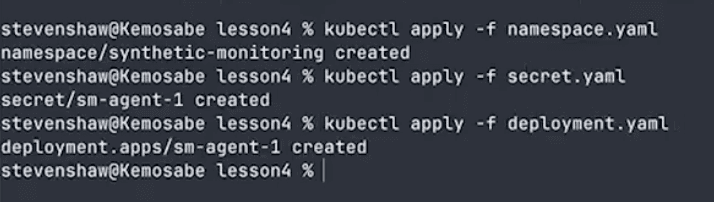
Verify the deployment
After deployment, verify the following in your Kubernetes cluster:
- The namespace exists
- The probe agent pod is running
- The probe has successfully registered with Grafana Cloud
Once registration is complete, the private probe appears on the Probes page in Grafana Cloud Synthetic Monitoring.
Specify the target
Enter a target that isn't accessible from the public internet.
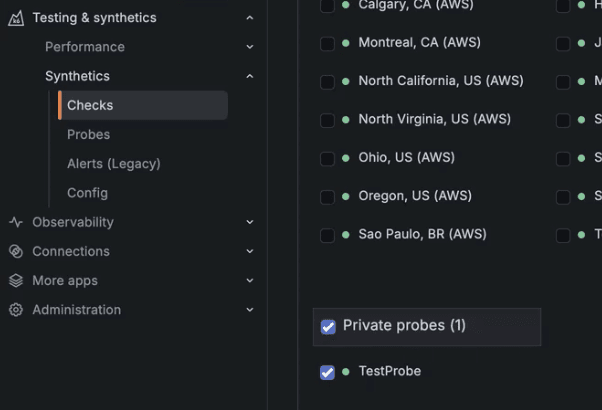
Select your private probe
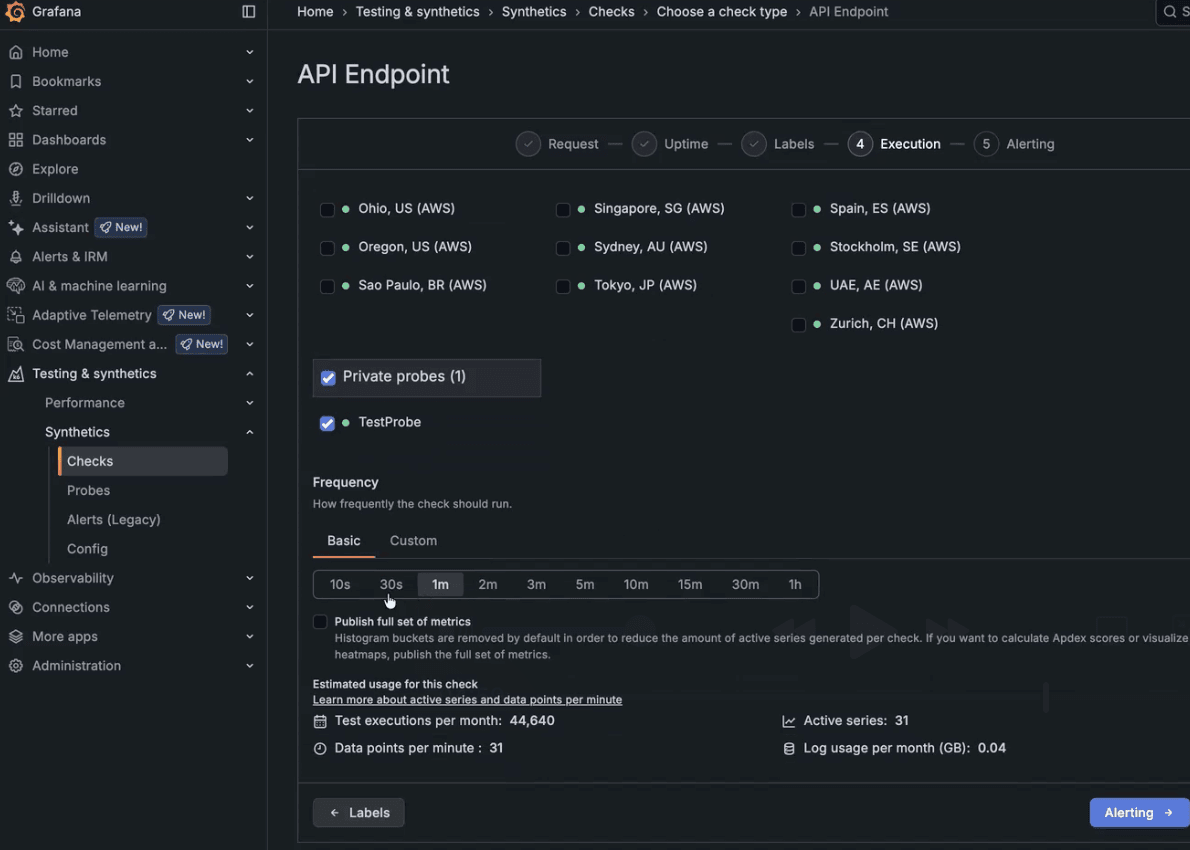
In the execution section, you'll see all public probes plus your private probe. Select your private probe.
Configure frequency and alerts
Set how often the check should run (e.g., every 10 seconds for quick visibility). Optionally, configure alerts based on your monitoring requirements.
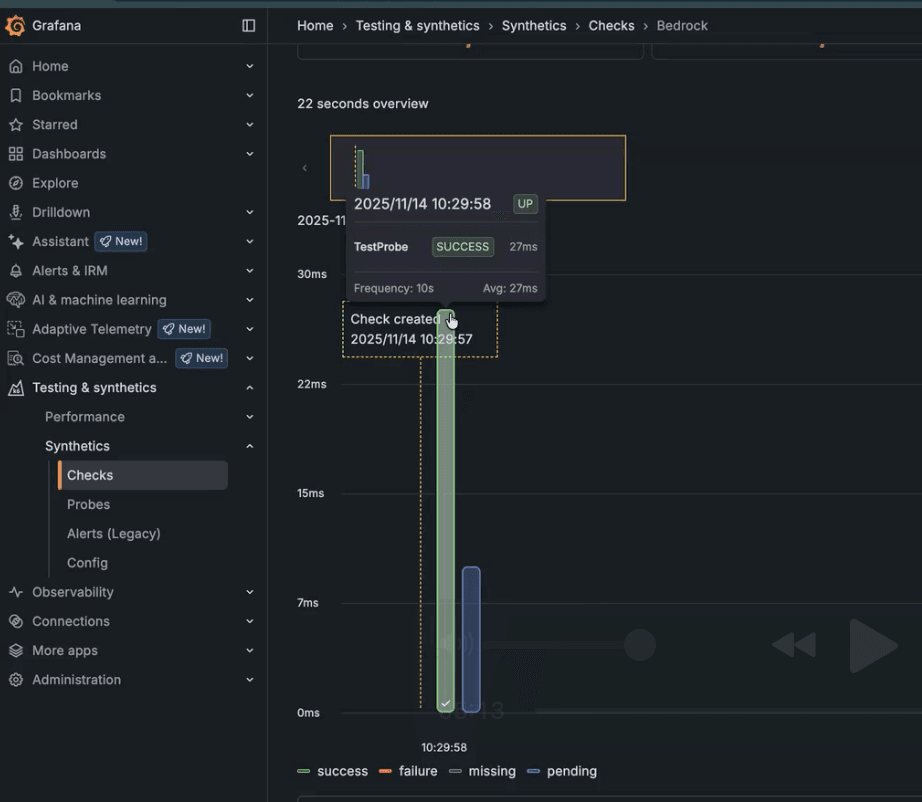
Save and run
Once created, the check begins running immediately. You'll see results populate with successful pings, response times, error rates, and other metrics.
Wrapping up
Private probes allow you to proactively monitor private services before issues affect end users. With Grafana Cloud Synthetic Monitoring, you can use private probes to observe private services with deep visibility and reliability.
To learn more about Synthetic Monitoring, refer to our technical documentation. You can also explore this dashboard on Grafana Play, which features a variety of running checks.
Grafana Cloud is the easiest way to get started with Synthetic Monitoring. We have a generous free tier that includes 100K test executions per month and more. Sign up for free now!

