
%3Aquality(90)%2F&w=3840&q=75)

How to measure and improve instrumentation quality for better full-stack observability


Modern engineering teams instrument everything, with metrics, logs, traces, and profiles flowing from hundreds of services at once. But full-stack observability isn’t really about collecting more telemetry; it's about having a single, unified picture of how your services connect to every layer beneath them, including their dependencies, the pods and nodes they run on, and the logs, traces, and profiles that explain their behavior.
But there's often a quiet problem hiding underneath all that data: not all instrumentation is created equal, and every gap silently breaks one of those connections.
One service, for example, might emit metrics but no logs, so when you pivot from “this is erroring” to “show me why,” you hit a dead end. Another might have logs but an invalid service.name or a missing k8s.pod.name that breaks correlation, dropping it out of the graph and away from its pods and nodes. A third service might look perfectly healthy right up until an incident, when you discover its traces were never wired up and the trail goes cold exactly when you need it most.
To fix this, Grafana Cloud’s Knowledge Graph now includes an instrumentation quality report: an automated, continuously updated assessment of how well each of your services is instrumented—and, in effect, how they plug into the full-stack picture.
In this post, we'll walk through how to read the instrumentation quality report, how the scoring works, and how to use it to systematically raise the observability bar, keeping every layer of your stack joined up across every service you run.
What is instrumentation quality?
Instrumentation quality is a measure of how complete and correct the telemetry for a given service is, judged against a set of automated checks.
Each service is evaluated by a server-computed set of quality checks: small, focused rules that validate one specific thing about a service's telemetry.
A few examples:
- Does the service emit logs?
- Are service graph metrics present?
- Is the service name well-formed (no stray slashes, valid
service.namespace)? - Are the expected Kubernetes labels attached so the service can be correlated with its pods, nodes, and cluster?
Other checks cover span metrics, profiles, metric cardinality, and more, each one validating a different signal or connection.
It helps to read that list not as a compliance checklist, but as a web of connections. Service graph metrics link a service to its upstream and downstream dependencies. Span metrics and traces reveal the request path across the entire call chain. Kubernetes labels anchor it to the pods, nodes, and clusters it runs on. Logs and profiles tie it to its own error lines and hot code paths. And a well-formed service.name is the identity that holds all of it together in the graph. Miss one, and a whole layer of the full-stack picture quietly disappears.
Based on the status of these checks, each service gets a single quality score, mapped to a human-readable tier so you can tell at a glance whether a service is well-instrumented or needs attention.
Quality tier | What it means | Score range |
Incomplete/Poor | Barely instrumented; most checks failing | 0-10% |
Bad/Poor | Significant gaps in telemetry | 11-25% |
OK/Good | Core telemetry present, room to improve | 26-50% |
Good/Very good | Well instrumented, minor recommendations | 51-99% |
Perfect | All applicable checks passing | 100% |
A rising score, then, isn't just a tidier telemetry checklist; it's a measure of full-stack visibility, and how much of your stack you can actually traverse when it matters.
Why use Grafana Cloud to measure instrumentation quality: an example
Other tools tell you whether a service is emitting data. Through the instrumentation quality report, Grafana Cloud’s Knowledge Graph tells you whether that data is good enough to troubleshoot with and what to fix when it isn't.
A day on call
Let’s say a checkout service starts breaching its latency SLO. Its instrumentation quality report is green: service graph metrics, Kubernetes labels, logs, and traces are all present, so the connections you need to investigate the issue are intact.
You follow the service graph to a slow payments dependency. From there, the Kubernetes labels connect the payments service to the node it’s running on, where you see that CPU is saturated. You can then jump to the service logs to find timeout errors and inspect a trace to confirm the root cause. Checkout → payments → node → logs → trace. Because the telemetry is properly instrumented and connected, you can follow the problem across the stack without hitting a dead end.
A sibling service that same week tells the opposite story. It shows up in metrics but nowhere in the graph: no dependencies, no neighbors, and the trail goes cold almost immediately. The instrumentation quality report explains why: a stray slash in its service.name has dropped it out of the graph, and the service isn’t emitting logs. With those two broken connections, the full-stack picture simply can’t be drawn.
The only real difference between the two incidents isn't how much telemetry each service produces; it’s whether the connecting signals are there. The quality report makes those missing connections visible, so you can fix them long before the next 3 a.m. page.
Find and fix instrumentation gaps
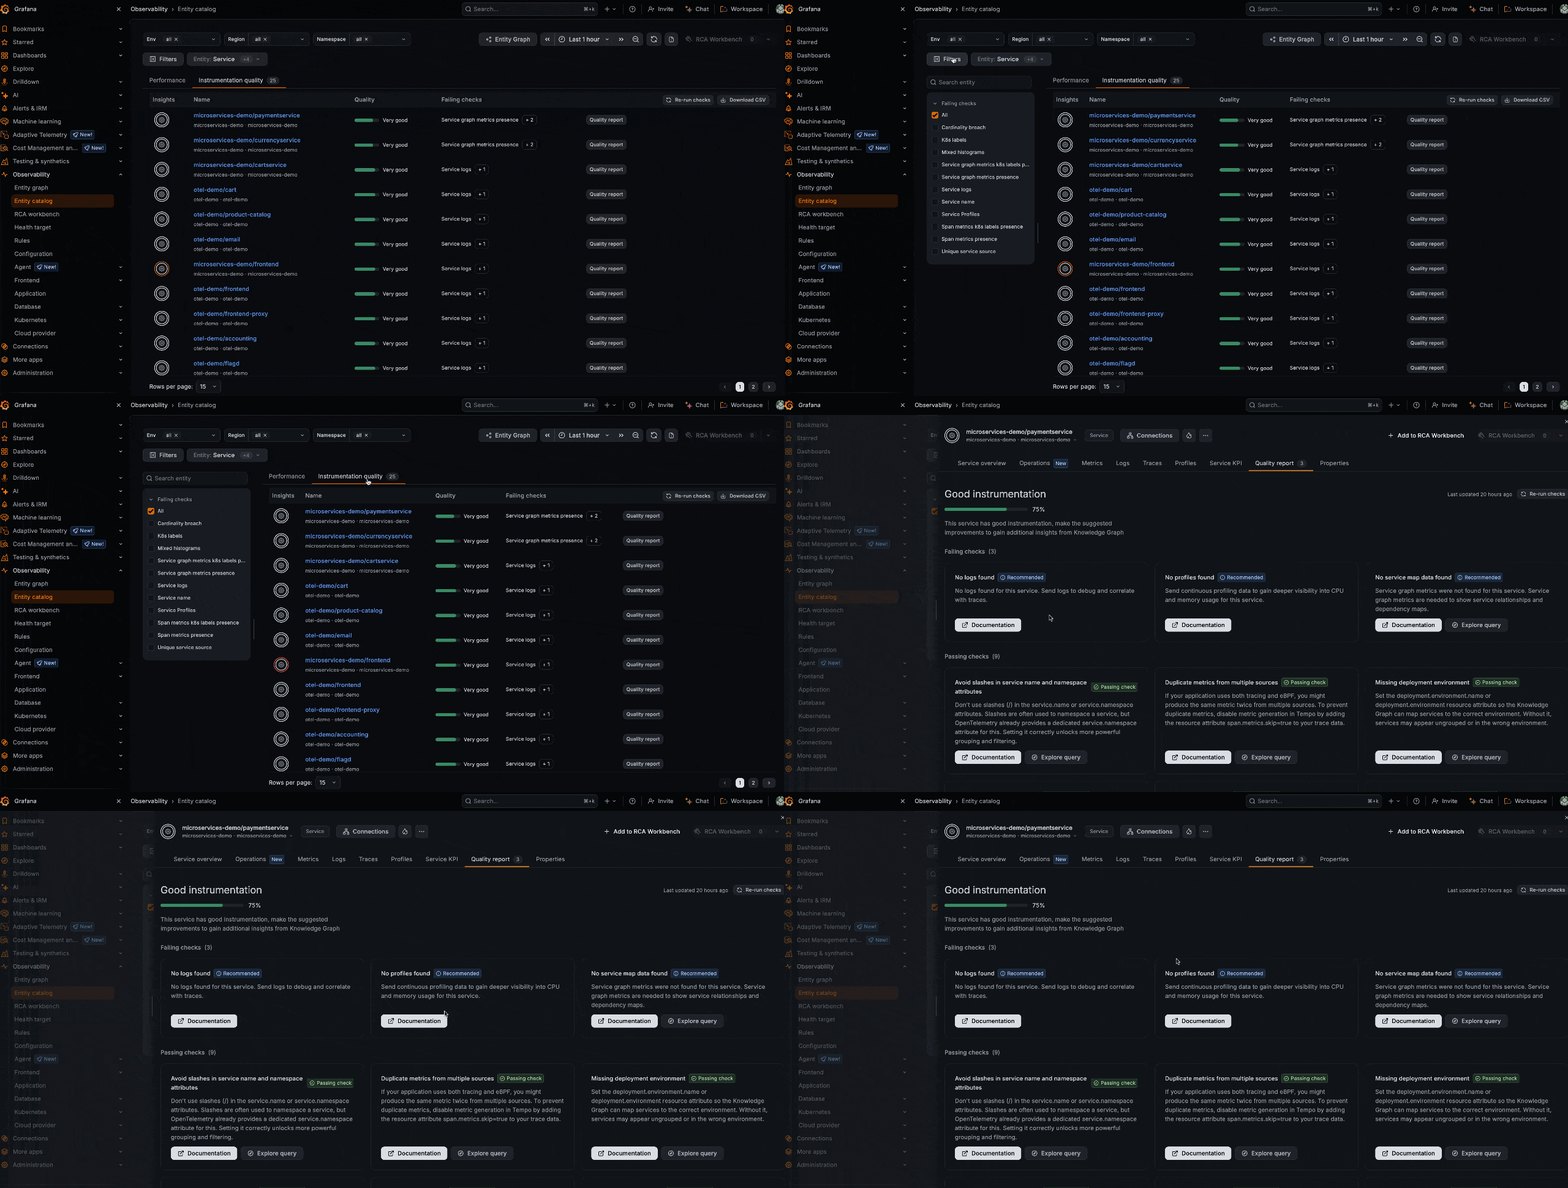
The instrumentation quality report turns a vague "improve observability" mandate into a prioritized to-do list. The Instrumentation quality tab scores every service and shows its failing checks, so you can quickly identify which services need the most attention. And every finding is actionable rather than just diagnostic: each failing check comes with details about the impact, a link to the exact setup docs, and, where applicable, an Explore query button to confirm the gap in seconds.
The report requires no additional setup and stays current as your services change. Services are scored automatically as they're discovered. There are no dashboards to build or rules to write, and the checks encode Grafana's own instrumentation best practices so a rising score is an objective measure of your observability maturity.
You can view instrumentation quality in two places, covering the full workflow of spotting problems across your fleet to fixing them for a single service:
List view (Entity catalog → Instrumentation quality tab): a fleet-wide table that scores every service and shows its failing checks, so you can quickly spot and prioritize services that need attention.
Service view (Entity drawer/entity page → Quality report tab): a report for an individual service that lists exactly which checks are passing and failing, their impact, relevant docs, and a query to verify each gap.
Here’s a closer look.
List view: find and prioritize gaps across your fleet
This view gives you a filterable table of every service and its instrumentation health. Each row shows:
- Insights: a health/assertions indicator (the Knowledge Graph "circle") for the service.
- Name: the service name with its environment and namespace as a subtitle (since the same name can exist in different scopes). Click it to open the entity drawer.
- Quality: a progress bar plus the tier label (Poor, Good, Very good, Perfect).
- Failing checks: the first failing check, plus a +N badge indicating how many additional check types are failing.
- Quality report: a button that takes you directly into the drawer's quality tab for that service.
You can filter the list by failing check type (multi-select is supported), search by service name, and scope by environment, site, and namespace. The tab badge shows the total number of services matching your current filters. When you need the data outside of Grafana Cloud, the Download CSV button exports the current page of results. The header also includes a Re-run checks button, which triggers an on-demand refresh of quality reports for the whole stack instead of waiting for the daily cycle.
%3Aquality(90)%2F&w=3840&q=75)
Note: This view is service-scoped; it always shows service entities and uses a slimmed-down filter sidebar tailored to instrumentation checks.
%3Aquality(90)%2F&w=3840&q=75)
Service view: diagnose and fix gaps for an individual service
Open any service (from the catalog, a graph, or an issue) and select the Quality report tab. This view is organized top to bottom as:
- Header: the quality title (e.g. "Good instrumentation"), a progress bar, the percentage, and a short description of what that score means. A Re-run checks control lets you refresh this stack's reports on demand.
- Failing checks (N): one card per failing check, each with:
- The check title
- A severity badge (Critical or Recommended)
- A description of the problem and its impact
- A documentation link to the relevant setup docs
- An optional Explore query button (shown when the check has a resolvable PromQL query and a metrics data source is available)
- Passing checks (N): one card per passing check, each marked with a "Passing check" badge, so you can confirm what's already working.
%3Aquality(90)%2F&w=3840&q=75)
The drawer tab badge always reflects the current failing-check count for that service.
The instrumentation quality report is also available through Grafana Assistant and through the gcx CLI. Ask Assistant about a service's instrumentation quality or which of your services need attention and it pulls up the scores and failing checks right in the conversation.
To learn more about using the instrumentation quality report, please check out our technical documentation.
Wrapping up
Good instrumentation is the foundation of every dashboard, alert, and investigation you rely on, but it can quietly degrade over time. The instrumentation quality report in Grafana Cloud’s Knowledge Graph makes any gaps visible and actionable, giving each service a quality score, a prioritized list of what’s missing, and guidance on how to fix it.
Instead of discovering telemetry gaps during an incident, you can find and close them ahead of time.
ObservabilityCON 2026 is live! Check out our blog post recapping all the big announcements!
%3Aquality(90)%2F&w=3840&q=75)


