

How to manage synthetic monitoring checks as code with Terraform and Grafana Cloud
As teams scale, managing synthetic monitoring checks manually in the UI becomes difficult and error-prone. When you're dealing with dozens of checks across multiple environments, teams experience inconsistent configurations, lack of version control, and difficulty tracking changes.
This is where managing your Grafana Cloud Synthetic Monitoring checks as code using Terraform can be valuable, allowing you to define checks programmatically, maintain version control, and deploy consistent configurations across environments. This helps you scale your synthetic monitoring strategy while ensuring reproducible setups.
In this blog post, we'll show you how to export a Grafana Cloud Synthetic Monitoring check from the UI, configure the Terraform provider, and deploy and update checks using Terraform. You can also learn more by watching the video below.

Why manage checks as code?
Grafana Cloud Synthetic Monitoring is a blackbox monitoring solution that lets you run a variety checks such as browser checks, HTTP checks, and DNS checks from globally distributed public probes or self-hosted private probes to proactively measure the availability, latency, and correctness of your service.
As your monitoring needs grow beyond a handful of checks, the manual UI-based approach becomes unsustainable. With each change to a check, you risk environments drifting out of sync, and there's no audit trail for modifications. While tools like Grizzly or the Grafana CLI can also help manage checks at scale, Terraform is our recommended approach
Terraform offers mature state management and broad ecosystem support for scalable monitoring operations. Managing checks as code with Terraform provides a consistent, scalable, and repeatable foundation for synthetic monitoring as your system grows, with key benefits including:
- Version control: Track every change to your monitoring configuration in Git
- Consistency: Ensure checks are configured identically across dev, staging, and production
- Collaboration: Review changes through pull requests before deployment
- Scalability: Deploy and manage hundreds of checks with a single command
- Reusability: Template similar checks and modify parameters as needed
The Terraform workflow for synthetic monitoring checks
A common Terraform workflow for synthetic monitoring checks looks like this:
1. Prototype in the Grafana UI: Start by creating your check in the UI to validate the configuration, test functionality, and explore available options. This prototyping approach is faster than writing configuration files from scratch.
2. Configure the Terraform provider: This tells Terraform which Grafana Cloud stack to manage.
3. Export the check to Terraform: Once exported, the check becomes a Terraform resource that you can modify and reuse.
4. Deploy and manage updates with Terraform: from this point forward, Terraform becomes the source of truth for modifying and managing checks.
Let's walk through each step.
Prototype in the Grafana UI
Start by creating your check in the UI. Once it has been created, we will collect our dedicated access token and probe API server URL.
1. In Grafana Cloud, navigate to Synthetic Monitoring and click Config.
2. Click Generate access token and copy the value.
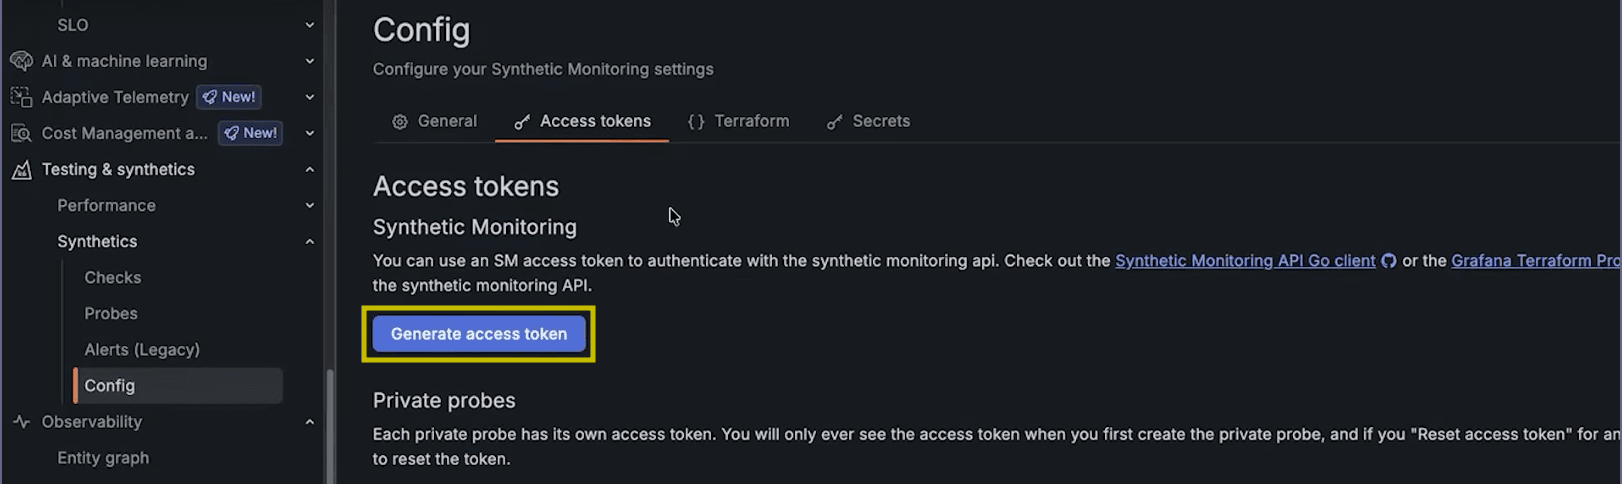
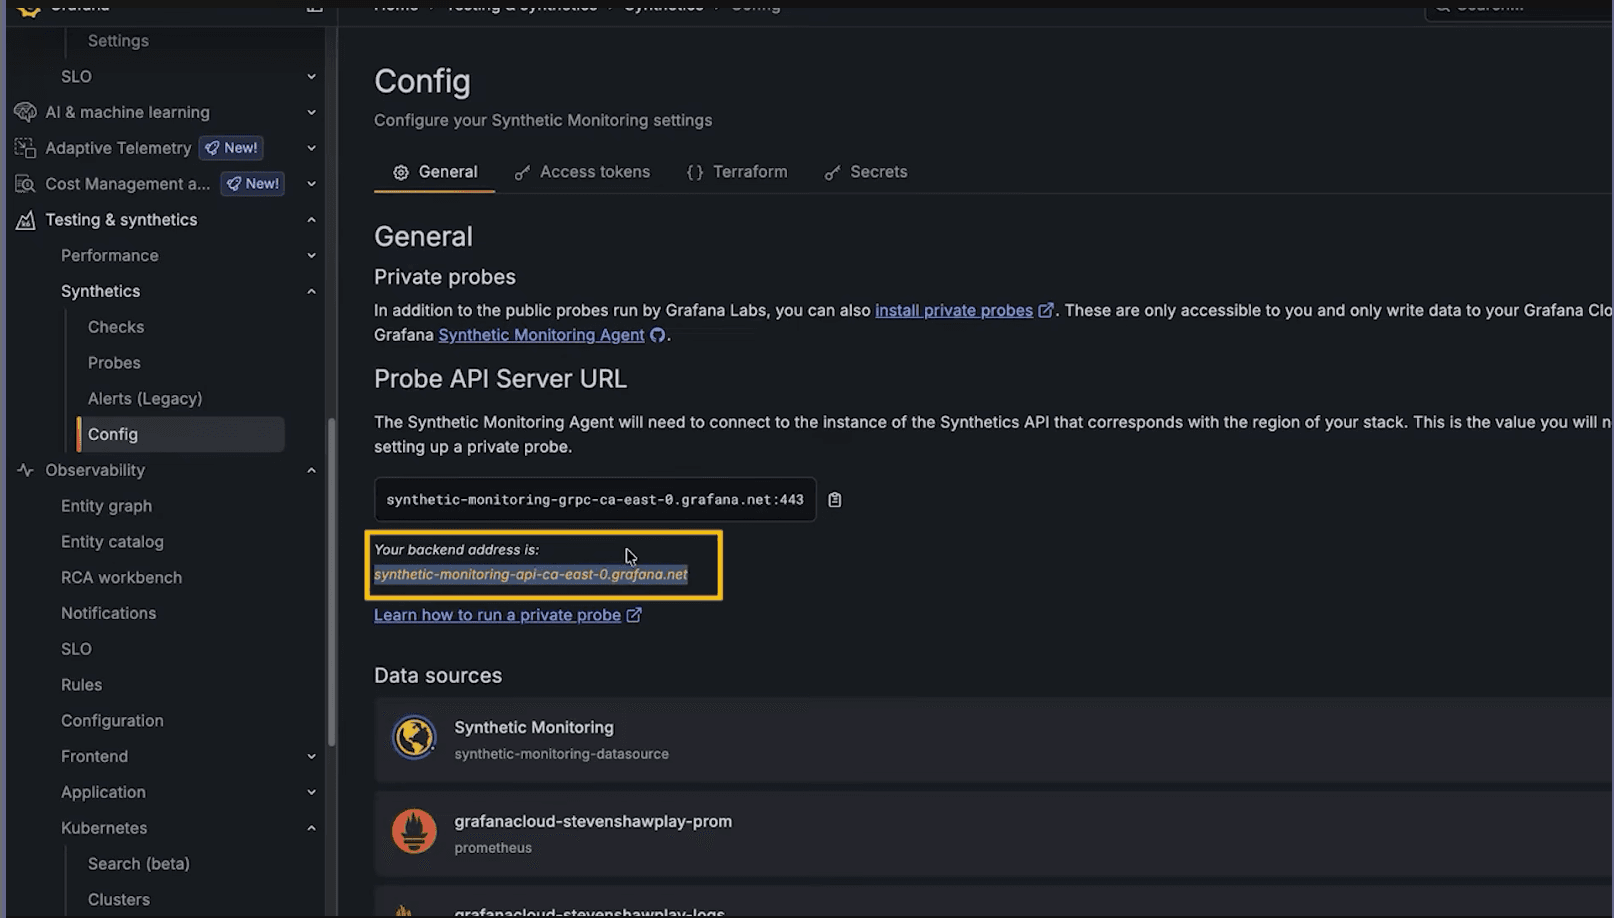
3. Note the API endpoint URL shown on this page, as you'll need it when configuring the Terraform provider.
Note: The Synthetic Monitoring provider uses a separate URL and access token from the standard Grafana Terraform provider. If you're managing other Grafana resources in the same Terraform workspace, you'll need both configured separately.
Next, we'll configure the provider in main.tf:
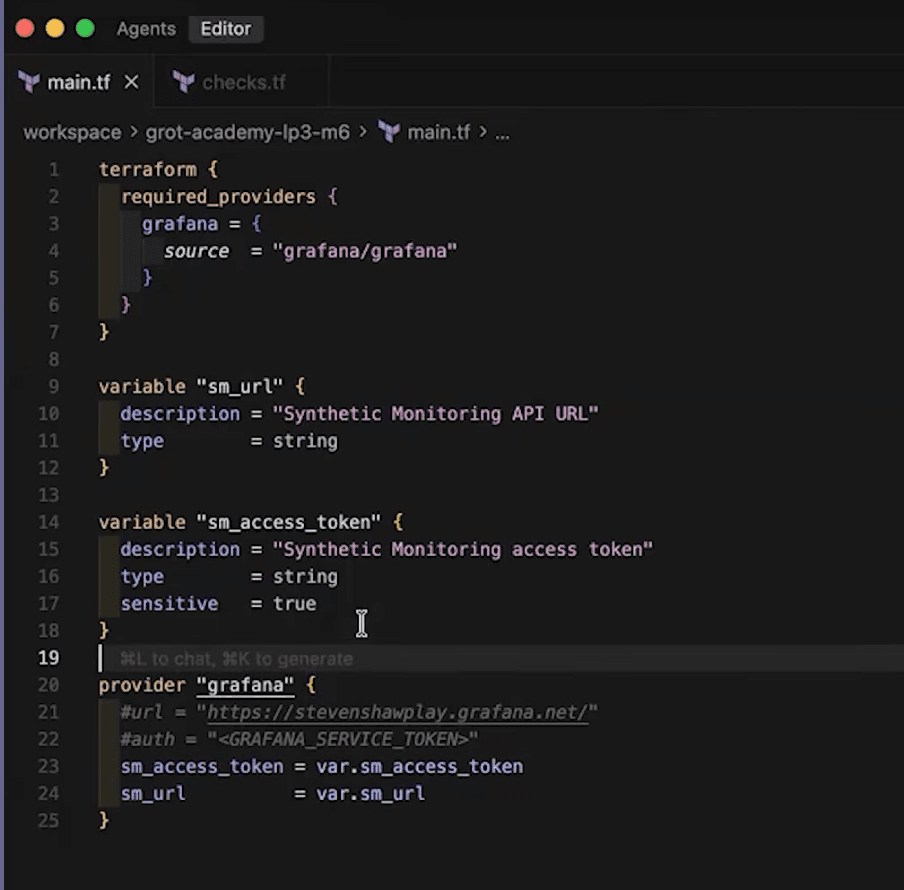
With that in place, we can initialize the Terraform provider:
terraform initExport your check as Terraform HCL
Rather than writing the resource config from scratch, Grafana can generate it for us directly from an existing check.
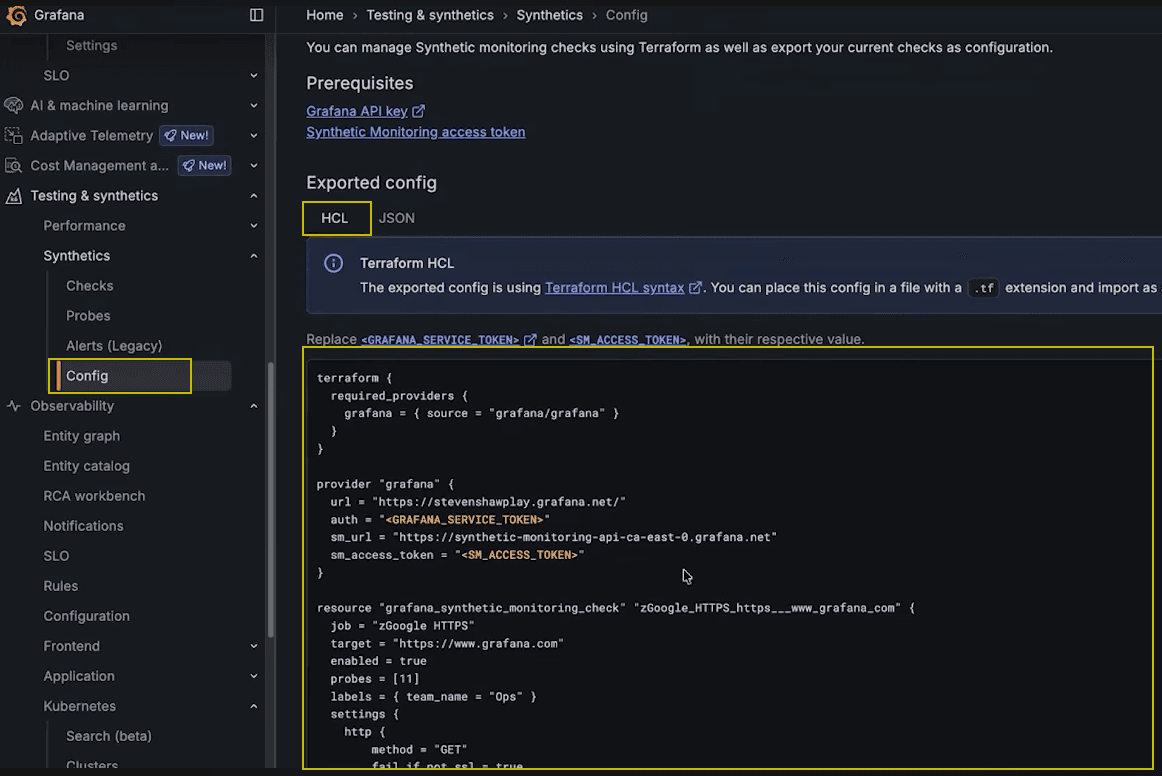
- In Grafana Cloud, go to Synthetic Monitoring and click Config.
- Select the Terraform tab and find the check you want to manage.
- Choose HCL format and copy the resource block.
The exported HCL will look something like this:
We'll paste this into a checks.tf file. From this point on, Terraform is the source of truth for this check.
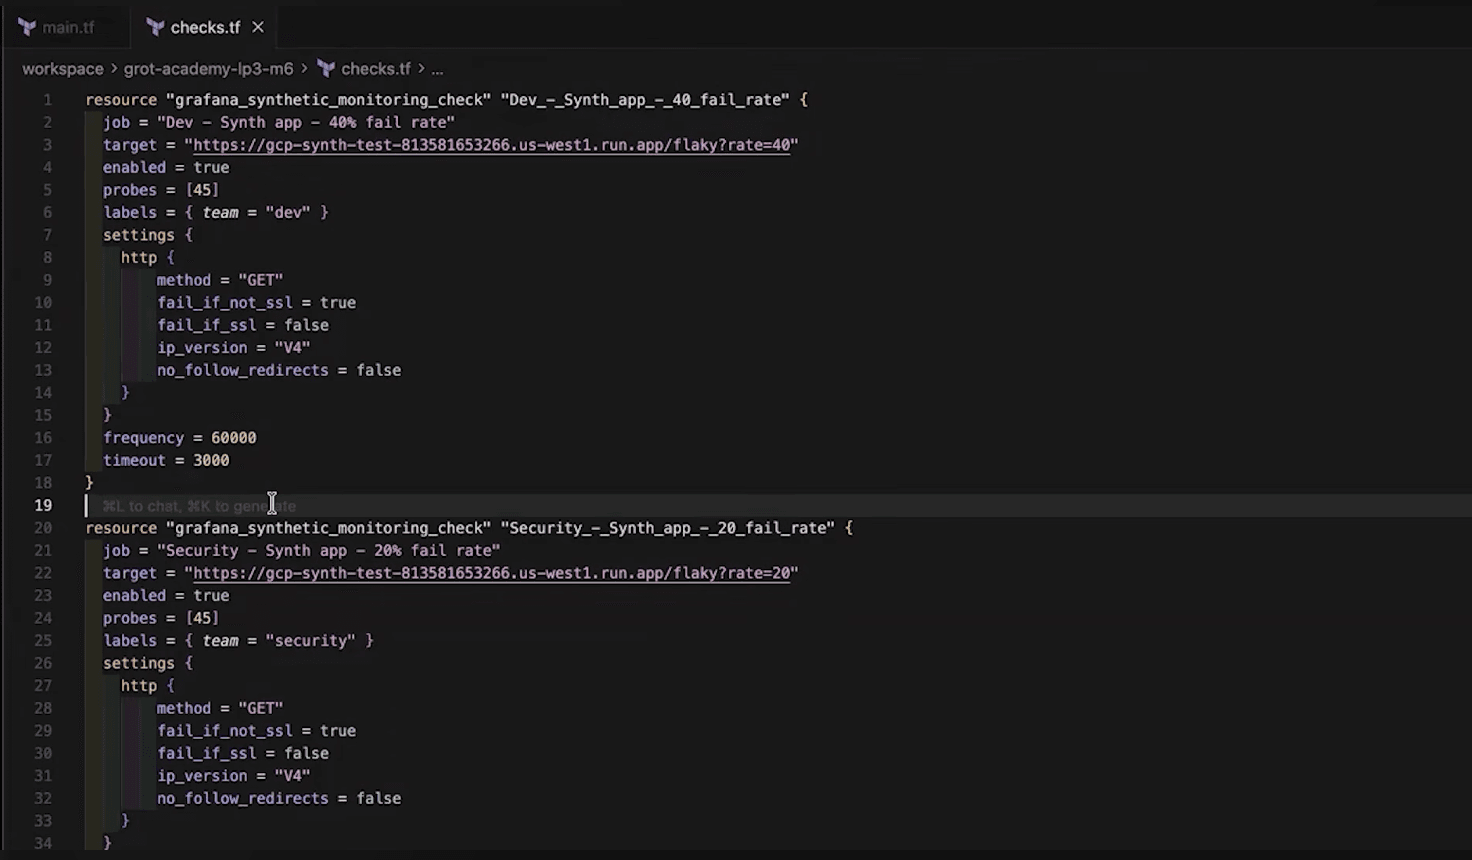
Deploy multiple checks
One of the key advantages of managing checks as code is being able to define multiple checks with consistent configuration. Here's an example with two team-specific checks, where one targets a dev environment and one enforces SSL validation for a security team endpoint.
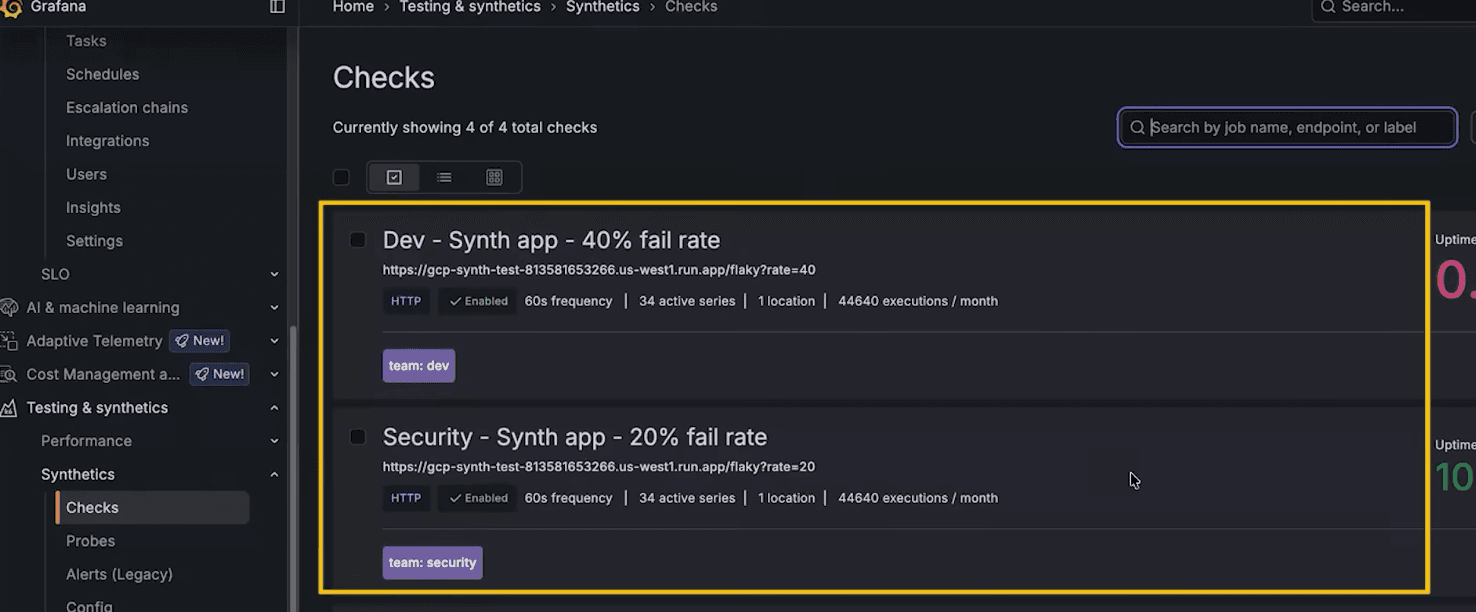
To deploy both checks, we run:
terraform applyTerraform will display a plan showing exactly what it's about to create and prompt us to confirm before making any changes. Once we approve, the new checks will appear in Grafana Cloud Synthetic Monitoring.
Update checks over time
Once our checks are in Terraform, making updates is straightforward. We edit the relevant fields in the .tf file and run terraform apply again. For example, to update the dev check to run every two minutes and reassign it to the dev-2 team, we update the frequency and label.
This makes it straightforward to review and audit changes, and integrates cleanly into a CI/CD pipeline where terraform plan output can be part of a pull request review process.
Note: Once you move to Terraform, avoid editing checks in the Grafana UI. After the first terraform apply, Terraform owns the state, and any changes made directly in the UI will be overwritten on the next apply.
Wrapping up
Managing synthetic monitoring checks as code with Terraform provides a consistent, scalable, and repeatable foundation for your checks as your system grows. By leveraging Grafana Cloud Synthetic Monitoring with Terraform, you can version, review, and deploy changes to your checks using the same workflows you already use for the rest of your infrastructure.
To learn more about provisioning Grafana Cloud Synthetic Monitoring resources, refer to our technical documentation. For a full Terraform reference on available check settings, including DNS, TCP, ping, and scripted checks, visit the Terraform Registry.
To gain even deeper insights into your apps and services, check out Grafana Cloud Frontend Observability for real user monitoring. It provides real-time, actionable insights into performance, errors, and user journeys across your applications. To learn more, refer to the technical documentation.
Grafana Cloud is the easiest way to get started with synthetic monitoring. We have a generous free tier that includes 100k test executions per month and more. Sign up for free now!

