
How to create and manage secrets with Grafana Cloud Synthetic Monitoring
Observability isn’t just about collecting metrics and logs; it’s about proactively validating that your systems work as expected. Synthetic monitoring helps teams continuously test APIs, applications, and critical user journeys. But when those checks require the use of sensitive data, securely managing credentials becomes essential to maintain both reliability and security.
Now generally available, secrets management in Grafana Cloud Synthetic Monitoring helps you achieve this, letting you run checks without hardcoding credentials into scripts. Sensitive data stays encrypted at rest and automatically redacted in logs and outputs, and can be rotated without modifying individual test configurations.
Put simply, secrets management provides a secure, centralized way to store and use sensitive credentials like API keys, passwords, and tokens in synthetic monitoring checks.
In this blog post, we’ll take a closer look at how secrets management works and how to create and use secrets in synthetic monitoring checks. You can also follow along with the video below.

What is secrets management in Synthetic Monitoring?
Grafana Cloud Synthetic Monitoring enables you to proactively monitor the performance of your applications and services from public and private probes located around the world. It allows you to set up a variety of checks, including ping checks, browser checks, HTTP checks, TCP checks, and DNS checks.
Some checks require sensitive credentials to test authenticated APIs, validate user workflows, or access external services. With secrets management, you can centrally and securely store API keys, passwords, tokens, and other sensitive data used in your checks.
Behind the scenes, secrets are encrypted at rest using envelope encryption. When a secret is referenced in a test, the value is automatically masked in the UI, scripts, and logs to prevent accidental exposure.
The key benefits of secrets management include:
- Centralized storage: All credentials are stored in one secure location, making it easy to manage and update access to sensitive data across all synthetic monitoring tests.
- Automatic redaction: Secret values are automatically masked in logs, error messages, and test outputs, preventing accidental exposure.
- Easy credential rotation: Update credentials in one place without modifying individual test scripts, reducing the risk of broken tests and ensuring seamless security updates.
Currently, secrets can only be used in scripted and scripted browser checks, but support for HTTP checks is coming in the future.
How to set up and use secrets management
Let's walk through setting up secrets in Grafana Cloud Synthetic Monitoring and using these secrets in a check.
Before creating secrets, it's important to understand that Grafana Cloud users with the Admin role can create, edit, and delete secrets by default. However, users with Editor and Checks writer roles can use secrets when editing tests. Make sure you review the RBAC documentation before proceeding.
1. Navigate to secrets configuration
In the Grafana Cloud UI, go to Testing & synthetics, then select Synthetics, and click Config. Next, click the Secrets tab. This is where you'll be able to create, update and manage secrets.

2. Create your secrets
Click Create secret to open the secret creation form. For this example, we'll create two secrets for logging into a demo application called QuickPizza.
For the first secret, please see the image below for how we set up this secret, which is the username for login.

For the second secret, please see the image below for how we set up this secret, which is the password for login.

Your secrets are now created and ready to use in a Synthetic Monitoring check!

3. Navigate to create a new check
Now let's use these created secrets in a Synthetic Monitoring test. Navigate to Testing & synthetics, select Synthetics, then Checks, and click Create a new check. Choose Browser as the check type.

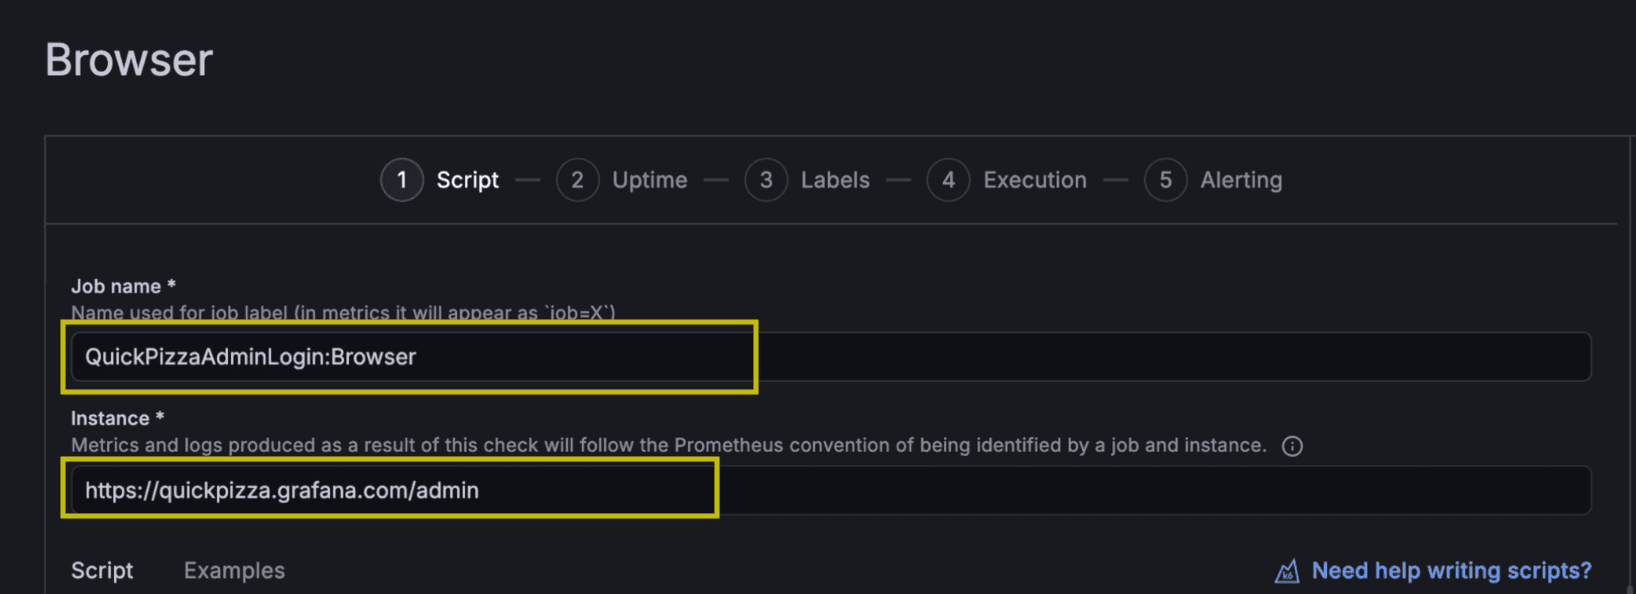
4. Configure the basic check settings
Provide a Job name. We'll use the name QuickPizzaAdminLogin: Browser.
We'll also choose www.quickpizza.com/admin as the target URL we're testing.
5. Import and reference secrets in your script
In the browser script, you'll need to import the k6/secrets module. Add this line to the script:
import secrets from 'k6/secrets';
Because we've created our secrets, you can use the secret name variable anywhere in your script. Here's an example of how to reference your secrets:
const username = secrets.get('QuickPizza Username');
const password = secrets.get('QuickPizza Password');
We will also log secret values to demonstrate the secrets management automatic redaction feature, which masks secret values in outputs to prevent accidental exposure of sensitive data in logs, error messages, and more:
javascriptconsole.logtry to log the secret value: ${username});

6. Create labels
Labels help you organize and filter your checks. Adding labels makes it easier to segment results by environment, service, or use case. We will choose the same labels as our secrets to keep our labels consistent with the secrets we created earlier. This makes it easier to identify all resources related to QuickPizza authentication in one place.

7. Choose probe locations
In the Execution section, you can choose between public and private probe locations. Grafana Cloud offers access to over 20 globally distributed probe locations. For this test, we'll select Calgary, Canada and Tokyo, Japan as the probe locations. We advise that you choose the locations closest to your users or infrastructure to best reflect their experience.

8. Test and save the check
Click the Test button to ensure the test works before saving. This validates that your secrets are properly referenced and the test executes successfully.
Once you've confirmed the test works, click Save to initiate the check. Grafana Cloud will begin executing based on your configuration. At this point, your scripted check using secrets is now active and running!
Visualize the check results and secret redaction
After letting our scripted check run for a few hours, it's time to review the results. Grafana Cloud Synthetic Monitoring provides a preconfigured dashboard for each check, giving you access to key insights.
Viewing redacted secrets in logs
One of the most powerful features of secrets management is automatic redaction. You can view the test logs by clicking into the check details. In the logs, you'll see that any secret values are automatically replaced with the placeholder. ***SECRET_REDACTED***.

How to manage your secrets
As your testing infrastructure evolves, you'll need to update or remove secrets. Here's how to manage and delete existing secrets.
Editing secrets
Navigate back to Config under Synthetics and select the Secrets tab.
To edit a secret, find the name of the secret you want to modify and click the Edit button next to it. You can update the name, description, value, or labels. Click Save to apply your changes.

Deleting secrets
To delete a secret, find the name of the secret you want to remove and click the trash icon next to it. Note that deleting a secret that's actively referenced in tests will cause those tests to fail, so make sure to update your test scripts before deleting secrets.

Wrapping up
Secrets management provides a secure, scalable way to handle authentication credentials across your synthetic monitoring infrastructure. The feature is now available to all Grafana Cloud users.
To learn more about Synthetic Monitoring and secrets management, refer to our technical documentation. You can also explore this dashboard on Grafana Play, which features a variety of running checks.
Lastly, while Synthetic Monitoring allows you to monitor your services, check out Grafana Cloud Frontend Observability to discover how your users are actually experiencing them, with real-time insights into performance, errors, and user journeys across your applications. To learn more, refer to the technical documentation.
Grafana Cloud is the easiest way to get started with Synthetic Monitoring. We have a generous free tier sign up for free now!

