
GrafanaCON 2026: On-demand sessions are now available
If you missed GrafanaCON 2026—or want to revisit the sessions that mattered most to your team—every session from Barcelona is now available on demand.
This year's lineup covered the breadth of how teams are building with Grafana right now: major releases (Grafana 13, k6 v2.0, Pyroscope 2.0), architectural deep dives into Loki and Alloy, the latest in Grafana Alerting and Grafana Assistant, and the customer stories that make GrafanaCON what it is—an event for a community building the observability tools they actually want to use.
We've grouped the highlights into two sections below. First, sessions from the Grafana Labs team. Then, sessions from the customers and community members building remarkable tools with Grafana.
From the Grafana Labs team
GrafanaCON 2026 keynote

Speakers: Raj Dutt, CEO and Co-founder; Torkel Ödegaard, CGO and Co-founder, Grafana Labs; with David Kaltschmidt, Poyzan Taneli, Ted Young, Mat Ryer, Sven Großmann, and Ward Bekker, Grafana Labs
The keynote official kickoff of GrafanaCON 2026—and the clearest statement yet of where Grafana is going next. Raj and Torkel frame the company's evolution from the default dashboard tool to an agentic observability cloud, then hand off to the engineering and product leaders walking through the marquee announcements: Grafana 13's general availability (dynamic dashboards, dashboard templates based on DORA, USE, and RED methods, saved queries, production-ready Git Sync, and more), Loki 4.0's Kafka-backed architecture (20x less data scanned, 10x faster queries), the OpenTelemetry 1.0 push including a single-command Linux package install, and a major expansion of Grafana Assistant—now available to Grafana OSS and Grafana Enterprise, the new gcx CLI in public preview, and Grafana AI Observability for monitoring agent quality in production. Plus the numbers: 35 million Grafana users, more than 1 million companies, and a furthest-right placement on the Gartner Magic Quadrant for completeness of vision. If you only watch one session, start here.
Grafana 13 deep dive
Speakers: Alexa Vargas Ortega, Dominik Prokop, Bogdan Matei, Stephanie Hingtgen, Artur Wierzbicki, and David Harris, Grafana Labs
Grafana 13 introduces major upgrades to dashboard authoring, operations, and extensibility, and this session is all about what's new and what it means for teams running Grafana at scale. Grafana Labs engineers walk through:
- Suggested dashboards and org-defined templates
- Dynamic dashboards—filter bars, section-level variables, auto grid, content outline navigation, and show-hide rules for context-aware panels
- Operational wins such as native dashboard restore, Grafana Advisor for proactive issue detection, SCIM, team folders, and Git Sync
- New data sources (Jenkins, SolarWinds, IBM DB2, Azure Managed Service for Prometheus, Cube), Private Data Source Connect over Tailscale, and the new Grafana Marketplace
AI-assisted testing with k6 2.0

Speakers: Théo Crevon and Andrey Slotin, Grafana Labs
k6 2.0 is built for a world where most engineers use AI to write code daily. The release brings a Playwright-inspired assertions API, an extension catalog with official and community tiers, and a new class of subcommand extensions—including agent, MCP, and docs—that turn k6 into a first-class tool inside Claude Code, Codex, Cursor, and other agentic workflows. The k6 Operator hits v1.0, the new GitHub Action makes CI integration trivial, and machine-readable outputs (OpenTelemetry, JSON) let test results flow straight back into your observability stack. There's also a live demo using Claude Code to generate a full browser and load test suite for Grafana Play in five minutes.
Pyroscope 2.0: Continuous profiling that scales
Speakers: Christian Simon and Alberto Soto, Grafana Labs
Pyroscope 2.0 shipped during GrafanaCON. The rearchitecture decouples reads from writes, eliminates persistent disks on the read path, and shards data by service rather than by series hash, which kills the symbol-duplication problem that drove Pyroscope v1's storage costs.
Production results from rolling this out across Grafana Cloud over the past year: up to 95% reduction in symbol data, around 74% lower memory and persistent volume costs in some cells, and a much smoother scaling story. The session closes with a live demo of new v2-only features: profile exemplars, the span heatmap panel, and the profiles-to-traces flow that makes incident debugging dramatically faster.
Inside Loki's new architecture for faster logging at petabyte scale
Speakers: Poyzan Taneli, Trevor Whitney, Ben Clive, and Jason Nochlin, Grafana Labs
The Loki team unpacks the next-generation architecture rolling out across the project. The big moves: a Kafka-backed write path with single-replica durability, a redesigned query engine that operates below log-line granularity, a new scheduler, and DataObjects—a columnar storage format that scans 20x less data and runs queries 10x faster on analytical workloads. Plus a novel bitmap-based index for needle-in-the-haystack searches, built on technology from the Logline acquisition, that keeps lookup costs predictable regardless of dataset size.
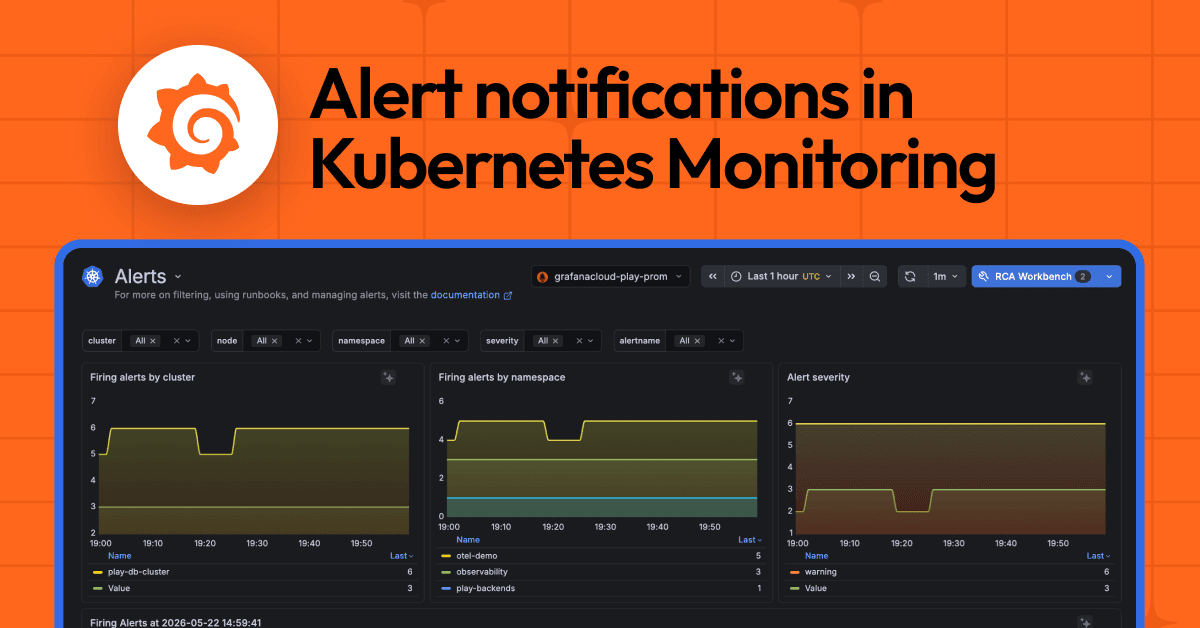
The latest in Grafana Alerting: One alert engine to rule them all
Speakers: Sonia Aguilar Peiron and Alexander Akhmetov, Grafana Labs
Grafana Labs is doubling down on Grafana Alerting as the single alerting engine for the whole stack, with more than 50 data sources and 22 integration types. This session covers the scaling work: compressed state, evaluation jitter, periodic saves, and a new active/standby HA mode in Grafana 13 that keeps database and data source load constant no matter how many replicas you run.
Multiple notification policy trees let each team own their routing without breaking anyone else's. The new import tool brings your existing Prometheus, Mimir, and Loki alert rules and Alertmanager config into Grafana with no copy-paste required—and it's fully compatible with mimirtool and cortextool. The new Alert Activity page makes it easy to see what's firing, what was notified, and what Grafana Assistant thinks you should look at next.
Scaling Grafana Assistant: Context, confidence, and AI observability
Speakers: Ivana Huckova and Yasir Ekinci, Grafana Labs
Building an AI assistant that's actually useful in production means solving three hard problems most teams underestimate: context, confident iteration, and observability of the agent itself. The session walks through context engineering in three layers—environment discovery, organizational knowledge, and real-time task context—and introduces Assistant infrastructure memory, which scans your observability data weekly to maintain a persistent picture of your environment. The skills framework captures repeatable workflows. A self-improvement loop (introspection, reflection, improvement) plus o11y-bench—an open source benchmark for observability agents—lets the team measure and improve Assistant quality with rigor.
Grafana Cloud AI Observability rounds it out by monitoring real agent behavior in production, with online evaluations for groundedness, security, and response quality.
Alloy's OpenTelemetry Engine: What's new and what's next
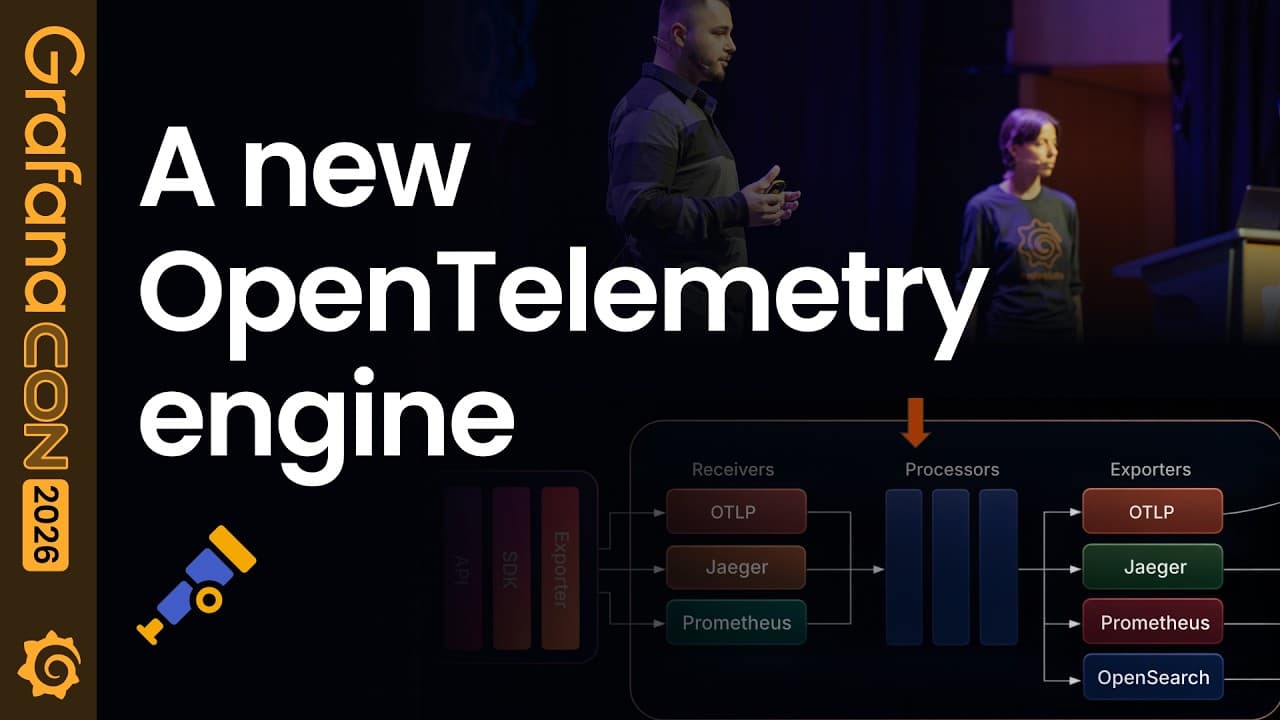
Speakers: Bejal Lewis and Marko Bachvarovski, Grafana Labs
If you're standardizing on OpenTelemetry but still want Alloy's Prometheus-native ergonomics, the new OpenTelemetry engine mode is for you. This session covers how the OpenTelemetry engine mode lets you configure Alloy using standard OpenTelemetry Collector YAML while keeping Alloy's Prometheus capabilities intact. Bejal and Marko walk through when to use the default engine vs. the OpenTelemetry engine, demonstrate the differences, and preview what's coming next—including remote management through Fleet Management.
Building self-service business analytics with Grafana
Speakers: Chris Shih, Senior Director of Analytics, Grafana Labs, and Sam Jewell, Staff Software Engineer, Grafana Labs
Grafana Labs runs its business on Grafana—not just infrastructure, but signups, sales pipeline, A/B tests, and customer health. As the company scaled, the analytics team built a self-service stack on open source (DuckDB, dbt, Cube, and Grafana MCP) with a semantic layer in front of the warehouse, so anyone in the business can ask data questions without writing SQL. Chris and Sam walk through how the semantic layer enables interactive filtering across dashboards, gives Grafana Assistant a grounded view of business data, and lowers the barrier for non-technical teams. A practical look at extending observability practices—dashboards, alerting, and now AI-powered self-service—beyond engineering.
From the Grafana community
All aboard: How Irish Rail built an intelligent railway monitoring platform with Grafana
Speakers: Richard Donovan, Technical Delivery Consultant, Irish Rail, and Seosaimh Ó Fátharta, CCE Systems & Standards Lead, Iarnród Éireann/Irish Rail
After evaluating multiple million-euro proprietary solutions that proved inflexible and prone to vendor lock-in, Irish Rail built IRIS (Irish Rail Intelligent Sensing) on Grafana, an MQTT Unified Namespace, and TimescaleDB. The platform now monitors more than 2,400 kilometers of railway infrastructure—trackside equipment, bridge sensors, passenger platforms, and other critical assets—and scaled from a single-sensor proof of concept to an ISA-95 compliant enterprise system integrated with SAP and ServiceNow. The result: a measurable reduction in mean time to notification for safety-critical events and a real predictive maintenance program.
Planet-scale dashboards at Google with Grafana
Speakers: Carl Bergquist, Principal Software Engineer, Grafana Labs, and Katia Giarda, Software Reliability Manager, Google
Google manages hundreds of thousands of interdependent services. Building one dashboard per service is unsustainable—by Katia's math, that's roughly 100,000 dashboards just for HTTP metrics. This session introduces the "scopes" concept Google and Grafana Labs are bringing to Grafana: a named set of filters that acts like a namespace, letting one expert-built dashboard apply to all relevant services automatically.
Carl walks through the implementation—runtime label injection, scope-aware dashboard navigation, automated scope generation from metric queries—and demos the live UI. Scopes are experimental and will be a Grafana Cloud and Grafana Enterprise feature, but most of the underlying capabilities (ad hoc filters, group-by variables, drill-down per panel, section-level variables) ship in open source.
Fully charged: How Drive Terra observes its entire e-bike business in Grafana, from battery health to inventory
Speaker: Mohammad Omar, CTO, Drive Terra
Drive Terra operates electric delivery bikes and battery-swap stations across the Middle East. IT also runs its entire business in Grafana. Real-time telemetry from each bike (voltage, fault codes, motor data, GPS every 10 seconds) flows through MQTT and into MongoDB and PostgreSQL, then surfaces in Grafana dashboards that refresh every five to 30 seconds. The same platform serves engineers debugging IoT issues, station operators managing inventory and on-station cameras, and the CEO tracking weekly KPIs. Mohammad's takeaway: "Observability is not just for the engineers, it's for the whole company."
Rapid development for nuclear-powered data centers with Grafana, machine learning, and Jupyter notebooks
Speakers: Christopher Field, Co-Founder and Principal Investigator, Theia Scientific, and Kevin Field, Professor & Vice President, University of Michigan / Theia Scientific
If fusion reactors are going to power the next generation of zero-carbon AI data centers, the materials research has to move faster. The Theia team built Theiascope—a platform that combines Grafana dashboards with Jupyter notebooks and machine learning models—to let scientists build custom ML applications on the fly, modify code live during experiments, and analyze data from electron microscopes in real time. The session includes a live look at automated defect detection on TRISO nuclear fuel particles.
Using Grafana to demonstrate the scale, impact, and awe of the world's fastest temporary network
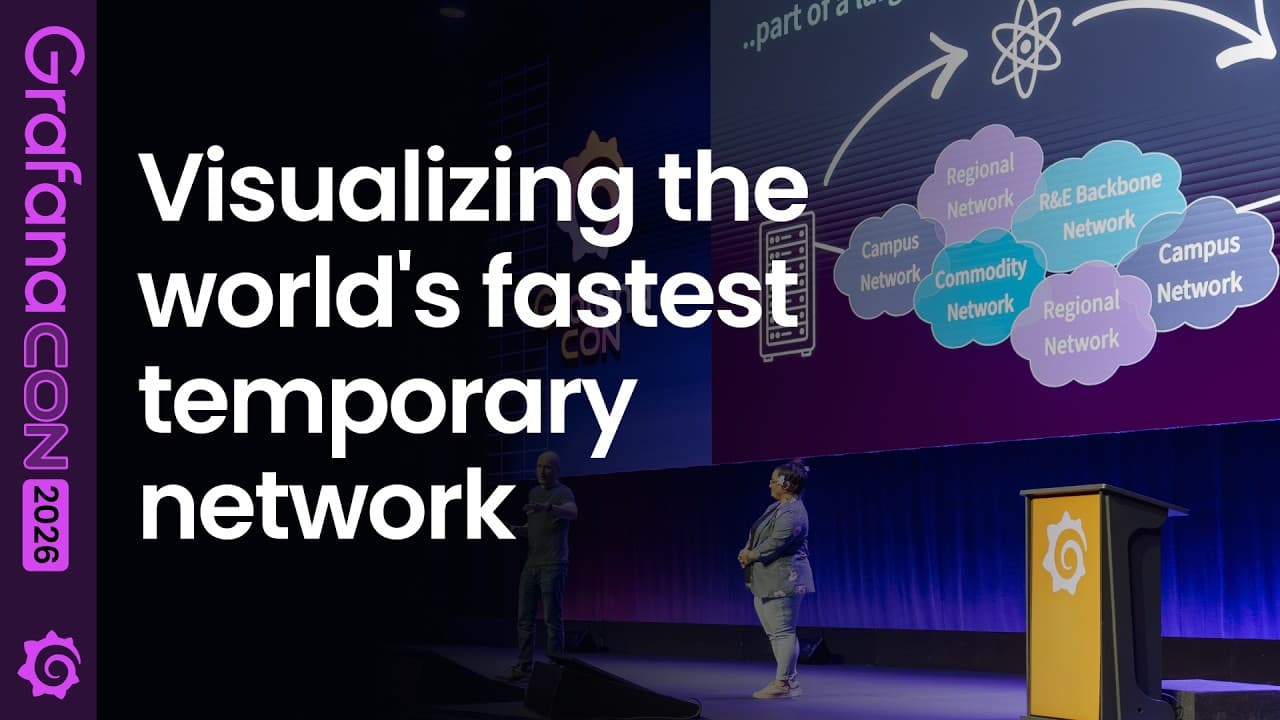
Speakers: Andrew Lake, Software Engineer, ESnet, and Katrina Turner, UX/UI and Data Viz Developer, ESnet
Every November, more than 200 volunteers build SCinet—the world's fastest temporary network — at the Supercomputing conference. Last year that meant 13.72 Tbps of bandwidth across $70 million of donated hardware, all stood up in a week and torn down in a day. Andrew and Katrina explain how they turned the network telemetry into a storytelling tool: the MetrANOVA pipeline, ClickHouse, custom Grafana plugins, and a one-question-per-dashboard kiosk format that drew attendees in instead of overwhelming them. This is a great look at observability as communication, not just operations.
Building a digital twin of the ocean: 4D ecological monitoring with robotics, AI-powered analytics, and Grafana
Speakers: Jacopo Aguzzi, Senior Researcher, Institut de Ciències del Mar (ICM-CSIC), and Enoc Martínez, Assistant Professor, UPC
The DIGI4ECO Horizon Europe project is building a 4D digital twin of the ocean to support EU marine restoration policy. Robotic platforms—cabled observatories, landers, and autonomous crawlers—stream biological, acoustic, and geochemical data from four sites across Ireland, Sweden, Italy, and Spain into a shared backend. Grafana is the front end: time-series visualizations of conductivity, temperature, and depth sensors, pre-computed acoustic spectrograms, AI-powered fish detection, sensor lifecycle dashboards, and IT infrastructure monitoring. Seventeen years of OBSEA seafloor data, visualized in one place.
You can check out all of these on-demand sessions and more on the GrafanaCON 2026 website. And if you want to explore other upcoming events—both in-person and virtual—check out the Grafana Labs events page.

