

%3Aquality(90)%2F&w=3840&q=75)
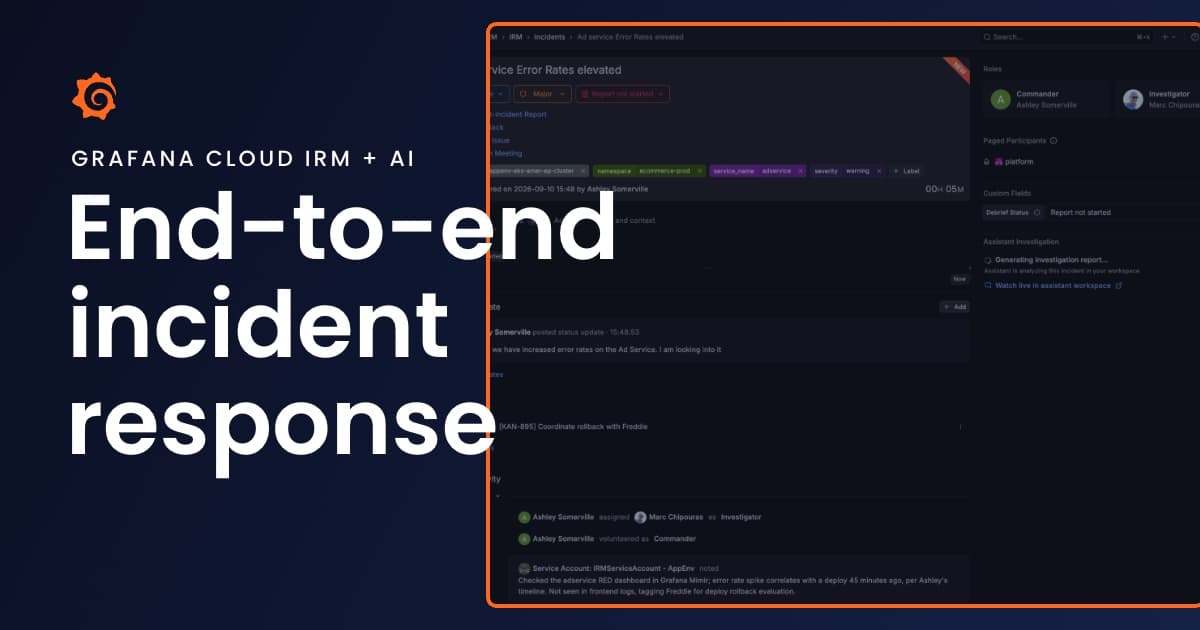
Go from alert to post-incident review with Grafana Cloud IRM and AI


You’ve got 10 minutes before your next meeting when your phone starts ringing. You’re being paged because the frontend is erroring with failed API requests.
You open one tool to see what fired, then another to figure out what’s going on. You message a teammate in Slack to see if they’re noticing the same thing.
That’s a lot of context switching, and it’s still how a lot of teams' incident response works today. Opening another tool and catching someone up takes time. Details can get lost when you manually copy context from one place to another.
It doesn’t have to be this way. With Grafana Cloud IRM, you get on-call support, incident management, chatops in Slack or Microsoft Teams, investigations, and the Grafana mobile app, all connected through the incident record. Let’s follow the frontend incident from the first page through the response and post-incident review to illustrate how your team can start improving their processes today.
The page already has context
When you get paged, you need to understand how serious the problem is and what to check first. With IRM, you’re starting with more than an alert name.
When you open the alert group, it shows the affected service, the dashboard panel tied to the alert, its history, and how many individual alerts were folded into the page.
%3Aquality(90)%2F&w=3840&q=75)
Imagine the difference between “the frontend is exposing API errors" and “the frontend is exposing HTTP 500 errors from the adService, the issue has already flapped twice in 24 hours, and three related alerts are firing in the same alert group.”
Figuring out what else is affected
Next, you need to figure out whether the frontend errors are isolated or part of something bigger, and whether the platform team is getting paged, too.
A lot of teams will do this by bouncing between dashboards, service maps, observability data, and Slack or Teams.
From the Slack thread, you ask Grafana Assistant, “What else is firing, and how is it related?”
It uses the same alert context you’re looking at and posts the answer back in the same thread.
%3Aquality(90)%2F&w=3840&q=75)
Click Investigate this alert in the Slack message to get a quick summary of what’s firing and suggestions for what to check next.
Everyone in the thread can see what Assistant found, including teammates who join the response later. If someone has a follow-up, they can ask @Grafana in the thread.
%3Aquality(90)%2F&w=3840&q=75)
You can ask it to help write a query to check the frontend’s error rate or find the dashboard you need. You can also give Assistant a service-specific playbook through Skills.
Declaring the incident
Once it’s clear this needs a coordinated response, you declare an incident in IRM.
As soon as you do so, IRM handles a number of automated actions for you, removing the need for manual creation every time. You immediately have a dedicated Slack channel, a Zoom call, and an AI investigation that starts looking for the root cause.
You don’t need to worry about the team remembering to create these components. The system does it for you.
%3Aquality(90)%2F&w=3840&q=75)
Keeping the messy stuff
A lot of the useful information shows up in Slack before anyone knows if it matters.
A teammate remembers a deployment from earlier and suggests it might explain the frontend errors. Someone else has a hypothesis about a dependency. Another person spots something weird on a dashboard.
Usually some of that makes it into the incident record and the rest dies in Slack history.
In IRM, a teammate can react to a Slack message with the robot emoji and drop it onto the incident timeline. The original message, author, and timestamp come with it.
It doesn’t have to be a proven theory. The point is to retain potentially useful context while everyone is still figuring things out.
Managing the incident from Slack
Once the response is underway, the incident commander is juggling roles, tasks, comms, other teams, and the actual investigation.
That can happen in the incident channel without leaving Slack. You can assign roles, create tasks with quick actions, and sync those tasks to Jira or GitHub so they still exist after the incident is closed.
If another team needs to get involved, you can page them from the same place instead of hunting down their on-call schedule. Even better, enter "@Grafana assistant - who is on call?"
The incident owners post status updates that are shared in Slack and pushed to the mobile app so stakeholders can follow along.
%3Aquality(90)%2F&w=3840&q=75)
An investigation you can actually inspect
The AI investigation starts automatically when you declare the incident.
It takes the context that’s already there (alert data, linked dashboard panels, the timeline, and anything people added from Slack), combines it with your actual data, and starts forming hypotheses about what caused the problem.
The Assistant Workspace feature provides a collaborative environment for you to work alongside the agent and track what it's doing, finding, and thinking.
You can add a hypothesis, reopen one that got dismissed, mark something disproven, or ask the investigation a question. You can also see the sources behind its conclusions.
%3Aquality(90)%2F&w=3840&q=75)
A root-cause suggestion is a lot more useful when you can see the evidence, rather than having to decide whether to simply trust a black box. The investigation points to errors from the ad service reaching the frontend as 500 responses. The investigation can also correlate information from outside Grafana through MCP integrations. For example, it checks the earlier deployment hypothesis by checking GitHub directly and finds no evidence linking it to the errors.
It doesn’t matter that it started as a random Slack message. Once it’s in the incident context, it gets evaluated with everything else.
%3Aquality(90)%2F&w=3840&q=75)
Turning the root cause into the incident record
Once you’ve reviewed the evidence for the leading hypothesis, the findings are added to the incident timeline and shared in Slack as well as pushed to the mobile app. That skips the usual cleanup job of taking what engineering figured out and rewriting it somewhere else so people outside the incident can follow it.
%3Aquality(90)%2F&w=3840&q=75)
Resolving the incident: mobile app FTW!
You’ve found the root cause with help from the AI investigation and applied a fix to mitigate the issue. You know you still need to write up a post-incident review (PIR), but it’s easy to forget once everyone is back to their normal work.
Thankfully, with the Grafana mobile app, you can keep working from your phone, whether you’re responding to an incident or sorting out your next on-call shift.
So even if you can't get to the PIR immediately and some of the details become fuzzy in your memory, the incident record, timeline, investigation, hypotheses, and sources are all available in the mobile app.
Simply open the investigation on your phone and ask Assistant to create the post-incident review and send it to Confluence. The review is generated from the same history and evidence the team already used during the response. You’re not reconstructing the timeline from memory.
%3Aquality(90)%2F&w=3840&q=75)
Why this matters
Your team still works in Slack, joins calls, and writes reviews in the tools it already uses. The incident record keeps that work connected. Check out Grafana Cloud IRM today to see how it looks against your own alerts
Grafana Assistant is the easiest way to get started with metrics, logs, traces, dashboards, and more in Grafana Cloud. We have a generous forever-free tier and plans for every use case. Sign up for free now!


