

Generating metrics from traces with cardinality control: A closer look at HyperLogLog in Tempo
While tracing is a critical component of any observability strategy, metrics — especially RED metrics (request rate, error rate, and duration) — are widely considered the gold standard for monitoring service health.
Tempo, the open source, easy-to-use, and highly scalable distributed tracing backend, is well known in the OSS community for storing and querying traces. It can also, however, generate RED metrics directly from those traces using the optional metrics-generator component. That means if your applications are instrumented with tracing but not metrics, Tempo can bridge the gap, automatically producing span-based metrics and pushing them to Mimir.
While this is a powerful feature, it has introduced some challenges related to cardinality.
In this post, we’ll take a closer look at the metrics-generator component in Tempo, and how recent updates in the Tempo 2.10 release help with cardinality management and estimates.
Generating metrics from traces
When Tempo receives spans from a collector such as Alloy, it can use the optional metrics-generator component to generate metric series from traces and push them to Mimir.

There are three main metrics that are produced, as outlined in our span metrics docs:
Metric | Type | Labels | Description |
traces_spanmetrics_latency | Histogram | Dimensions | Duration of the span |
traces_spanmetrics_calls_total | Counter | Dimensions | Total count of the span |
traces_spanmetrics_size_total | Counter | Dimensions | Total size of spans ingested |
Because a list of labels, such as the status code, are included by default, you can derive the RED metrics.
The cardinality challenge
The risk of generating metrics automatically, however, is causing a cardinality explosion, which can cause an unexpected increase in your metrics bill. By cardinality, we mean the number of unique elements in a set, or in this case, the number of unique metric series. If your spans have high cardinality in their attributes — for instance, in the span name — the generated metrics will also have high cardinality.
Fortunately, Grafana comes with a built-in dashboard to help you visualize and manage cardinality.

In addition, Tempo provides the max_active_series configuration field to prevent explosions.
overrides:
  defaults:
    metrics_generator:
      processors: [service-graphs, span-metrics]
      max_active_series: 500000
Let's say you have set the limit to 500,000. Once you reach this limit, no new series will be generated. However, there is a blind spot: you won’t know how many series are being dropped or what the total demand for active series is.
Our first approach to solving this problem was to calculate the actual cardinality, but this proved unsustainable. To compute the exact cardinality, this required 16 bytes for each series: 8 bytes to identify each unique series with a 64-bit hash and 8 bytes for a timestamp showing the last time each series was updated, so we could drop stale series. This means that, for instance, a tenant generating half a million series would consume 8MB of memory in the metrics-generator. Given thousands of tenants, the memory usage would soon reach the order of gigabytes.
This is where HyperLogLog comes in.
HyperLogLog to the rescue
HyperLogLog is a probabilistic data structure that allows you to estimate cardinality using very little memory. In our case, we’ve found that we only need 5KB, which is 99.9% less per tenant without having to store the rejected series in memory. What’s more, the estimate only has a 3% error versus the actual number.
If you look at the code, you can see our implementation of the HyperLogLog algorithm within the metrics-generator and some comments on how it works. Essentially, we are not using a single HyperLogLog instance (or sketch, as it is usually called); instead, we are using a sliding window of HyperLogLog sketches. The reason is that HyperLogLog is great at counting things, but can’t subtract elements once they have been counted. This is a limitation of the data structure.

Subtracting what has already been counted
The reason we need to subtract metric series from the count is that we don't want to count stale series. A series becomes stale by default after 15 minutes if it hasn't received any new data points. It doesn’t make sense to keep it in memory indefinitely, as it may never receive more data.
Given that we cannot decrement the count, the solution is to use a sliding window of HyperLogLog sketches, dropping the oldest every 5 minutes and replacing it with a new sketch to count the current 5-minute interval. This brings us to another cool feature of HyperLogLog: while you cannot subtract, you can merge sketches. So if you count the number of metric series in each 5-minute interval, you can merge them to estimate the total cardinality in the last 15 minutes.
HyperLogLog precision
When you create a sketch in HyperLogLog, you have to specify the precision. The higher it is, the more memory it uses but the smaller the standard error, given by the formula 1.04/√m. For our use case, we have decided to use a precision of 10, which uses only 1 kilobyte per sketch and results in a standard error of only 3%.
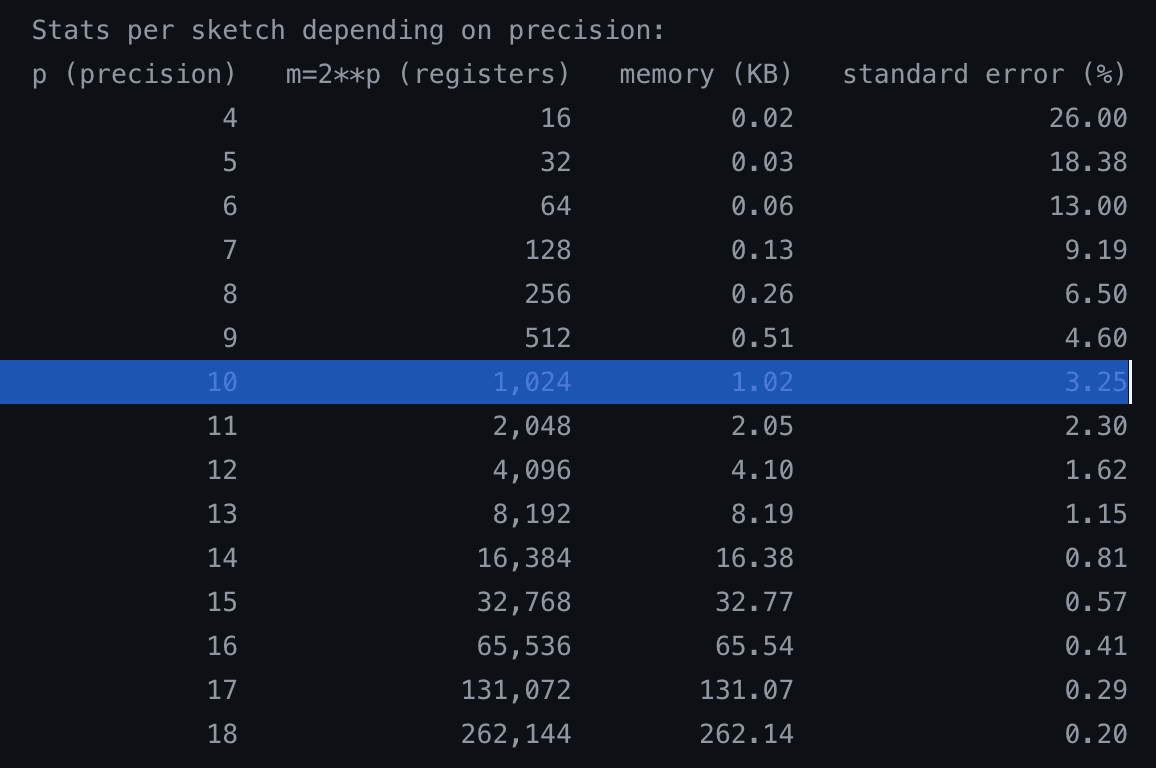
Counterintuitively, this data structure/algorithm uses constant memory, regardless of whether the cardinality is 1000 or 1 billion.
We have deployed this to Grafana Cloud to analyze the deviation between the estimate using HyperLogLog and the actual cardinality. In practice, we have observed the deviation to be around 3% or less most of the time. The graph shows some spikes, but they converge very quickly, so the theoretical standard error of 3% matches empirically.

Deviation between the estimate using HyperLogLog and the actual cardinality across time, per tenant and metrics-generator pod pair.
If we zoom into a specific tenant, we can see the actual cardinality versus the estimate; the numbers track really closely.

Cardinality estimate using HyperLogLog (green) and the actual cardinality (yellow) across time for a single tenant
If you're interested in knowing more about how HyperLogLog works, check out this paper from Google.
How to get started
This new feature, which landed in Tempo 2.10, provides critical visibility into how many metrics series are generated from your traces and how many are being dropped due to limits. Here’s some info on how to get started with these new cardinality management features in the metrics-generator component:
1. Self-hosted Tempo: You can now see the metric tempo_metrics_generator_registry_active_series_demand_estimate. This tells you exactly how far over the limit a tenant is, helping you decide whether to increase quotas.
2. Grafana Cloud Traces: You can now see the metric grafanacloud_traces_instance_metrics_generator_active_series_demand_estimate. This allows you to forecast metric usage before fully enabling collection. If the estimate predicts 1 million series, you know in advance that you may need to reduce cardinality in the collector or via filters before incurring costs.
To learn more about these updates, please check out our Tempo 2.10 release notes, as well as our metrics-generator documentation.
Grafana Cloud is the easiest way to get started with metrics, logs, traces, dashboards, and more. We have a generous forever-free tier and plans for every use case. Sign up for free now!

