From signals to savings: Optimizing cloud costs with Grafana Assistant and MCP servers
In today's cloud-native environments, managing resource waste and optimizing costs can feel like a constant battle. Operators, along with their fearless FinOps teams, spend countless hours hunting down unused resources, deciphering complex telemetry data, and manually implementing code or configuration changes to try to reduce cloud costs. But what if you could automate the entire process, from identifying waste to implementing the fix, all based on actual production telemetry?
By combining the power of Grafana Assistant, the AI-powered agent built directly into Grafana Cloud, with Model Context Protocol (MCP) servers, you can do just that.
In this post, we’ll explore how you can use Grafana Assistant to analyze your environment and identify cost optimization opportunities, all without writing complex queries. Then, we’ll walk through an example of how Assistant can integrate with MCP servers, including the GitHub MCP server, to apply those optimizations automatically.
Cost-saving insights from Grafana Assistant (no PromQL required)
The journey to savings starts simply with some Grafana Assistant prompts.
Instead of writing complex PromQL queries to aggregate and analyze cluster data, you can simply ask Assistant in natural language.
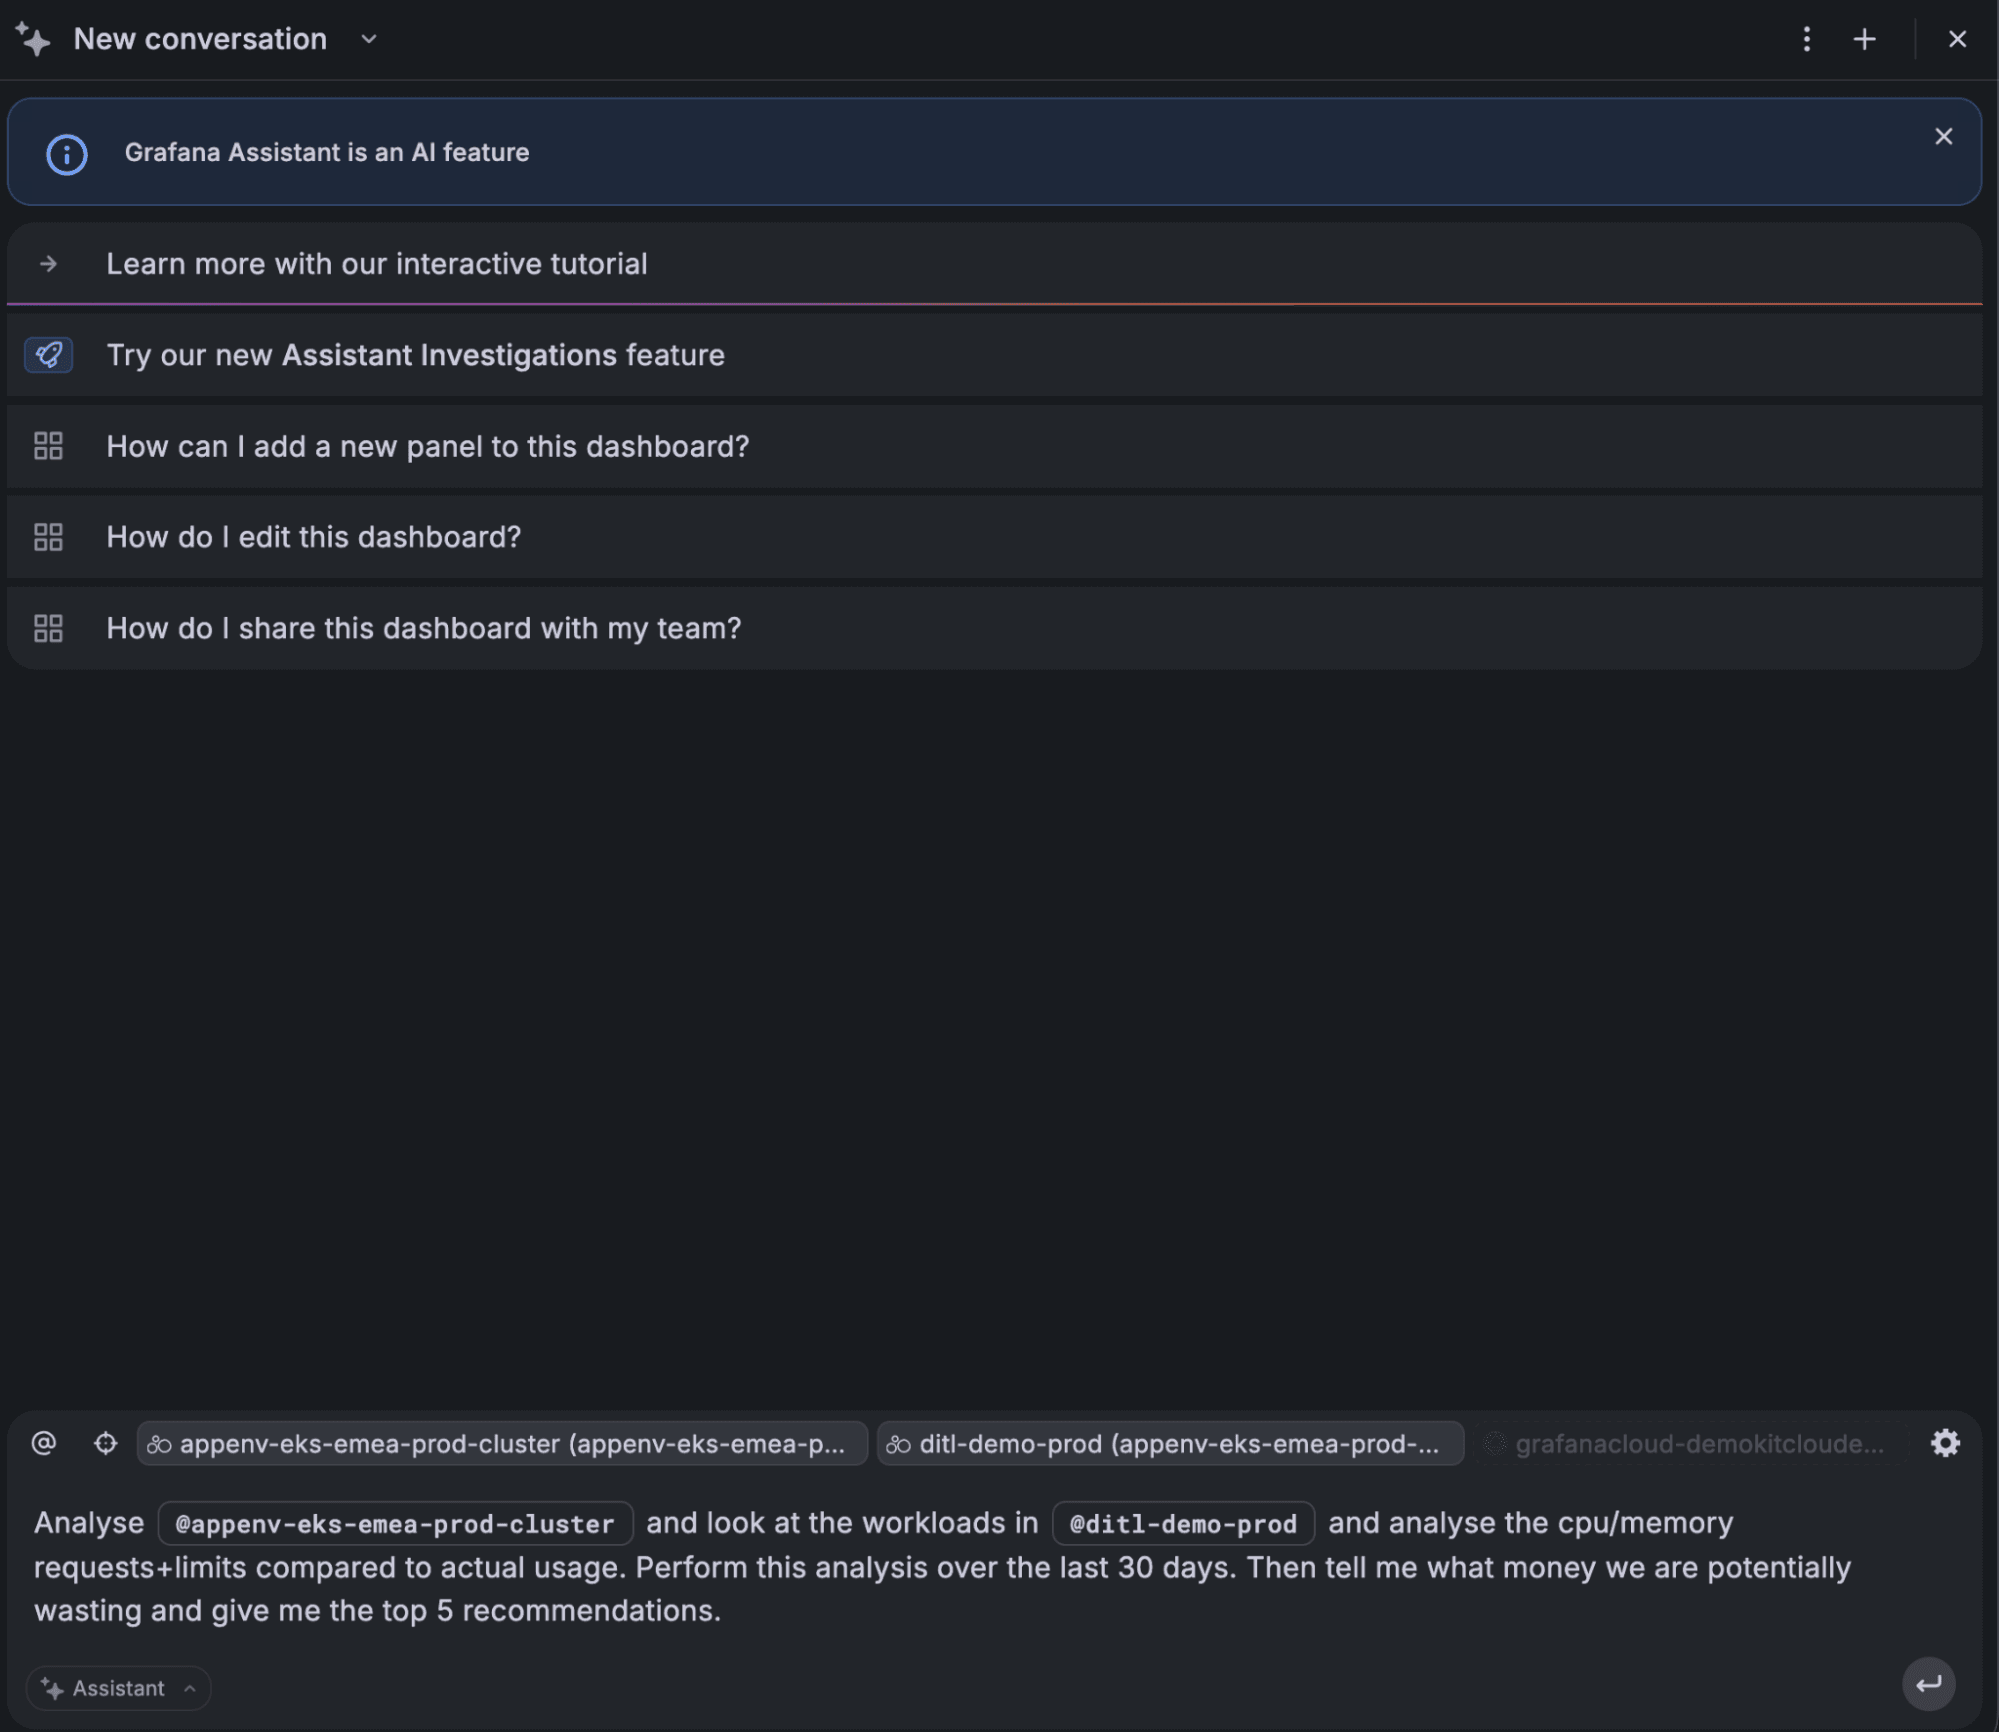
By specifying the cluster and namespace you want to analyze, Assistant interprets your request and automatically generates the necessary queries behind the scenes.
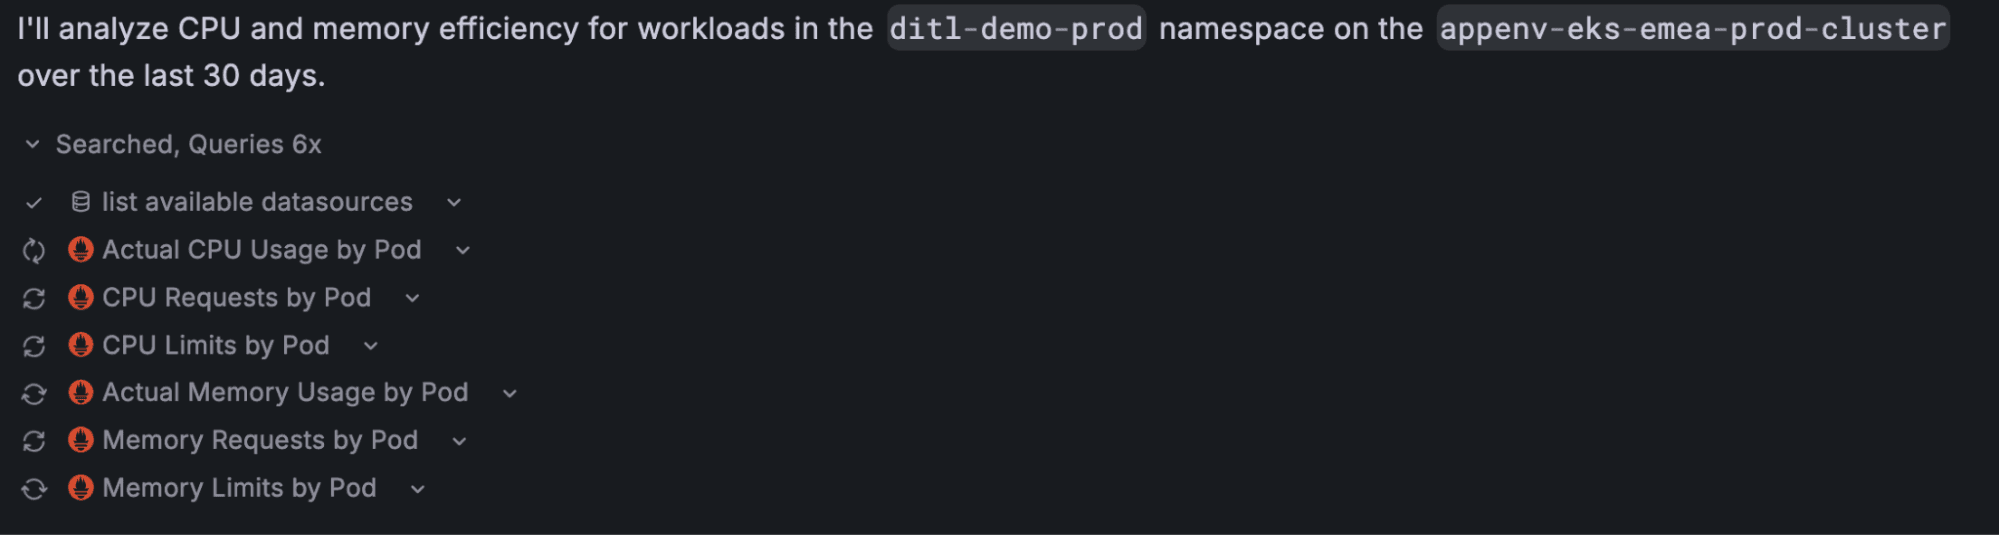
Within seconds, Assistant produces a comprehensive analysis of resource utilization across your workloads. This includes:
1. Immediate waste analysis: Assistant delivers a comprehensive summary of resource waste, analyzing CPU and memory requests vs actual usage over the last 30 days.
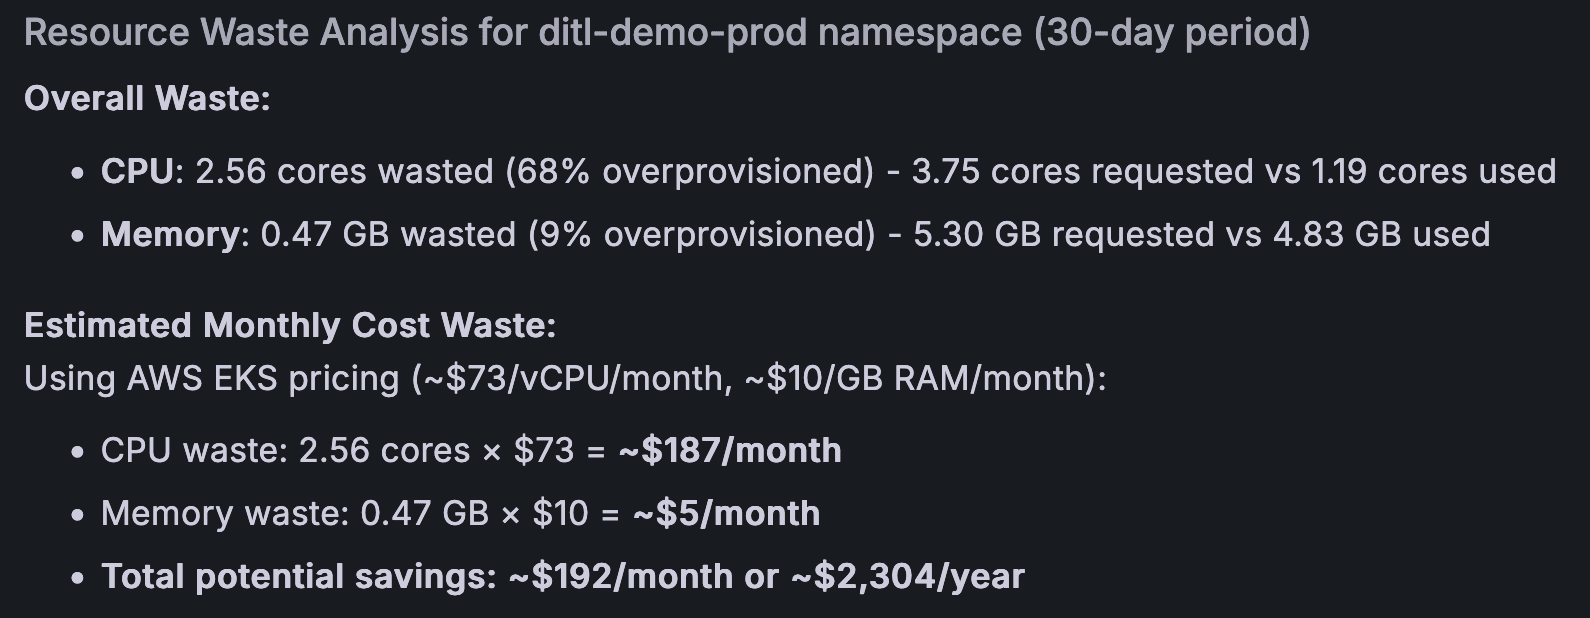
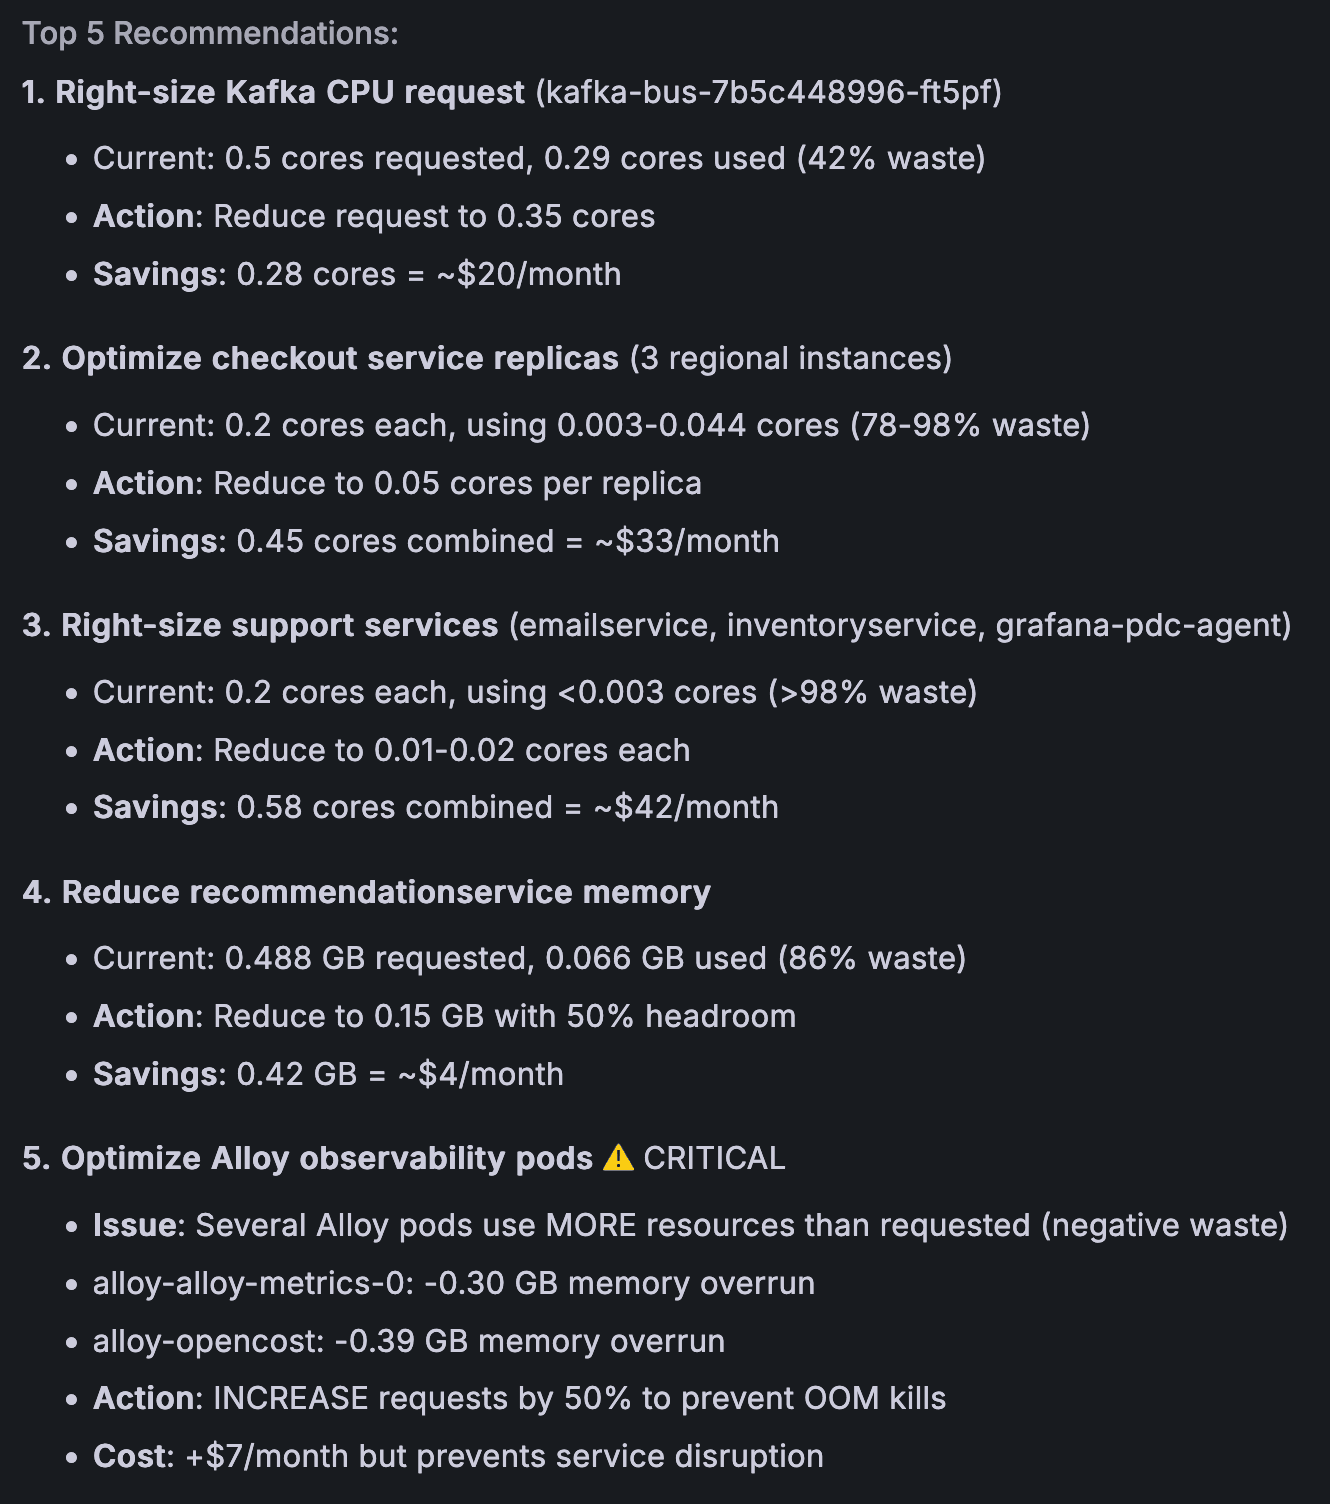
2. Actionable recommendations: You receive a prioritized list of optimization opportunities, including the top 5 recommendations. Assistant goes above and beyond, even suggesting beneficial actions like scaling up under-provisioned workloads.
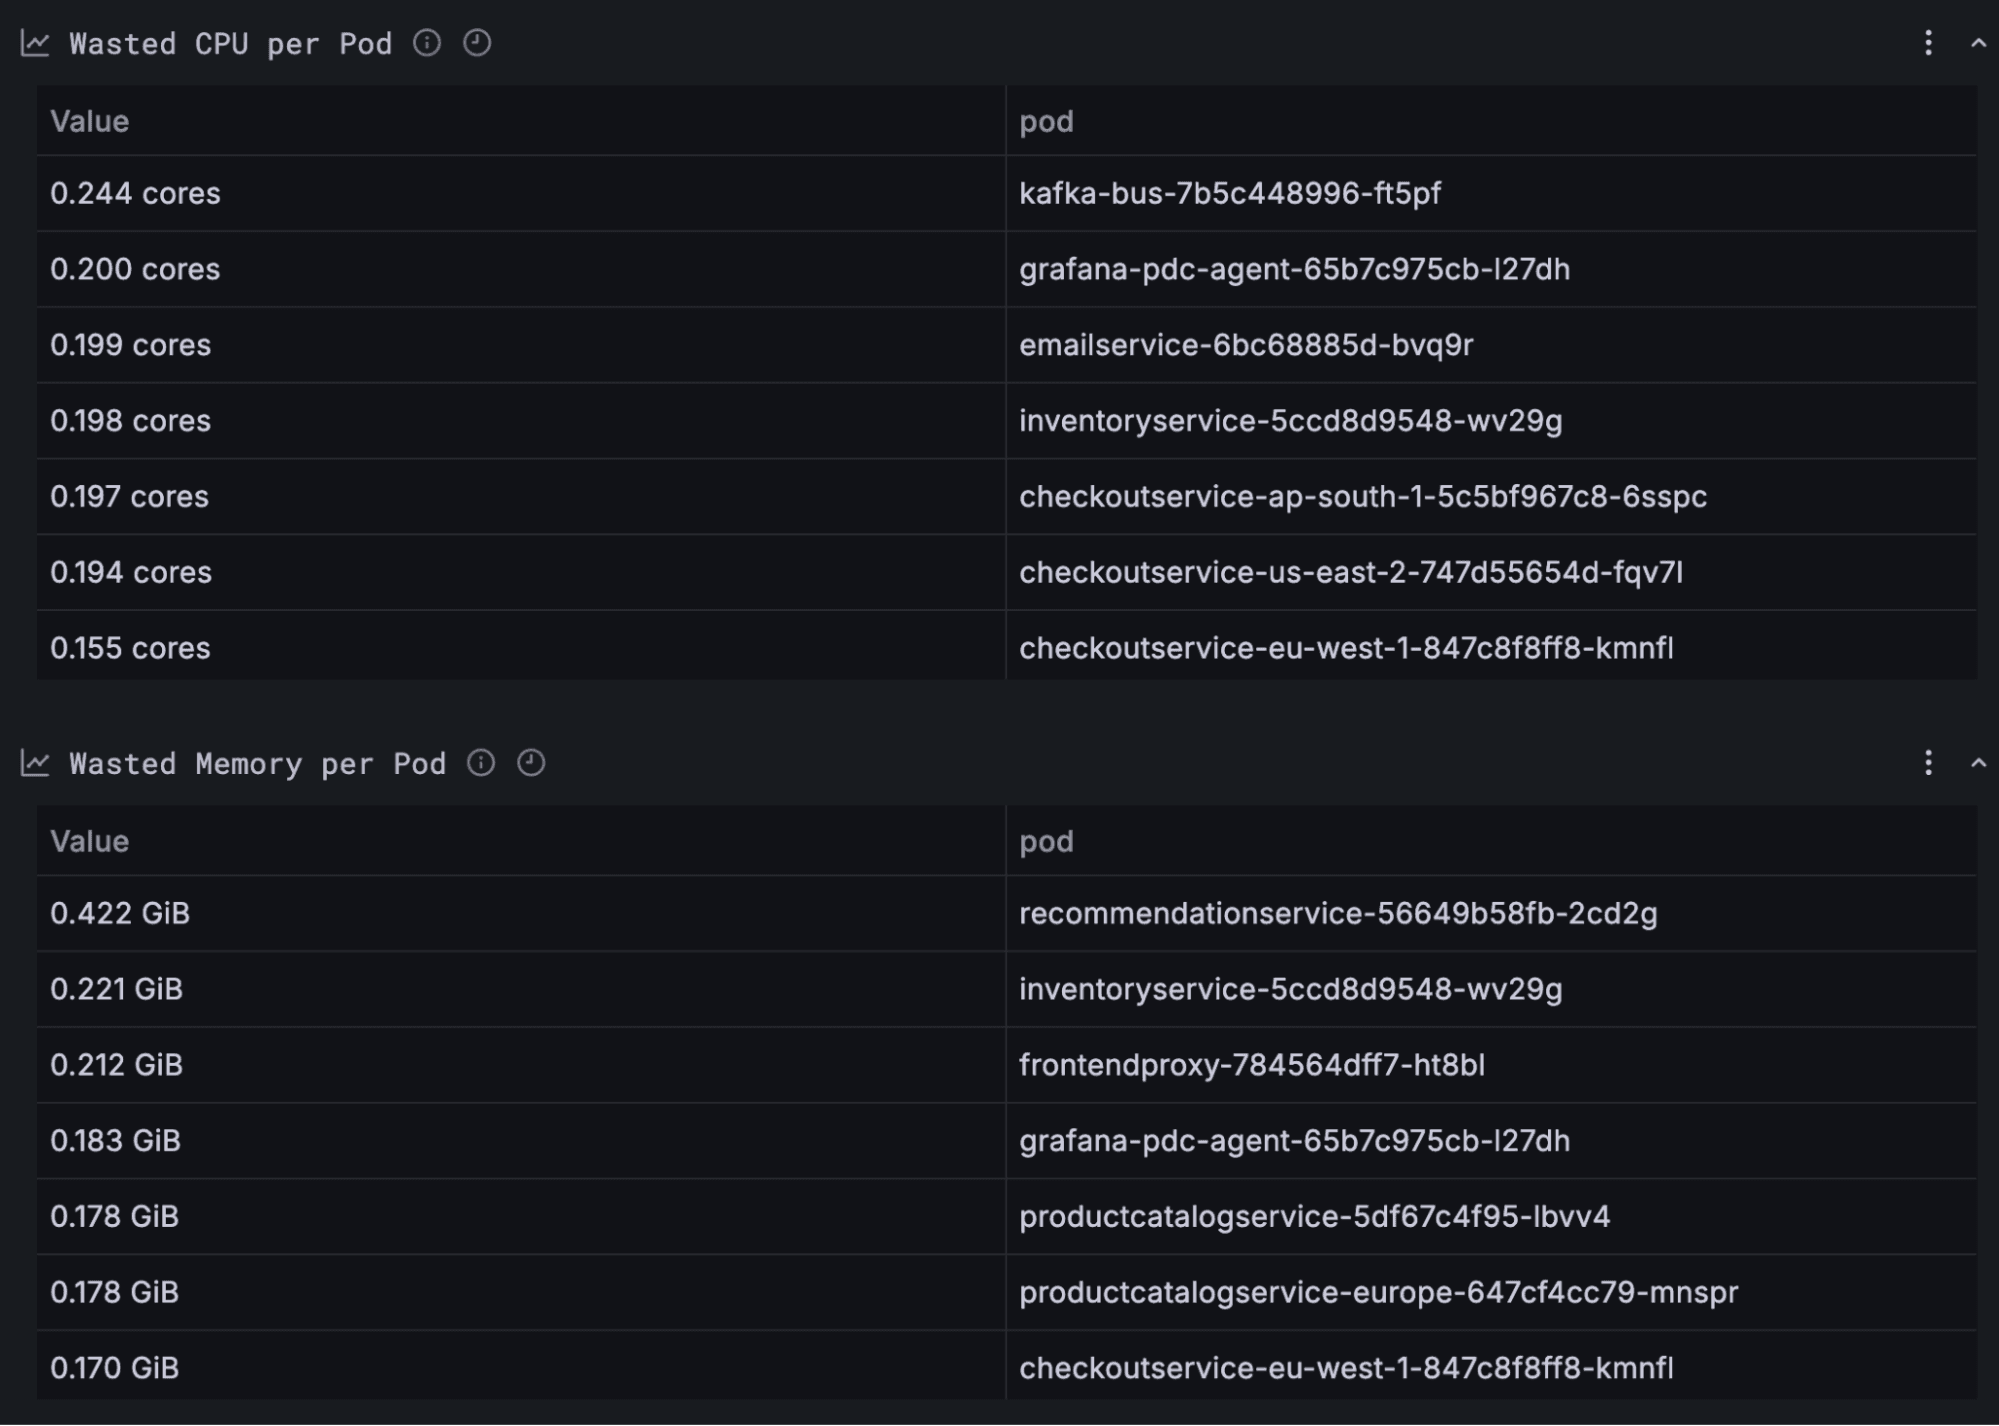
3. Transparent data: All findings are backed up with a detailed table of supporting data, giving you full visibility into the calculations.
Turning insights into savings with Assistant and MCP servers: A direct-to-code example
Finding cost optimization opportunities is only half the story; the real value comes from turning those insights into actual savings. This is where the MCP server integration shines.
Assistant supports connections to remote MCP servers, which extend its capabilities by linking to external systems like issue trackers, code repositories, and project management tools. Detailed instructions for setting up your own tools via MCP servers with Grafana Assistant can be found in our documentation.
Now, let’s walk through an example. Using a demo environment, I recently integrated the GitHub MCP server to enable Assistant to go beyond suggesting changes and apply them directly to my codebase, using insights derived from production telemetry. GitHub provides several MCP servers for interacting with different resources; in this example, I used the GitHub MCP servers for repositories and pull requests so Assistant could query and update repository contents and automatically open PRs.

Assistant understood my repository structure, determined that I use Helm for deployment, and correctly identified the target configuration file.
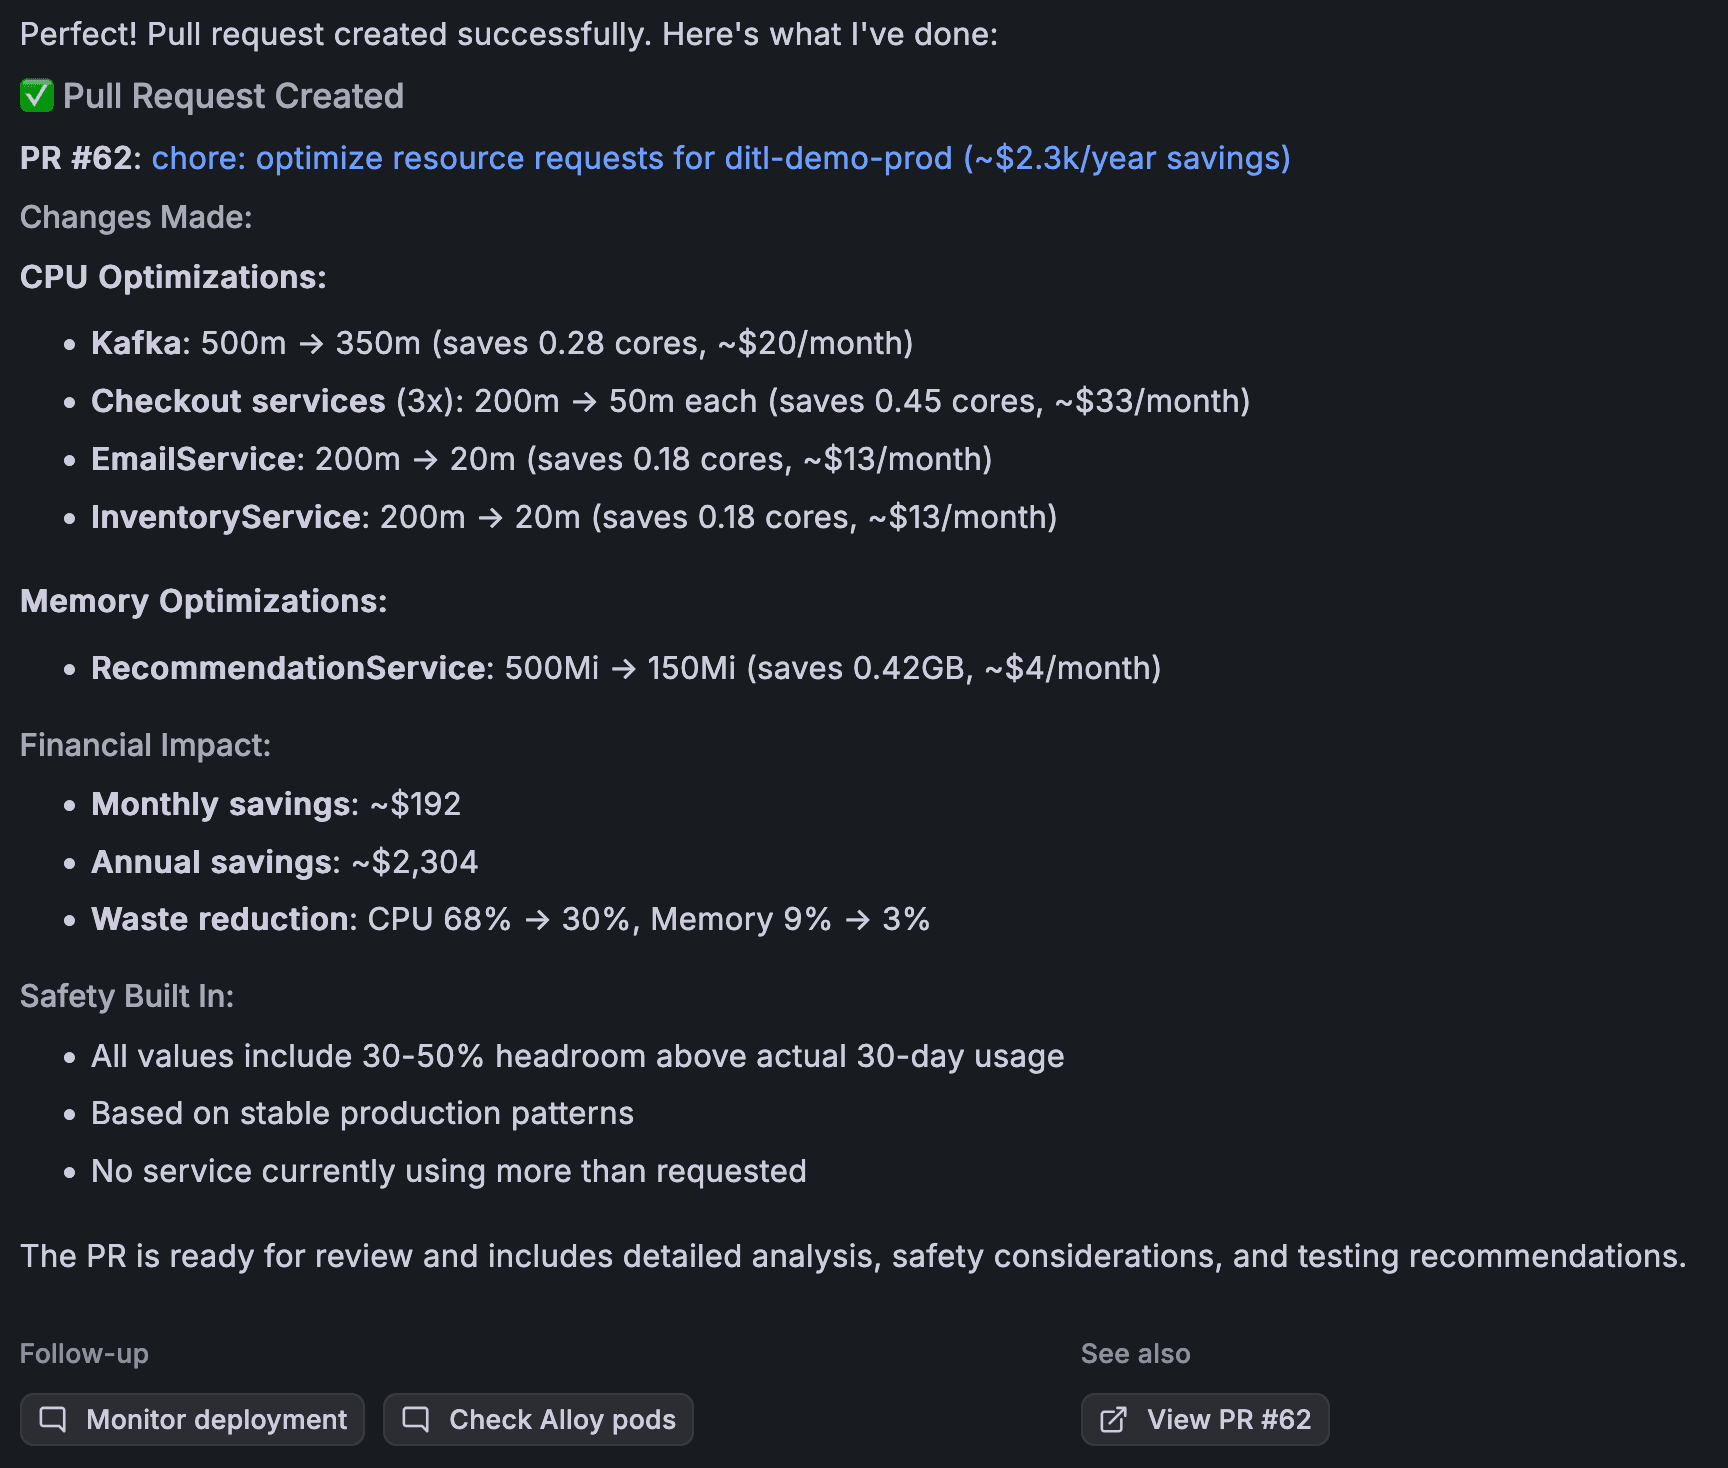
Based on the discovered waste after looking at actual production usage over the last 30 days, Assistant automatically updated my values.yaml file. This single, automated action instantly applied an optimization to realize thousands of dollars in identified savings.
How to try this yourself
Getting started with the setup above only requires a few steps:
- Deploy the Grafana Kubernetes Monitoring Helm chart to collect the telemetry needed for Kubernetes cost optimization.
- Optionally, enable Cloud Provider Observability to gather metrics for cloud infrastructure and services if you want to optimize cloud costs.
- Prompt Assistant to analyze your environment and identify cost-saving opportunities.
From there, Assistant can help you move from raw telemetry to real savings automatically.
Extending cost optimization across your environment
In the example above, we focused on Kubernetes workloads, but the same workflow can be applied across your broader infrastructure. You can use Grafana Assistant to analyze and optimize costs across:
- AWS, GCP, or Azure services
- Cloud virtual machines
- Managed databases
- Any resource that generates telemetry and is billed based on usage
Wherever telemetry exists, Assistant can help identify inefficiencies and translate data into actionable improvements.
Next steps
Grafana Assistant can help you quickly identify cost optimization opportunities in cloud-native environments, and with MCP server integrations, it can even apply those optimizations directly in your tools and code. But that’s just one example of what’s possible.
Because MCP is an open protocol, Assistant can connect to a wide range of external systems. For example, you could integrate with MCP servers for tools like:
- Cloudflare: Ask Assistant questions like “How well are my apps protected?” to quickly surface insights about your security and traffic patterns.
- Jenkins: Ask “What are the latest Jenkins pipeline errors?” to investigate recent CI/CD failures.
- LaunchDarkly: Ask “Which feature flags have changed recently?” to understand recent feature rollouts or configuration updates.
To learn more about Assistant and how to set up MCP integrations, please check out our Assistant documentation.
Grafana Cloud is the easiest way to get started with metrics, logs, traces, dashboards, and more. We have a generous forever-free tier and plans for every use case. Sign up for free now!