

Finding performance bottlenecks with Pyroscope and Alloy: An example using TON blockchain
Performance optimization often feels like searching for a needle in a haystack. You know your code is slow, but where exactly is the bottleneck?
This is where continuous profiling comes in.
In this blog post, we’ll explore how continuous profiling with Alloy and Pyroscope can transform the way you approach performance optimization. Using real-world examples from last year’s TON blockchain optimization contest, a C++ developer challenge, we’ll explore how modern profiling tools accelerate the optimization process.
First, some background on the contest
The Open Network (TON) blockchain optimization contest is a C++ optimization challenge where contestants have to squeeze every microsecond out of a blockchain validation algorithm.
The challenge was straightforward: participants were given the reference implementation based on the original block validation algorithm in TON. Their task was to optimize the implementation, which had to be consistent with the reference algorithm. Scores were based on execution time.
While we did not directly participate in the contest, a handful of Pyroscope engineers ran several contestant submissions locally and profiled them. This allowed us to observe where the optimized implementations spent their time and how specific changes affected performance.
We used Alloy, an open source OpenTelemetry collector with built-in Prometheus pipelines and support for metrics, logs, traces, and profiles. Specifically, we leveraged Alloy’s pyroscope.ebpf component, an eBPF-based CPU profiler, to capture detailed profiling data and send it to Grafana Cloud for analysis. This approach allowed us to identify hotspots and track optimization progress.
With Alloy’s eBPF-based profiling, we were able to gain immediate visibility into performance bottlenecks without modifying a single line of contestant code.
Alloy setup
Setting up eBPF-based profiling with Alloy requires minimal configuration:
pyroscope.write "staging" {
  endpoint {
    url = "<URL>"

    basic_auth {
      username = "<User>"
      password = "<Password>"
    }
  }
}

pyroscope.ebpf "default" {
  targets_only = false
  forward_to   = [pyroscope.write.staging.receiver]
  demangle     = "full"
}
Replace <URL> with your Pyroscope server URL, and <User> and <Password> with your Grafana Cloud credentials if sending data to the cloud. For local setups, you can skip the authentication and point to a local Pyroscope instance.
The profiler runs with root privileges and starts immediately:
sudo ./alloy run ./ebpf.alloy.txtOnce running, it profiles the entire system and sends data to your configured endpoint.
For the contest, we compiled with clang using RelWithDebInfo to preserve symbols for proper flame graph visualization:
CC=clang CXX=clang++ cmake ../ton  -DCMAKE_BUILD_TYPE=RelWithDebInfo
make contest-grader -j
./contest/grader/contest-grader --threads 8 --tests ../../tests
Crypto library optimizations
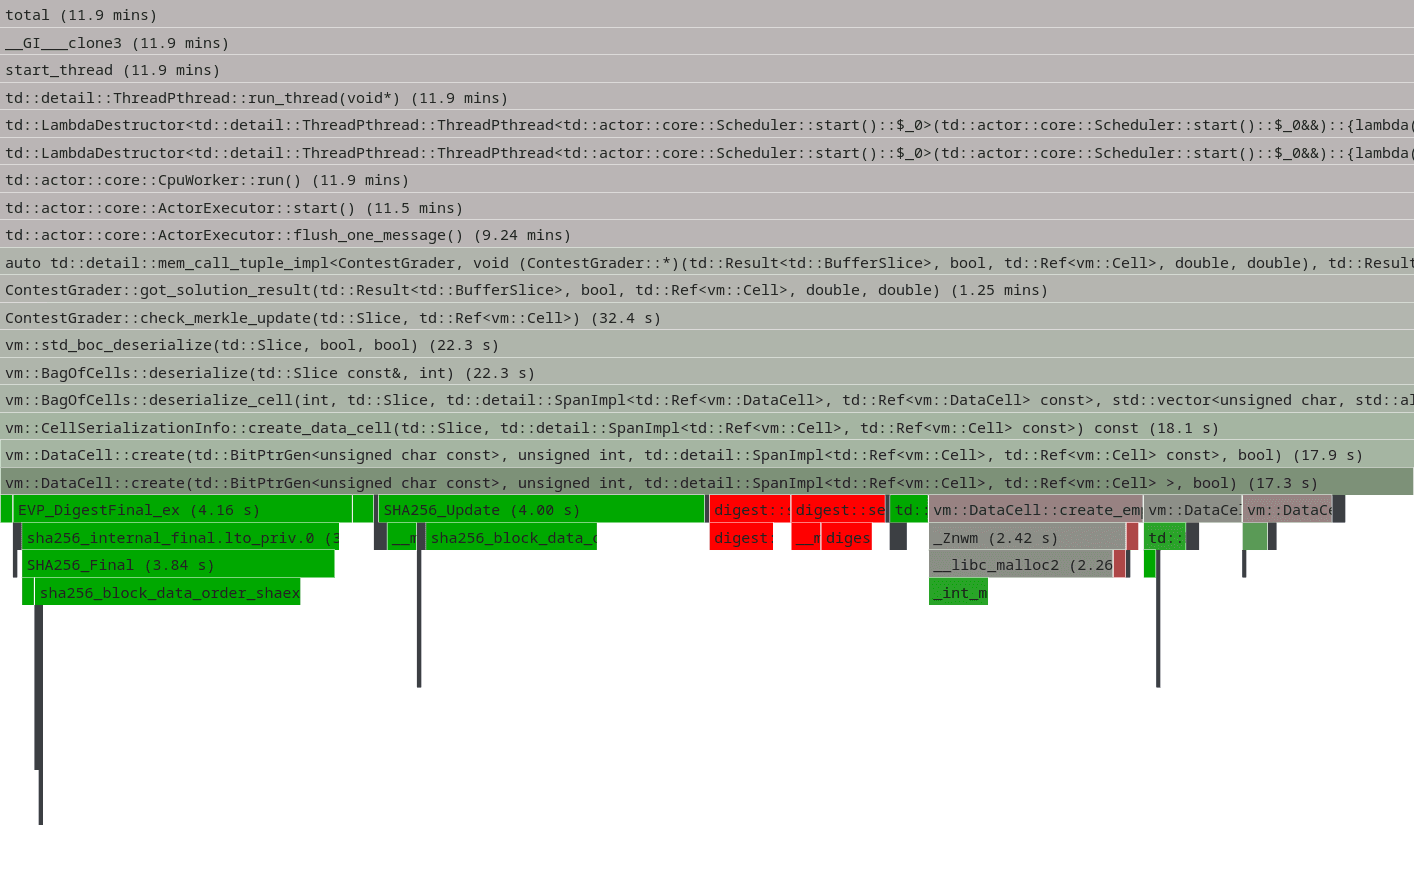
Looking at the reference implementation flame graph, we can see that vm::DataCell::create (DataCell deserialization) consumes about 14% of the total execution time. This function is responsible for creating and validating cells, which are TON's fundamental data structure. Each cell can store up to 1023 bits of data and references to other cells, forming a directed acyclic graph.
The SHA256 computation happens because every cell in TON has a cryptographic hash that serves as its unique identifier. During deserialization, the system must compute SHA256 hashes to verify data integrity, prevent circular references, and enable efficient deduplication. This hash computation involves serializing the cell's data, descriptor bytes, reference depths, and reference hashes into a single byte string that gets hashed with SHA256.
Another crypto operation hotspot is vm::exec_ed25519_check_signature, which implements the TVM bytecode operation for Ed25519 signature verification. This operation is frequently called during smart contract execution and transaction validation.
These cryptographic operations represent natural optimization targets, as they consume significant CPU time during blockchain validation.
SHA256 alternative implementation
Sometimes the most effective optimizations are the simplest ones. One contestant took the low-hanging fruit approach and replaced the default OpenSSL SHA256 implementation with an alternative from SerenityOS. This submission (entry6294) swapped out the library routine with one from SerenityOS's crypto library.
The flame graph diff shows the impact: a ~2% total speedup. While this might seem modest, every percentage point matters in competitive optimization. It's unclear why the SerenityOS implementation was faster, but the execution time and flame graph diff data confirmed the improvement.
SHA256 single feed
Beyond replacing the SHA256 implementation, contestants also optimized how the algorithm is used. One particularly effective optimization consolidated multiple SHA256 feed operations into a single call within CellChecker::compute_hash. This pull request demonstrates how algorithmic improvements can be more impactful than library replacements.
The change sped up DataCell::create by 20% and improved overall verification performance by 3.5%. By reducing the overhead of multiple hash update calls and leveraging more efficient batched processing, this optimization showed that understanding the usage patterns of cryptographic functions can lead to gains.

ED25519
Another straightforward optimization targeted the Ed25519 signature verification in vm::exec_ed25519_check_signature. Like the SHA256 case, this involved replacing the default OpenSSL implementation with an alternative that uses handwritten assembly for x86_64.
While this approach sacrifices portability for performance, the results justified the trade-off in a contest environment. The assembly-optimized implementation delivered a ~1.5% speedup, demonstrating how platform-specific optimizations can provide measurable gains even for well-established cryptographic operations.

Ordered collections replacements
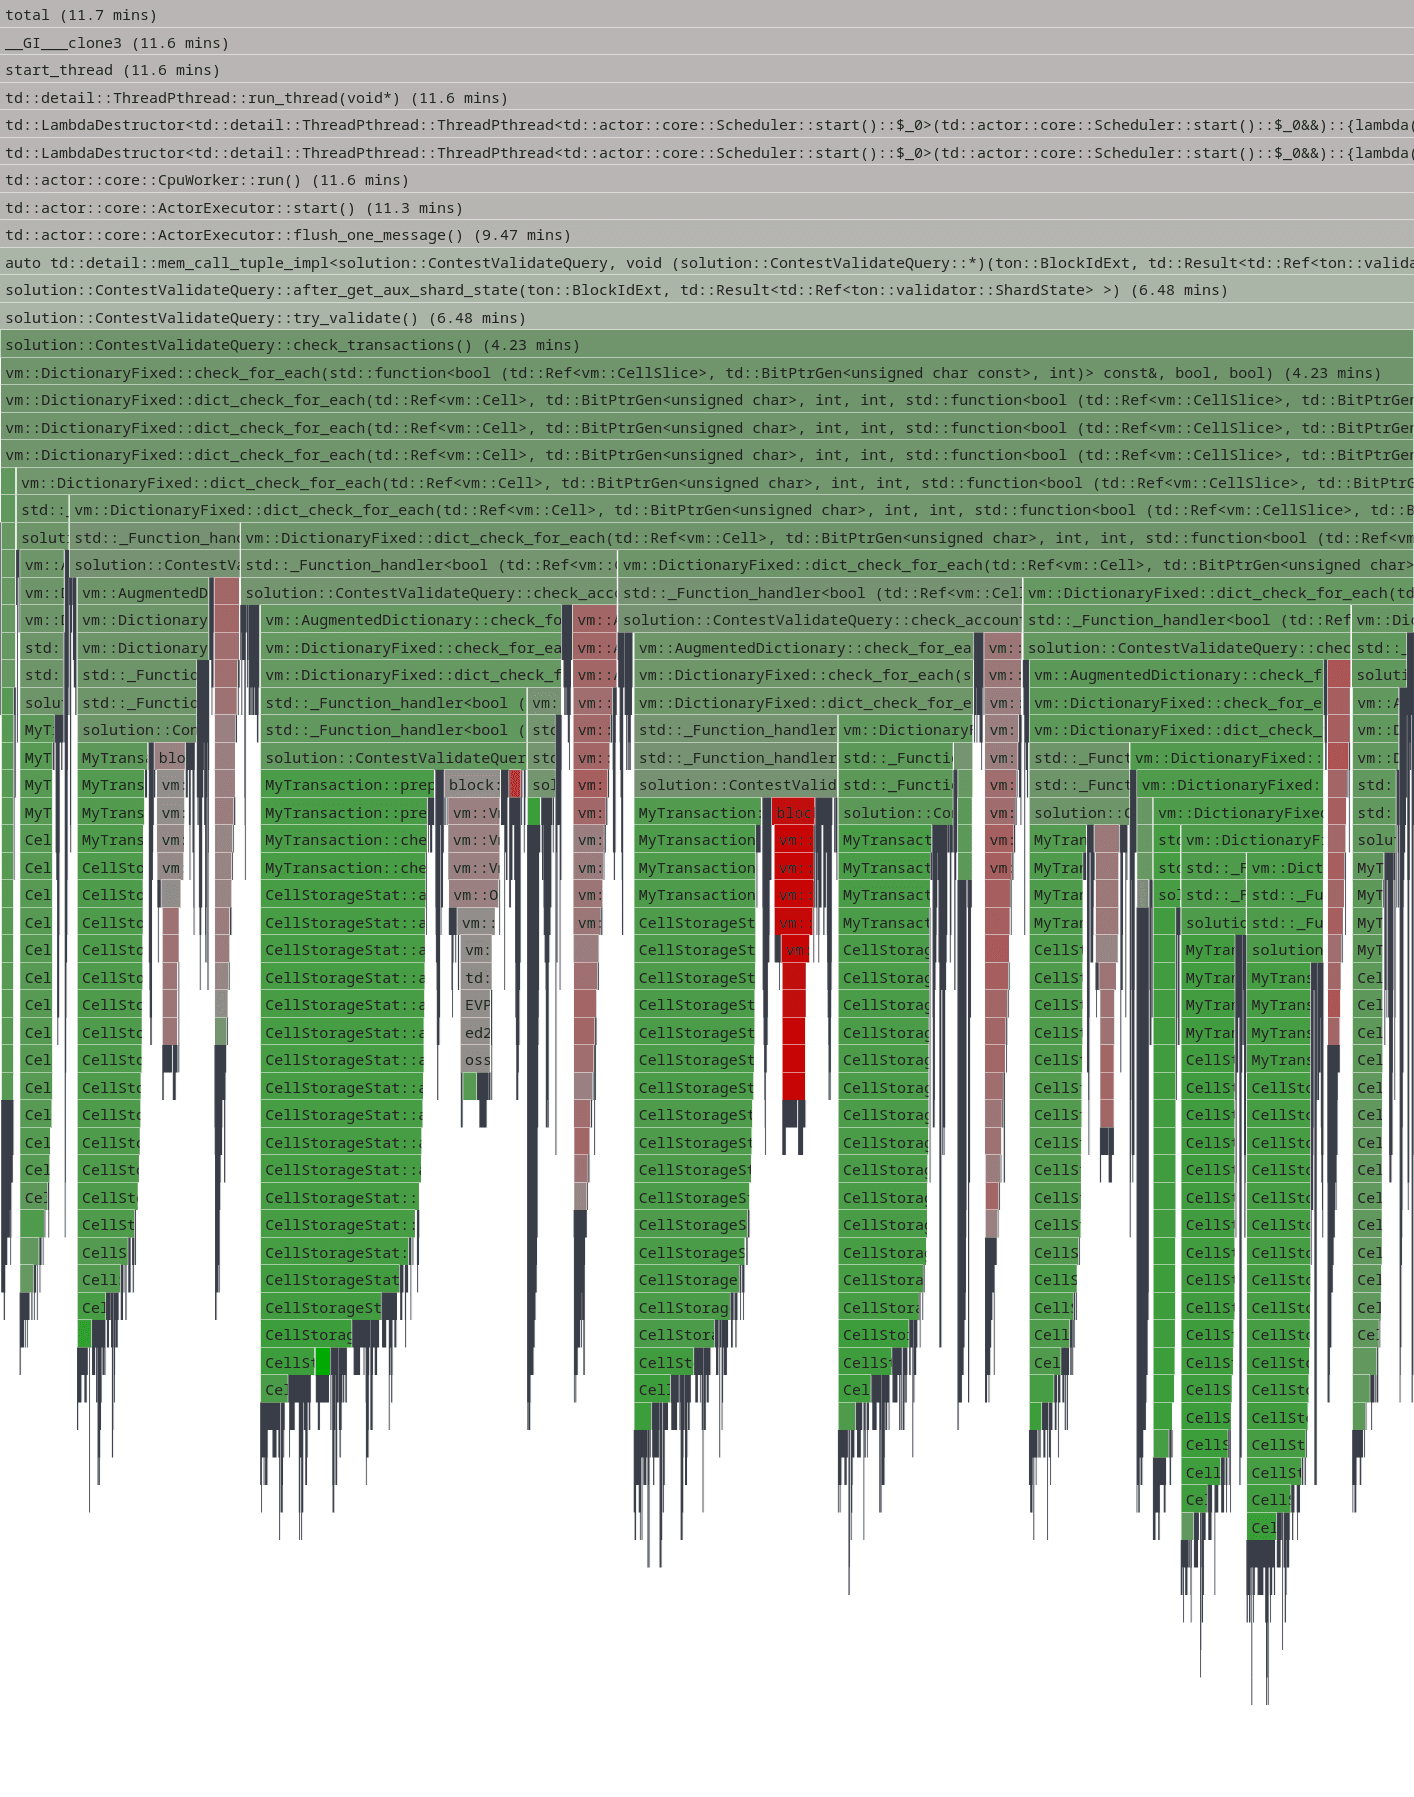
Another low-hanging fruit optimization involved replacing std::map with std::unordered_set in CellStorageStat::add_used_storage(). The original implementation used a map to track visited cells:
- std::map<vm::Cell::Hash, CellInfo> seen;
+ std::unordered_set<vm::Cell::Hash> seen;
This seemingly trivial change provided a ~10% speedup. The performance improvement came from the difference between these data structures: std::map maintains elements in sorted order using a balanced binary tree (typically red-black tree), providing O(log n) lookup time. In contrast, std::unordered_set used a hash table with O(1) average lookup time.
Since the collection is only used for memoization to avoid reprocessing the same cells, ordering is unnecessary. The hash-based lookup eliminated the overhead of tree traversal and comparison operations, making cell deduplication significantly faster.
Custom profilers
Interestingly, contestant submissions and the TON codebase itself included custom-built profiling solutions. This demonstrates the lack of ready-to-use, gold-standard profilers in the C++ ecosystem, forcing developers to implement their own instrumentation when they need deeper insights.
Tracing profiler
One contestant implemented a manual instrumentation tracing profiler with RAII-style timing blocks. The system used a PROFILER(name) macro that created static IDs for O(1) record lookup and automatically measured execution time using RAII destructors. While lightweight and precise, it required manual code instrumentation at every point of interest.
The profiler aggregated timing data by call site and provided sorted output showing the most expensive operations first. This approach offered fine-grained control over what gets measured but came with the overhead of manual instrumentation and potential code clutter.
Memory profiler
The TON monorepo includes a sophisticated memory allocation profiler (memprof) that intercepts all malloc/free calls and C++ new/delete operators. It captures full stack traces for each allocation, aggregates them by call site, and maintains a hash table of unique allocation patterns.
The profiler uses fast assembly-based stack walking on x86_64 with fallback to standard backtrace functions. It can track memory usage patterns, identify leaks, and provide detailed allocation statistics, which are essential for optimizing memory-intensive blockchain validation.
These custom profiling implementations highlighted a common challenge in C++ optimization work: the absence of standardized, production-ready profiling tools forces developers to reinvent the wheel. eBPF-based profiling with tools like Alloy offers an attractive alternative, providing comprehensive system-wide profiling without requiring custom instrumentation or code modifications.
Wrapping up
You can learn more about each implementation in the contest here; winners are also listed anonymously on that page.
Looking back on the contest, the flame graph visualizations in Pyroscope made it easy to spot hotspots like DataCell::create consuming 14% of execution time, while flame graph diffs clearly showed the impact of each optimization attempt.
What's particularly striking is how contestants achieved significant speedups through relatively simple changes: swapping crypto libraries, replacing ordered collections with hash tables, and optimizing algorithmic patterns. These optimizations, ranging from 1.5% to 20% improvements per change, demonstrate that performance gains often come from understanding your data structures and choosing the right tool for the job.
The big take-away for me was that modern profiling tools like Pyroscope and Alloy are making performance optimization more accessible and data-driven. Whether you're optimizing blockchain validators or any other performance-critical application, continuous profiling should be in your optimization toolkit from day one.
Grafana Cloud is the easiest way to get started with metrics, logs, traces, dashboards, and more. We have a generous forever-free tier and plans for every use case. Sign up for free now!

