


Find the log line that matters faster with full-text search in Grafana Cloud Logs


A support ticket comes in with one clue: a transaction ID. The answer is somewhere in your logs, but you don't know which service logged it, which pod handled it, or which day it happened. So you write the query you always write, {service="payments"} |= "txn-123456", widen the time range to the last two weeks, and wait. Then the query times out.
Loki was originally built around a simple idea: index labels, not log content, and store compressed logs cheaply in object storage. That design keeps storage costs low and operations light, and it's why teams keep choosing Loki and Grafana Cloud Logs, the fully managed log aggregation system powered by Loki, as their log volumes grow. For most queries, this model works very well. But when you search for a highly unique value, like a request ID, job ID, user ID, or device ID, labels can only narrow the search so far. Loki still has to read a lot of raw log data to find a handful of matching lines. At terabyte and petabyte scale, that process can be slow and costly.
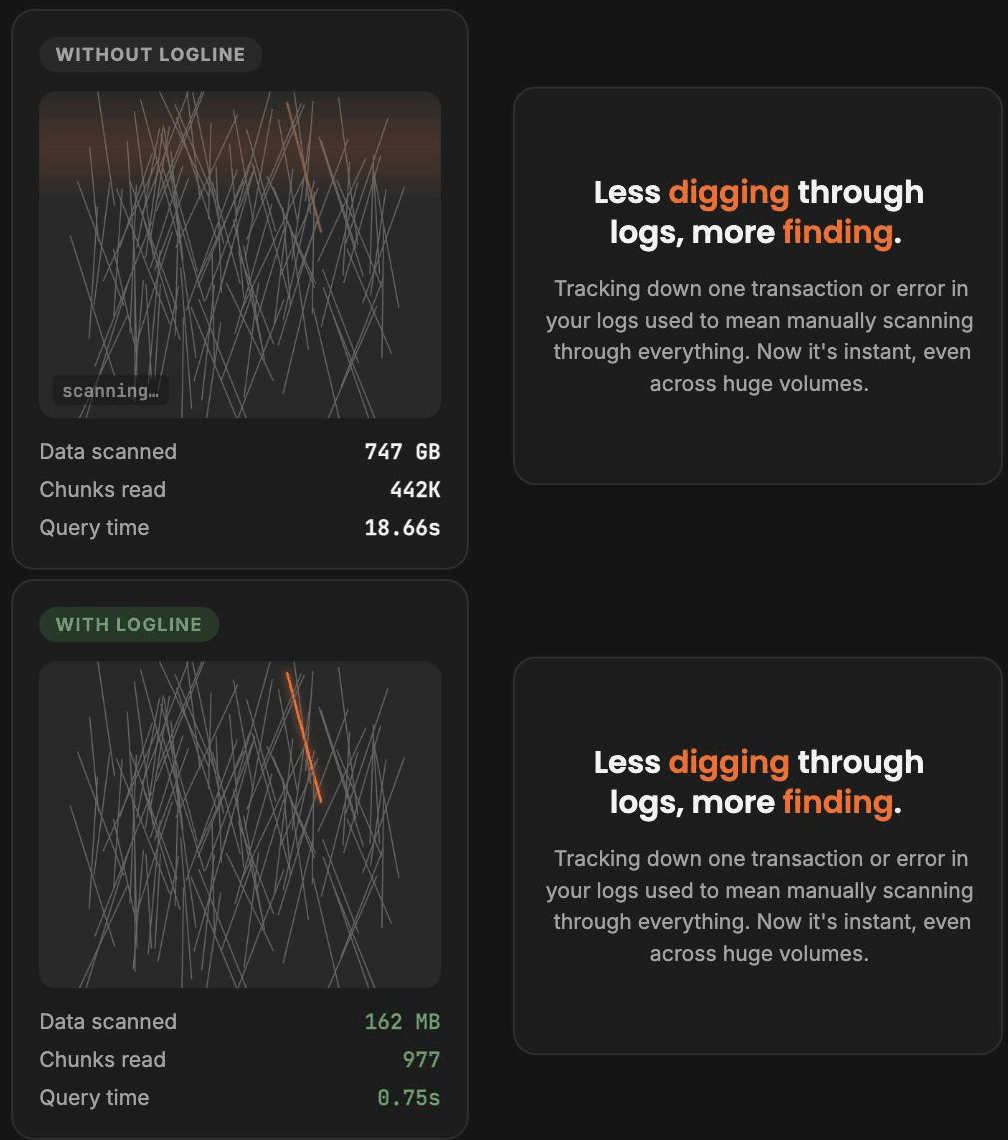
To fix that, we built full-text search for Grafana Cloud Logs, a capability based on the Logline technology Grafana Labs acquired in April 2026. Full-text search, now generally available in Grafana Cloud Logs, adds a purpose-built secondary index to Loki, so you can find specific log lines across weeks of logs in seconds without a full scan. You go straight to the one transaction ID, user ID, or error that matters and cut time to resolution.
“When I ran our first query on newly submitted logs after enabling Logline, the improvement was clear,” said Timo Kirzdörfer, OpenTelemetry & Grafana Cloud Admin, DATEV eG. “We went from processing nearly a terabyte of logs in three minutes to around 100 gigabytes in under three seconds. That represents an 80-90% reduction in the volume of logs searched for newly submitted logs, and we saw the results immediately.”
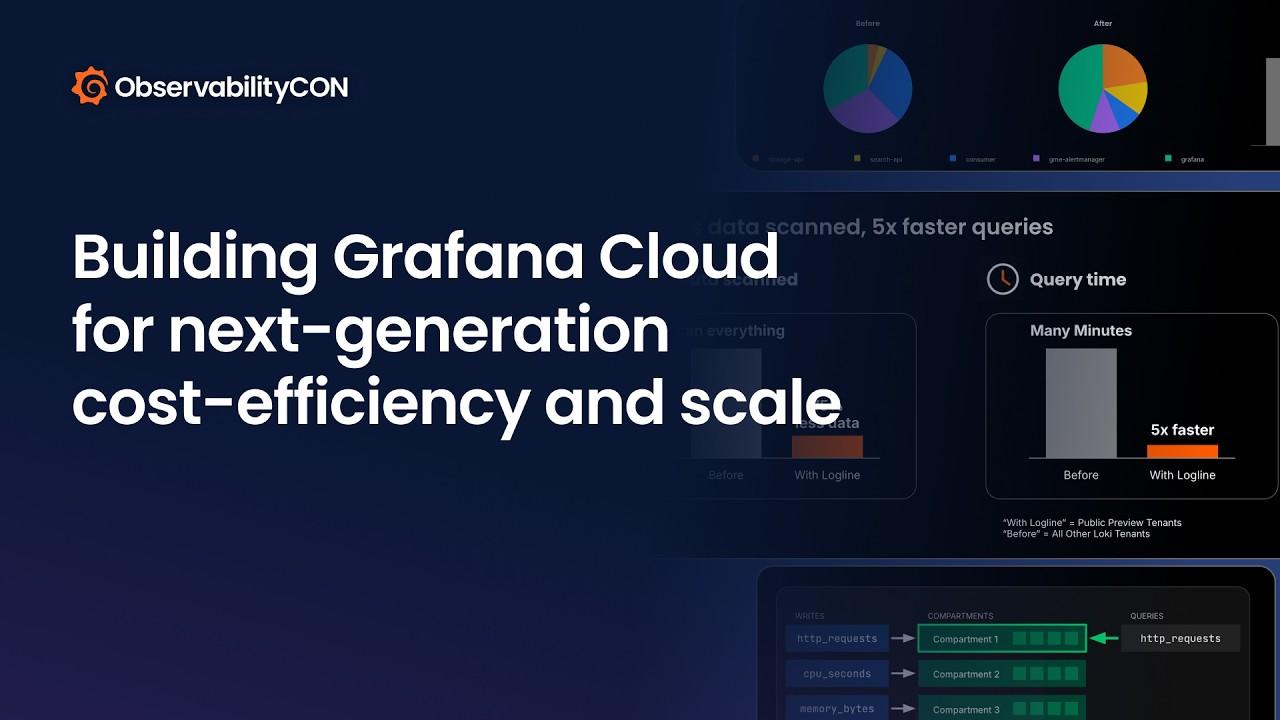
In this post, we’ll explore how full-text search speeds up log investigations. You can also learn more in the ObservabilityCON 2026 talk below.
Why labels alone only get you so far
Historically, Loki only indexed labels, then scanned every line in the selected streams. That is fast when the selector and the time range are already narrow. Searching a wide selector over a long window for one request ID means reading all of those lines. If you've run Loki at scale, you've probably reached for one of these techniques to avoid that scan:
- Put the whole or partial ID in a label. This is an obvious fix, but it creates high cardinality. Request IDs and user IDs make so many unique streams that ingestion and query performance suffer and eventually hit configured limits. Loki's cardinality guidance warns against this for good reason.
- Shrink the time range and guess. This works if you already know roughly when something happened. During an incident, or with a ticket that came in days later, you usually don't.
- Send some logs to a separate full-text index. That means running a second system, paying to index every field, and making engineers switch tools mid-investigation.
Full-text search removes that tradeoff. The secondary index tells Loki which data can contain a literal string, so Loki reads only that data and skips the rest. That makes a big difference in how much data a query scans and how fast it returns.

And it does this without the overhead of a traditional inverted index. The Logline technology behind it adds approximately 10% to compute costs and 10% to storage at Grafana Cloud scale with the current capabilities. Much of that cost is offset by the query compute Loki saves by reading less data.
Loki also stays schemaless. You keep your labels and your ingestion pipelines, whether that's Alloy, the OpenTelemetry Collector, or another supported client, and you keep writing LogQL. For supported queries, searches that used to time out can now return in seconds or less.
Find answers faster with full-text search
Full-text search accelerates several LogQL patterns used for needle-in-a-haystack lookups:
- Exact string matches, using
|=. - Literal regex searches, using
|~, including case-sensitive searches and case-insensitive searches with(?i). - Label filter expressions over structured metadata and label attributes, such as
| transaction_id="12345". - Post-parser literal expressions over extracted attributes, such as
| json | transaction_id="12345".
Some advanced regex constructions are not supported; see the full-text search documentation for details.
These patterns above support investigations ranging from following a transaction ID to tracking down an intermittent error. Here’s how faster lookups help engineers and AI agents follow those leads.
Trace one ID across weeks of logs
Most needle-in-a-haystack searches start from a single identifier: a customer ID from a support ticket, a failing transaction from a payment alert, or a trace ID copied from a slow span.
With full-text search, the line filter you already use is the fast path:
{service="payments"} |= "txn-123456"
Loki no longer has to read every chunk in the stream selector across the whole time range. The index sends it to the data that can contain txn-123456. You can search a wider time range with a broader stream selector and still get results fast enough to stay focused.
Anyone on the on-call rotation can paste an ID, set a long time range, and get an answer. You no longer need a Loki expert to make that query efficient.
Hunt down rare and intermittent errors
Some of the hardest incidents to investigate never show up on a dashboard. An error shows up a few times a day on a few hosts, and the only evidence is a specific string buried in the logs.
Full-text search speeds up literal and case-insensitive searches, so you can look across services for rare errors without knowing in advance where they'll appear:
{service="api"} |~ "(?i)webhook signature mismatch"
You can also combine literals to narrow results while staying on the fast path:
{service="api"} |= "txn-123456" |~ "(?i)webhook signature mismatch"
You find the first occurrence of an intermittent failure faster, which makes it easier to tie that failure to a deploy, a dependency, or a specific customer.
Speed up AI-driven investigations
Fast lookups matter even more as AI agents take on more of the investigation work. AI-driven investigations often run many queries in a row: an agent checks a hypothesis, searches for an ID, follows it into another service, and searches again.
Faster needle-in-a-haystack queries mean each of those steps returns sooner, so the investigation keeps moving.
Get started
If you use Grafana Cloud Logs, full-text search is available now at no additional cost. You don't need to change ingestion, redesign labels, or learn a new query language.
Try full-text search in your stack, or create a free Grafana Cloud account to get started today.
To run your first search:
- Open Explore in your Grafana Cloud stack and choose your Grafana Cloud Logs data source.
- Pick a stream selector and add a line filter for a value you'd normally search for, such as a request ID, customer ID, or error string.
- Set a longer time range than you'd usually risk, such as the last few days or weeks, and run the query.
For supported query patterns and best practices, see the full-text search documentation.
Faster search is one way we’re helping teams get more value from their logs. At ObservabilityCON 2026, we also announced Adaptive Logs updates to give you more control over storage costs. To learn more, check out this on-demand talk from the event.
Miss out on ObservabilityCON 2026? Check out our blog post recapping all the big announcements!


