

%3Aquality(90)%2F&w=3840&q=75)
%3Aquality(90)%2F&w=3840&q=75)
Digital Experience Monitoring with Grafana Cloud: Session Replay, synthetic checks, and faster investigations


When something breaks in production, the questions that matter most are also the toughest to answer from metrics alone: who was affected, what did they actually see, and is this worth waking someone up for? Answering those questions requires a fuller picture of the issue and its impact on your users.
That’s where Digital Experience Monitoring (DEM) in Grafana Cloud comes in. By combining Frontend Observability and Synthetic Monitoring, DEM connects real user experiences with proactive testing, helping engineering teams understand the scope of an issue, investigate its cause, and resolve it faster, all within Grafana Cloud.
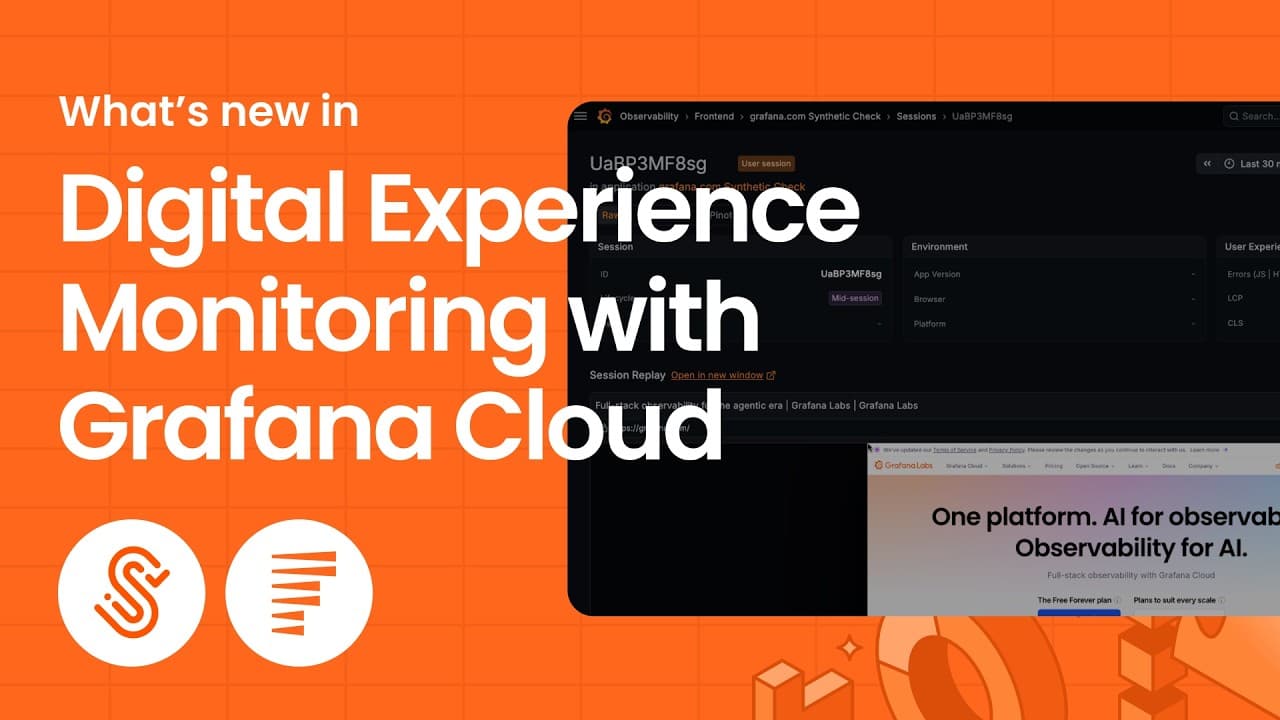
In this blog post, we'll walk through some of the latest DEM updates in Grafana Cloud, and how to get started. You can also learn more by watching the video below.
%3Aquality(90)%2F&w=3840&q=75)
DEM helps your team achieve:
- Real user visibility: know how users truly experience your web application, not just what your backend metrics suggest.
- Proactive detection: catch problems before your users do, using automated checks against your critical user journeys.
- End-to-end correlation: connect a frontend signal to the backend trace behind it.
- Faster resolution: cut your mean time to recovery from hours to minutes.
Session Replay: see exactly what your users saw
%3Aquality(90)%2F&w=3840&q=75)
Session Replay in Grafana Cloud Frontend Observability lets you visually replay what a user saw and did inside your web application. Your team can watch exactly what users experienced and correlate it with real user monitoring signals like Core Web Vitals, user actions, and traces, which makes it a powerful tool for investigating bugs and running root cause analysis.
Session Replay is powered by Faro, Grafana's open source JavaScript instrumentation library for collecting real user monitoring data. Let's walk through how to set it up.
Step 1: Add the Replay instrumentation to Faro
We start by adding the Faro web SDK to our web application. When we initialize Faro, we add the Replay instrumentation alongside the standard Faro web instrumentations:
import { getWebInstrumentations, initializeFaro } from '@grafana/faro-web-sdk';
import { ReplayInstrumentation } from '@grafana/faro-instrumentation-replay';

initializeFaro({
  url: 'https://your-faro-endpoint.com',
  instrumentations: [
    // Standard Faro instrumentations: errors, web vitals, user actions, and more
    ...getWebInstrumentations(),
    // Enables session recording
    new ReplayInstrumentation(),
  ],
});
During initialization, the default configuration is “privacy first,” but you can further tweak the masking, privacy, and sampling options that fit your needs. For example, you can mask specific input types or record replays for only a percentage of sessions.
Step 2: Generate some session data
Once the web application is instrumented, we can see it in action. For this example, we'll use QuickPizza, our demo web app that lets you create pizza combinations. On the website, we'll click a few buttons and experiment with the app, the same way a real user would. All of that activity is recorded and sent to Frontend Observability.
Step 3: Find your session recordings
%3Aquality(90)%2F&w=3840&q=75)
%3Aquality(90)%2F&w=3840&q=75)
Our sessions are populated and we can select one to replay. Private information is masked client-side, which means it is never sent to Grafana Cloud, but you can still clearly follow mouse movements and DOM actions. To view session recordings, you have two options: you can open a session directly from the session details page, or click the green button to open the player in a new tab. We recommend the second option, as it lets you watch the recording side-by-side with the full user journey that always stays synchronized with the player's state.
The replay player gives you full control over playback:
- Playback controls: play, pause, and skip ten seconds forward or backward
- Adjustable speed: from 0.25x all the way up to 16x, which makes it easy to scan longer sessions
- Skip inactivity: jump past the quiet parts of the recording, so you stay focused on what matters
- Share button: copies a link to a specific moment in the replay, so you can send a teammate the exact second an issue happens
On the side, you can see the user journey with timestamps, showing what both the user and the browser were experiencing. You can also see errors from this view, skip straight to them, and filter and sort by errors.
This is where Session Replay gets really powerful. Because replays are correlated with your existing Faro telemetry, you can jump from a frontend error in your dashboard directly into the replay for that session, watch exactly what the user was doing when the error occurred, and then dig even further into the correlated traces.
To learn more about Session Replay in Frontend Observability, please check out this blog post and our technical docs.
Synthetic Monitoring and Frontend Observability: better together
Grafana Cloud Synthetic Monitoring runs automated checks against your critical user journeys, so you catch issues before your real users ever see them, while Grafana Cloud Frontend Observability captures what your real users are actually experiencing, turning your frontend performance into something you can measure and act on. Together, they form the foundation of Digital Experience Monitoring in Grafana Cloud, giving you both a proactive and real-world view of your users’ digital experience.
We recently made it easier to move between Synthetic Monitoring and Frontend Observability when investigating an issue, enabling end-to-end correlation from a synthetic check through the frontend experience and into the traces behind it.
Every time a Synthetic Monitoring browser check runs, it passively creates a matching Frontend Observability session, and that session is a fully controlled, repeatable run of a real user journey. From inside a check, you can now pull up Frontend Observability data right there as context and jump straight into the exact session that run created. Once you're in that session, you have access to the session replay, the user journey, and traces.
%3Aquality(90)%2F&w=3840&q=75)
Your synthetic browser checks are no longer just a pass or a fail. You get feedback from every run, so when a check fails, you can see exactly what happened. That means you can finally answer the question every on-call engineer asks: is this failing check a real user problem, and how many users were impacted?
Walking through a failing check
Let's jump into Synthetic Monitoring to see the integration in action. We've already set up a browser check that mimics a typical QuickPizza user flow, and we just got an alert that this check is failing.
- Open the check dashboard. Right away, we can see the failing check.
- Find the failed execution. Down in the timepoint explorer, we can see each individual execution, including the failed ones. We'll select one.
- View the frontend session. When we scroll down, we see a button that says View Frontend Session. With one click, it opens the Frontend Observability session for this exact run.
%3Aquality(90)%2F&w=3840&q=75)
This view has everything we need to investigate: the session replay, which is a step-by-step visual replay of every action the check performed; the user experience metrics from the run; the full user journey; and the traces behind it. In just a few clicks, we went from an alert, to a failed execution, to watching exactly what happened during the check.
Learn more
To learn more, visit our Digital Experience Monitoring solutions page, or explore each tool in greater depth by checking out our technical docs for Frontend Observability and Synthetic Monitoring.
Grafana Cloud is the easiest way to get started with Digital Experience Monitoring. We have a generous free tier that includes 100k test executions per month and more. Sign up for free now!


