

Business metrics in Grafana Cloud: Get an AI assist to help securely analyze your data
For today's modern businesses, the data landscape demands security and flexibility.
You need to connect your observability platform to rich, proprietary datasets that often reside in private networks without compromising security or managing complex network infrastructure. You may also face an extra layer of complexity in order to effectively query and visualize that data. Luckily, modern artificial intelligence tools have made these previously complicated processes much simpler.
This is where Grafana Cloud's private data source connect (PDC) truly shines, offering a secure, elegant solution to bring relational data like business metrics and analytics directly into your dashboards. This secure connection also allows Grafana Assistant to access the data and leverage the power of AI to visualize and query your data.
In this blog post, we’ll demonstrate how you can access that private data securely in Grafana Cloud and how to use our AI assistant to translate complex database queries into human readable language and visualizations.
Making business analytics easy with PDC, Assistant, and Postgres
Observability was born from the need to give engineers deeper visibility into their workloads, but the scope of how it's used is quickly expanding. In fact, half of all organizations today use observability tools to track business-related metrics such as security, compliance, revenue, order tracking, customer conversions, and more, according to our 2026 Observability Survey.
So while Grafana Cloud was built by engineers for engineers, it's also powerful and flexible enough to meet a wide range of needs, including business analytics. In this section, we'll briefly describe the tools you'll need to get started and tell you a little bit about the data source we'll use to demo this functionality.
The power of PDC
PDC is a key feature for enterprise-grade observability. It establishes a secure, encrypted, private connection between your Grafana Cloud instance and data sources hosted within your private networks.
Here's how it works: A lightweight PDC agent is deployed in your private network. This agent creates a customer-controlled SSH tunnel back to Grafana Cloud, securely routing all queries. This critical design choice means:
- Security first: Your databases are never exposed to the public internet. Traffic is encrypted end-to-end.
- Simplicity: You avoid the complexity of managing VPNs, NAT gateways, or intricate network-level access controls.
- Scalability: The agent can be deployed for high availability and easily scaled to meet your query demands.
- Local experience: You configure the data source in Grafana as if it were running locally within your private network.
PostgreSQL: analytics beyond metrics
While tools like Prometheus are essential for scraping and querying time series metrics from infrastructure and applications, many critical business insights live in relational databases. PostgreSQL, with its robust support for complex queries, joins, and rich datasets, is the perfect complement to pure metrics-based observability.
Consider the example of the World Happiness Report, which is a research-based global report that ranks countries by how happy their people say they are, and explores the social and economic factors behind those differences. This dataset is full of relational context: countries, years, GDP per capita, life expectancy, and social support. Visualizing this data requires sophisticated queries that are not easily performed using traditional metrics-optimized sources.
By connecting PostgreSQL via PDC, you can:
- Query relational data like business metrics, customer survey results, or rich time series data
- Perform complex joins to enrich time-series metrics with contextual data
- Unlock deep analytics directly within your Grafana dashboards
Grafana Assistant: Query the data with natural language
Grafana Assistant is our LLM purpose-built for Grafana Cloud. It's an invaluable AI-powered feature that significantly accelerates the dashboard creation process, as it lets you leverage natural language prompts to generate complex queries and refine visualizations quickly.
In this demo, Grafana Assistant was used to rapidly construct and fine-tune the prebuilt dashboard, demonstrating how it can quickly turn raw PostgreSQL data into meaningful, happiness-focused visualizations.
AI-powered dashboard generation from PostgreSQL
When connecting to a rich data source like PostgreSQL via PDC, Assistant acts as an intelligent translator between your analytical goal and the necessary SQL.
Here's how Assistant works with the PostgreSQL data source:
- Natural Language query translation: Instead of manually writing complex SQL joins and aggregations, a user can simply prompt the assistant. For example: "Show me the trend of 'Life Ladder' score over time for the top 5 happiest countries in 2024."
- SQL generation: The AI processes this prompt, understands the structure of the connected PostgreSQL schema (e.g., table names, column names like
Life Ladder,country_name, year), and automatically generates the precise SQL query required to fetch the data. - Visualization suggestion and refinement: Once the query runs, Assistant analyzes the returned dataset (e.g., time series data, categorical rankings). It then suggests the most appropriate visualization type (e.g., time series panel for trends, bar chart for rankings) and generates the panel configuration, including axis labels and legends.
This capability drastically lowers the barrier to entry for users who may not be SQL experts, allowing them to rapidly prototype and deploy complex analytical dashboards based on their private relational data.
Automated setup: A Terraform blueprint for secure observability
To demonstrate this modern observability pattern, we've created a comprehensive Terraform repository that automates the entire setup. This blueprint embodies the principle of "infrastructure as code" for your secure data connections.
Everything you need to set things up can be found in this public GitHub repo: https://github.com/mwimpelberg28/grafana_happiness
The blueprint includes the following components:
- Amazon RDS PostgreSQL instance: Provisioned securely within a private Amazon VPC, preloaded with the World Happiness Report dataset
- PDC agent deployment: The PDC agent is deployed within the same private VPC to establish the secure tunnel and enforce network restrictions
- Grafana Terraform provider: Used to programmatically create the secure PostgreSQL data source, configured specifically to route queries over the PDC tunnel
- Prebuilt Grafana dashboard: A ready-to-use dashboard featuring PostgreSQL queries to visualize happiness data, including:
- Time series panels tracking happiness scores over time
- Bar charts ranking countries by key metrics
- Tables correlating happiness metrics with factors like GDP per capita and life expectancy
Getting started with PDC and PostgreSQL
Before you start deploying the Terraform setup, you need to configure the connection credentials within Grafana Cloud. This involves setting up an access policy and a service account to authenticate the PDC agent.
Setup instructions
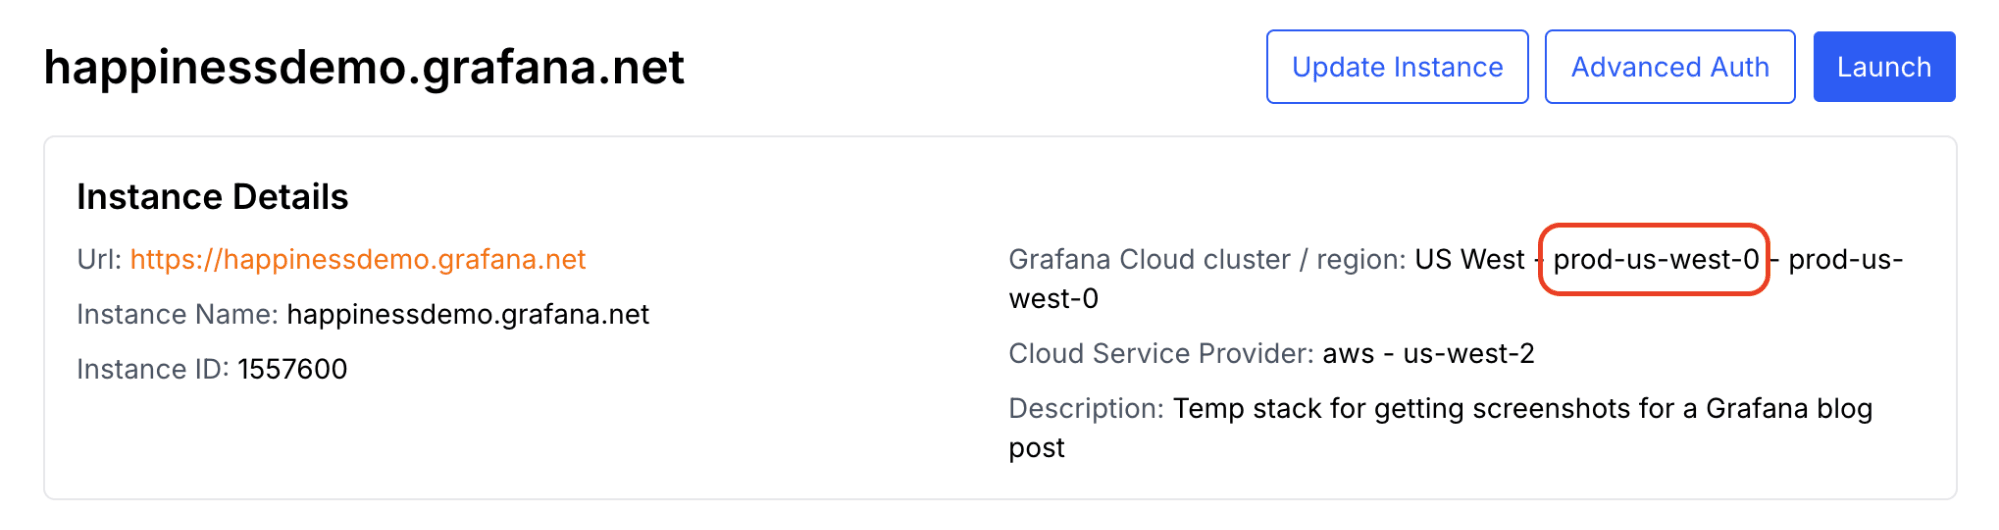
1. Find the cluster your Grafana stack is deployed in. You will use this as the value of the pdc_cluster Terraform variable.
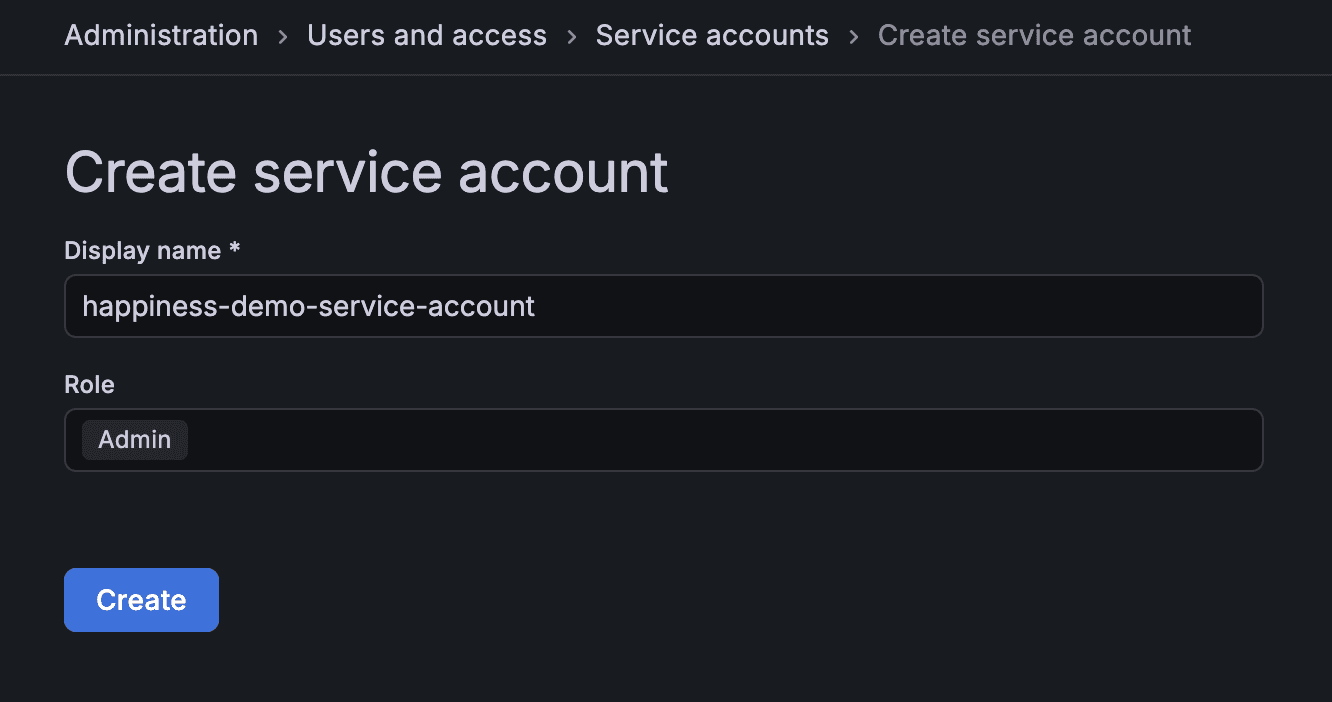
2. Create a new service account with the Admin role within Grafana. In your Grafana Cloud instance, navigate to Administration > Users and access > Service accounts and then click Add service account.
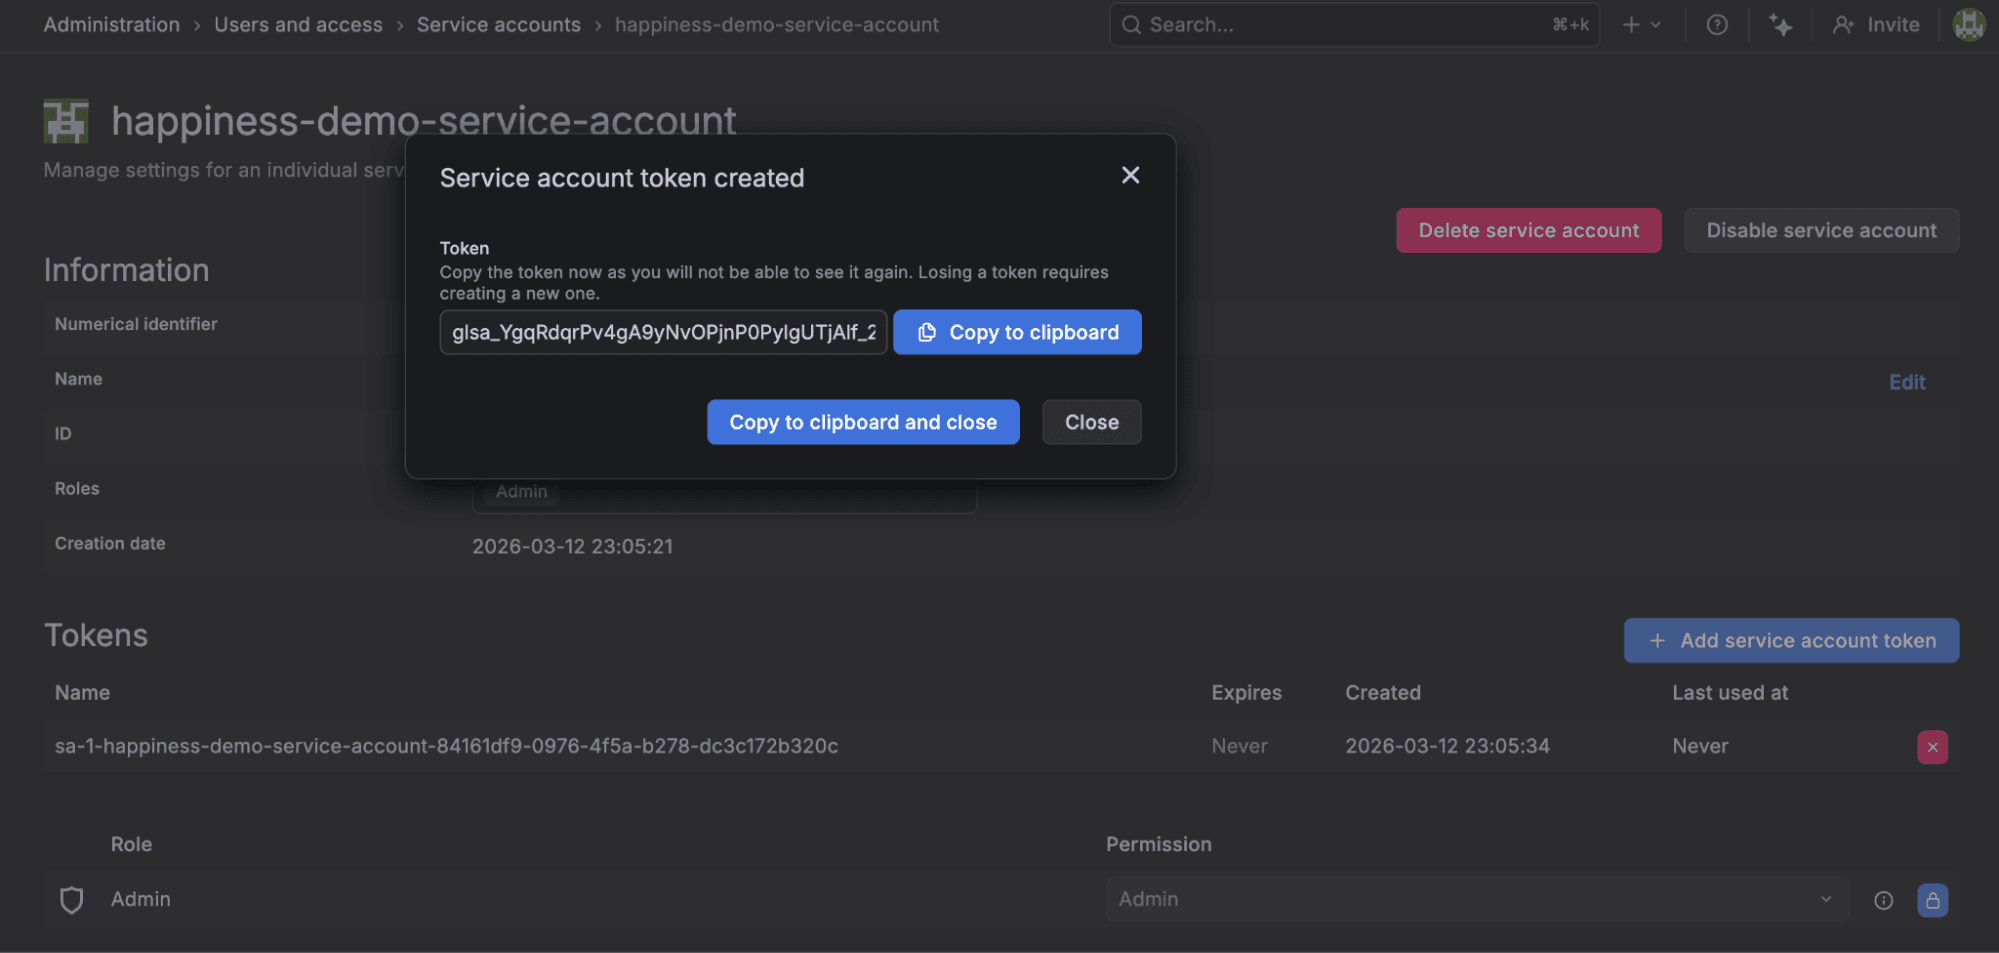
Once the service account is created, click Add service account token. Copy the token and set it as the value of the sa_token Terraform variable.
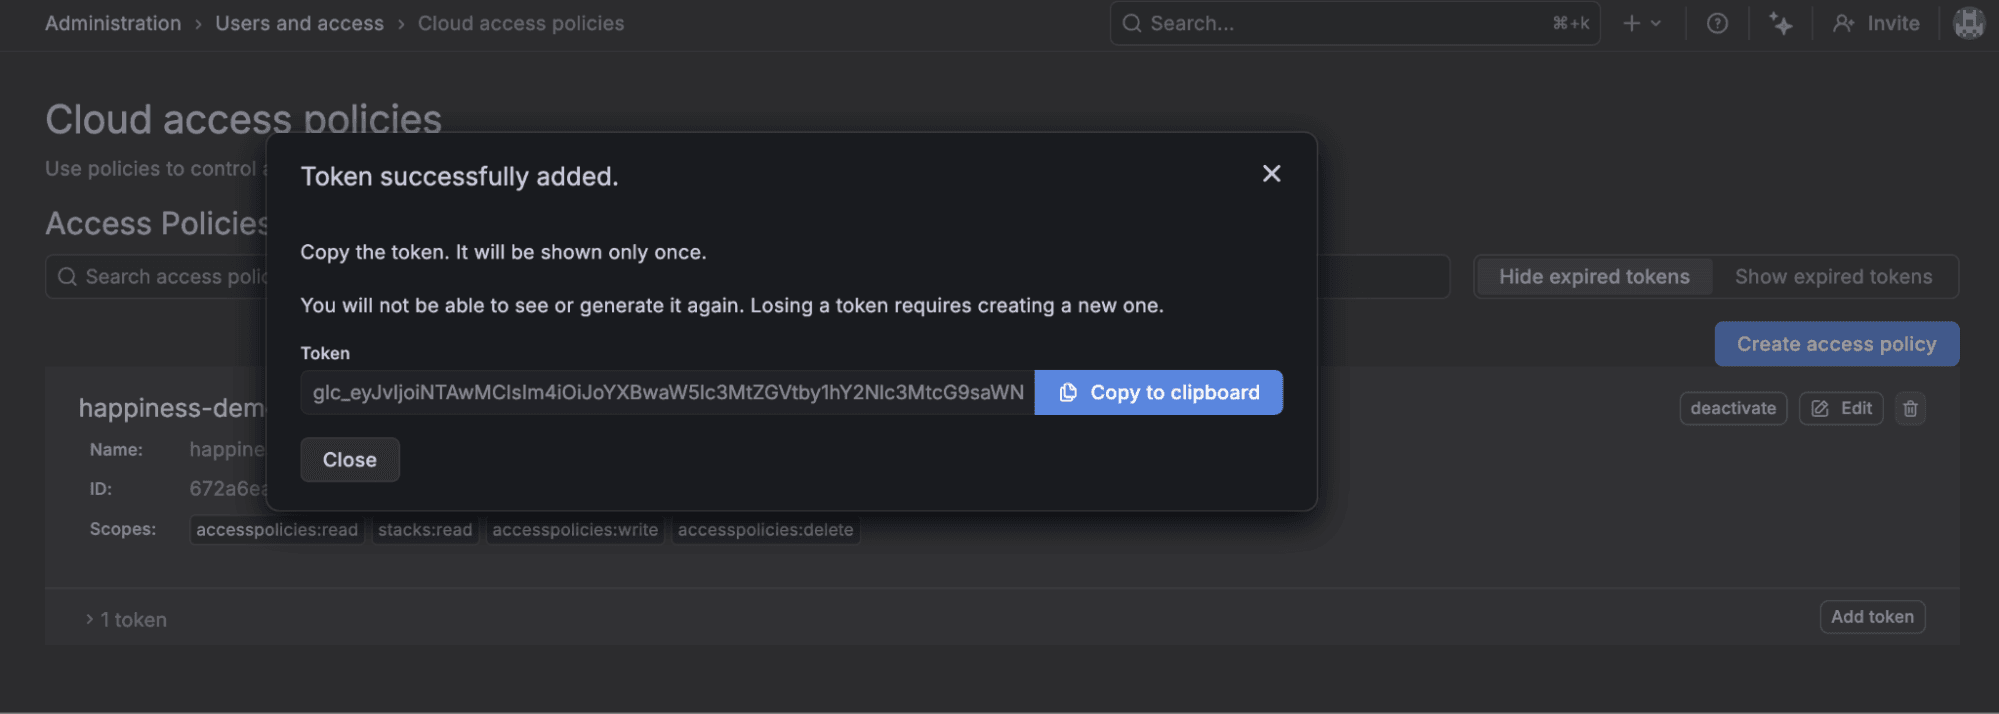
3. Next, create a new access policy by navigating to Administration > Users and access > Cloud access policies, then click Create access policy. Name your policy and then add the following permissions:
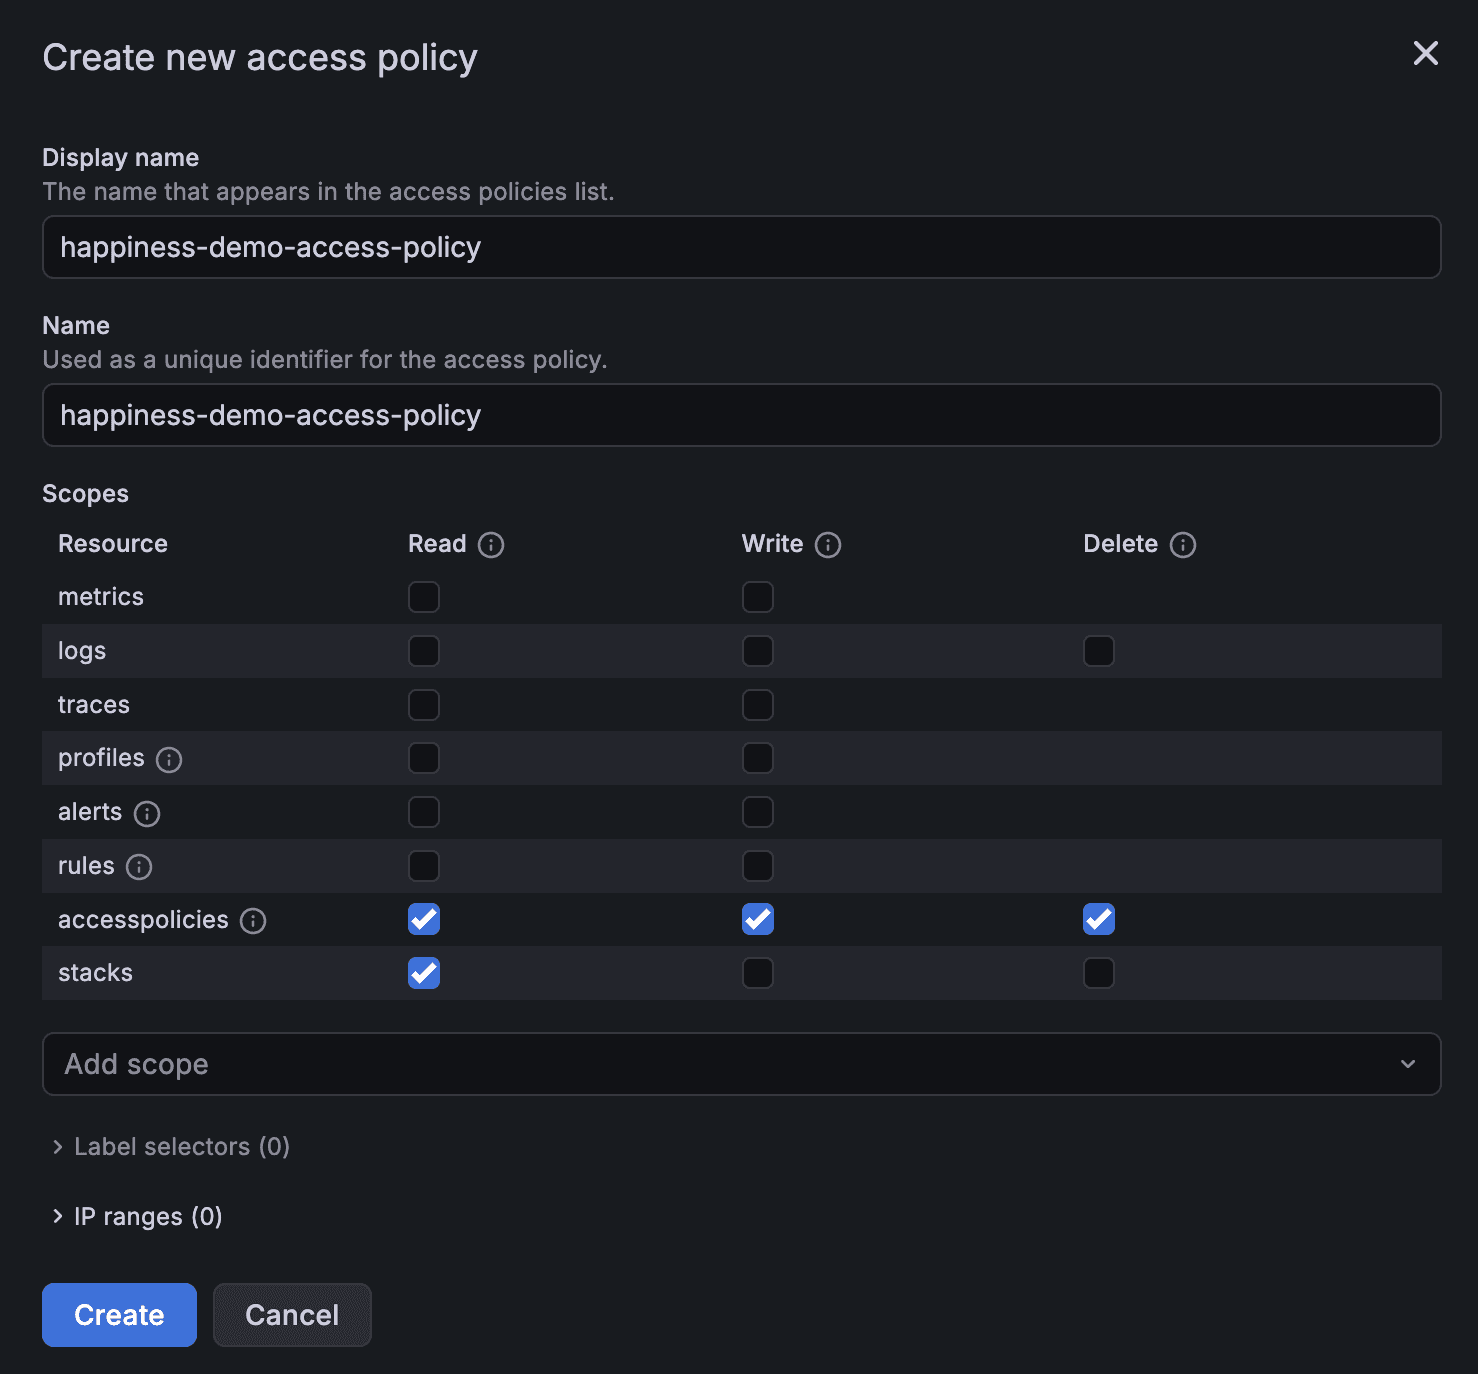
You will need to click Add scope in order to add the stacks:read permission. After you’ve created the policy, click Add token, name it (and optionally set an expiration date), then copy the token to the cloud_access_policy_token Terraform variable.
Now that we’ve finished setting up connection credentials in Grafana, let’s set the remaining Terraform variables:
Variable | Example value |
|---|---|
| https://<stack-name>.grafana.net |
| <stack-name> |
| happiness-demo-vpc |
5. Now you are ready to provision the infrastructure needed to support the demo. From the grafana_happiness repository directory, run terraform init to download the project’s dependencies, then terraform apply to create the infrastructure and Grafana resources. Please be aware that provisioning the necessary infrastructure and resources can frequently take eight minutes or more.
6. Once terraform apply has completed successfully you will find a new dashboard at Dashboards > Happiness > World Happiness Index:
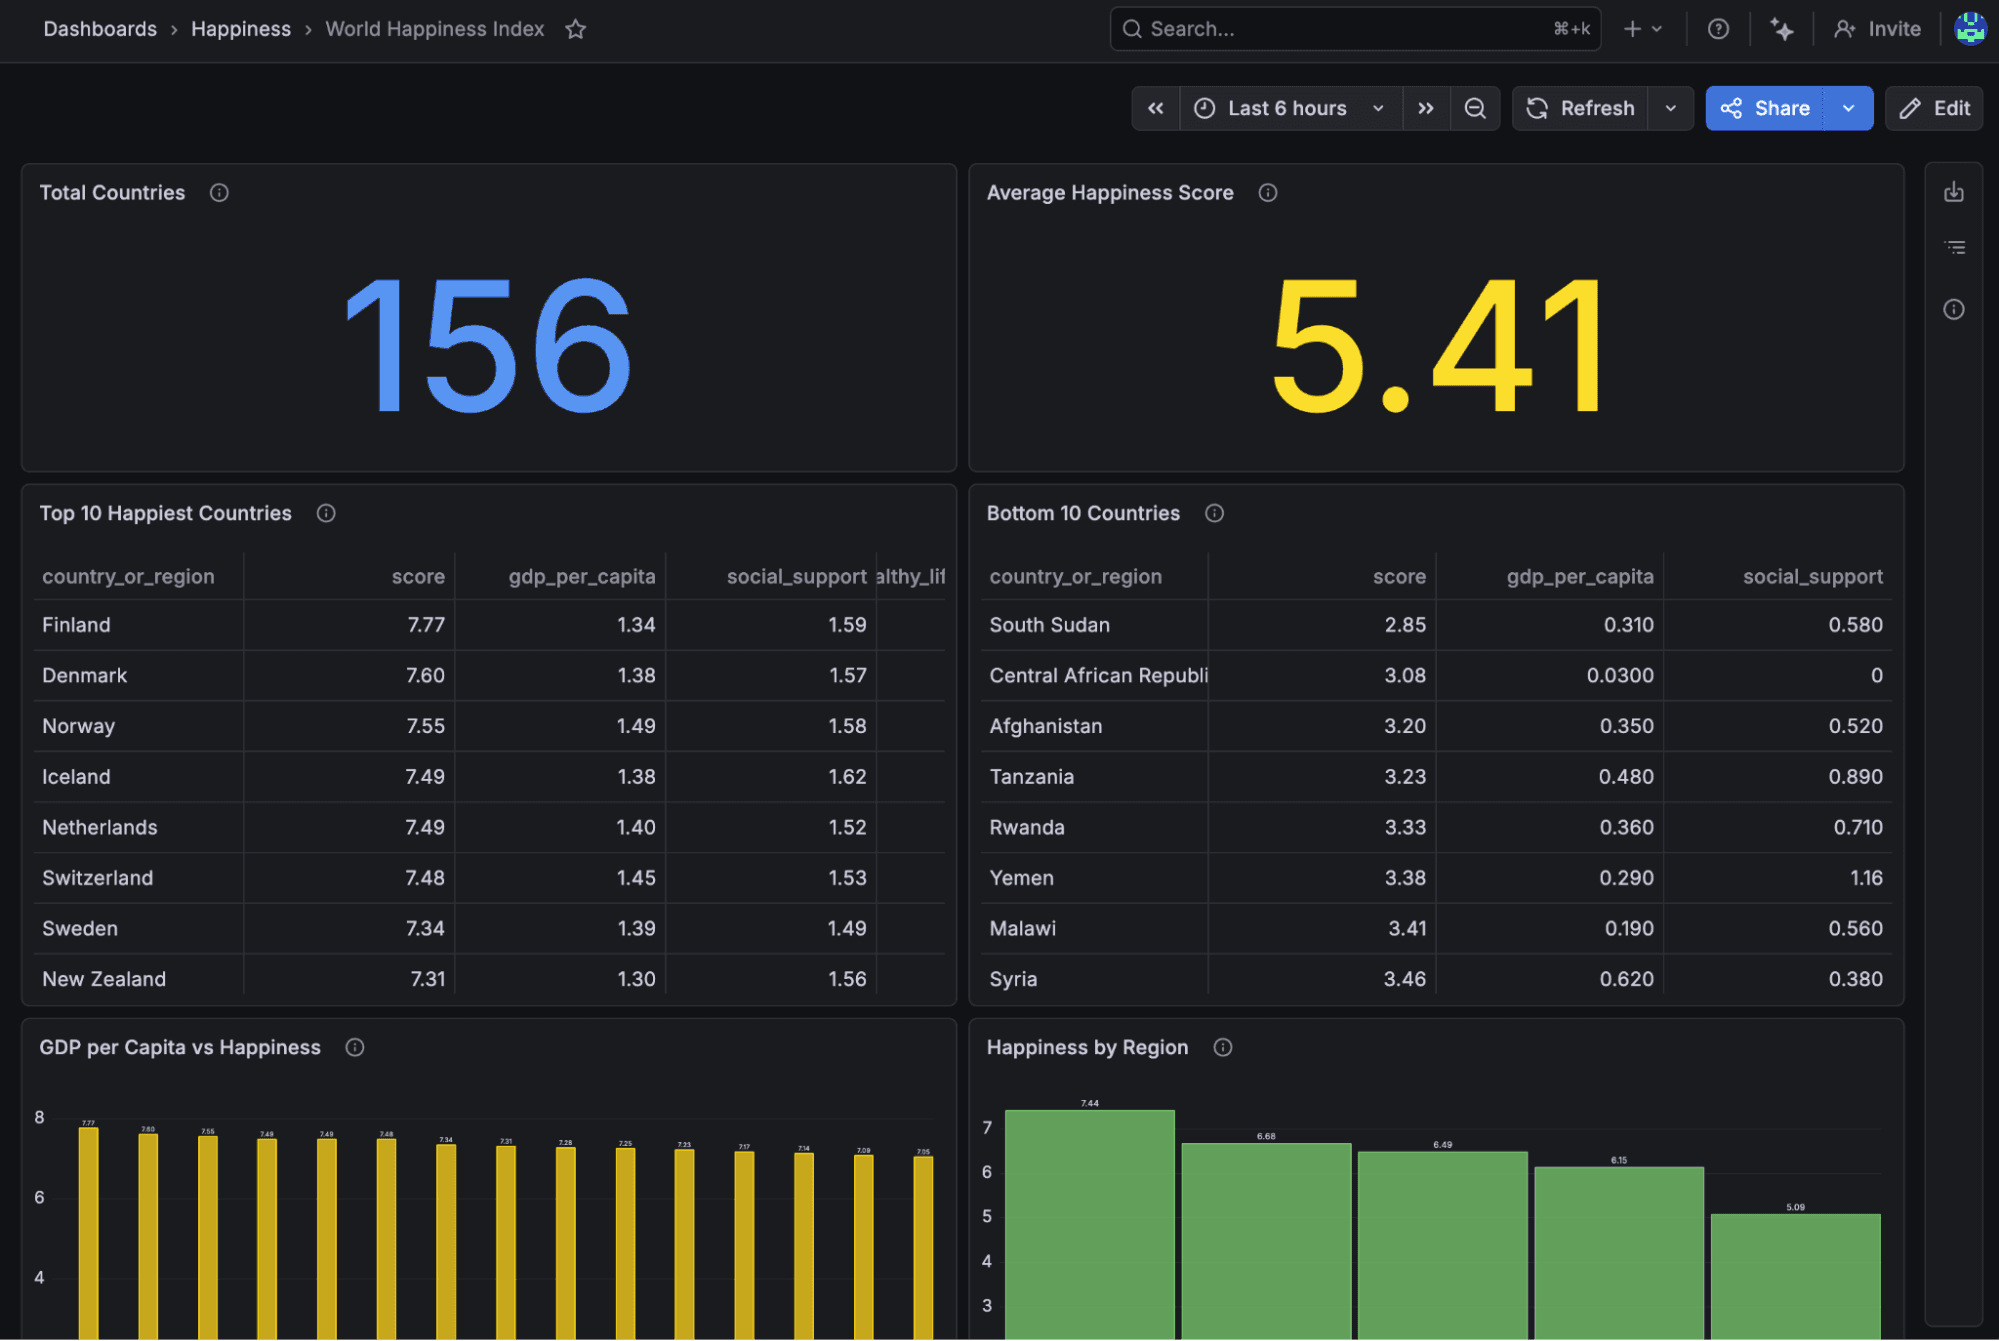
Now you are visualizing data from your new private data source using PDC!
7. This demo deploys real cloud infrastructure that costs money, so remember to run terraform destroy when you are done exploring so you don’t incur unwanted expenses.
What's next
We encourage you to use the provided demo as a starting point for your business analytics journey with Grafana Cloud. And now that you are connected to your private network, you can use any of the supported data sources for Grafana Assistant to help you analyze and visualize your business data.
Assistant can run ad hoc queries, build dashboards, and help gain insight into data without having to learn numerous query languages. In addition, Assistant can also provide the translated SQL queries if you need to use them in other systems. And check out this guide for even more use cases to explore in your journey with Grafana Assistant.
Grafana Cloud is the easiest way to get started with metrics, logs, traces, dashboards, and more. We have a generous forever-free tier and plans for every use case. Sign up for free now!

