

%3Aquality(90)%2F&w=3840&q=75)
%3Aquality(90)%2F&w=3840&q=75)
Automate all the things: How to use Grafana Cloud's AI to relieve the operational burden


Continuous integration and continuous delivery (CI/CD) have dramatically changed how we ship software. But once code reaches production, the operational work is still surprisingly manual. Engineers continually monitor systems, investigate unexpected behavior, and decide which issues require action.
And that is where the next opportunity for AI-driven automation lies.
For example, in today's CI/CD workflows, someone refreshes the pipeline page to see whether the queue has moved. Someone else reruns a failed test because it is "probably flaky." Yet another person on the team compares today's build time with last week's. And then a fourth person reads through logs, checks recent pull requests, and posts an update in Slack.
And there's a good reason for this: when the failure is ambiguous, a developer has to stop what they are doing to decide whether it is harmless noise or a reason to hold the release. The problem is that we automated the pipeline, but we didn't automate the attention it demands.
That gap matters even more today, as teams use AI to produce changes faster. DORA's 2025 research describes AI as an amplifier: It can improve software delivery throughput, but it also magnifies weak feedback loops and downstream bottlenecks. Essentially, more code moving into a delivery system doesn't automatically produce more value. And without strong testing, clear feedback, and reliable controls, it can actually lead to more instability.
The next opportunity for automation is therefore not another script that executes a known step. It is an adaptive delivery loop that watches what's happening, understands what is normal, investigates meaningful exceptions, and gives people the evidence they need to act.
Grafana Cloud's AI capabilities can help you build that loop. They can:
- Automate recurring operational checks
- Continuously watch production telemetry
- Investigate anomalies across your observability data and connected development tools
- Bring the results back to your team
The goal isn't to hand over responsibility for operating your production systems. It's to offload the repetitive work of monitoring, triage, and investigation—without losing accountability. In this blog, I'll show you how you can do just that with some of the latest updates to Grafana Assistant (including the new Automations, Watchers, and Workspace features), Assistant Investigations, and Agent Observability.
Turn recurring release checks into automations
Many delivery tasks are predictable. You perform the same checks before a release, assemble the same status update every morning, or review the same set of signals after the test suite finishes. The inputs may change, but the process never does.
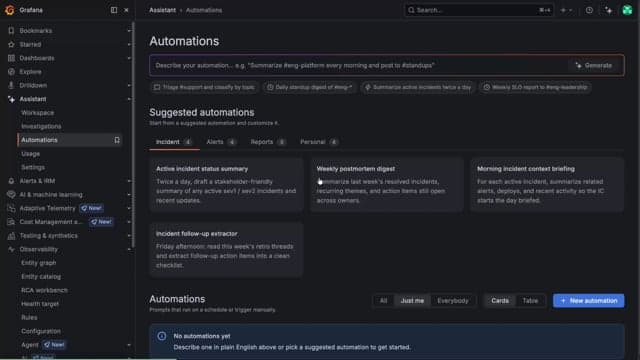
With Assistant Automations, now generally available, you can save an Assistant prompt and run it manually or on a recurring schedule. Each run gets a dedicated conversation and history, so you can inspect the output instead of losing it in a transient job log. You can also set an automation to notify a Slack channel or send you a direct message when it completes, fails, or needs approval.
For example, let's say you're part of a platform team. You could schedule a release-readiness brief for the start of each workday with a prompt like this:
Summarize the operational health of the checkout service over the last 24 hours. Highlight new incidents, recurring alerts, latency regressions, unusual error patterns, and any unresolved investigations. Keep the result under 250 words and lead with the issues most likely to require attention today.
The specific data available depends on how your CI/CD systems and development tools connect to Grafana Cloud. But once the relevant metrics, logs, and context are available to Assistant, your team no longer has to remember the checklist, visit each system, and rewrite the result for everyone else.
This is a small change with an outsized effect, as it gives you everything you need to start your day and frees you from having to compile all the data yourself. And the goal here isn't to replace engineering judgment. With Automations, you can ensure that judgment starts with a prepared brief rather than an empty browser tab and a scavenger hunt.
Give your delivery system an extra set of AI eyes
A scheduled brief handles predictable work, but it doesn't cover the other kind of operational burden: continuously checking whether something has changed enough to deserve attention.
With Assistant Watchers, available now in public preview, your always-on agents can evaluate a scoped set of Prometheus and Loki signals on an interval. You describe what the watcher should monitor, select the relevant data sources, choose its sensitivity, and give it the operational context it cannot infer on its own. The watcher then calibrates the queries it will use and the baseline it will judge them against.
%3Aquality(90)%2F&w=3840&q=75)
That context is important. A failed test doesn't always mean the product is broken; a brief queue spike may be normal at the start of the workday; a dependency update may cause an expected one-time cache rebuild. A useful watcher needs to know the difference between a deviation and a problem.
Let's go back to our hypothetical platform team. Imagine you've configured a watcher for a busy CI pipeline. Grafana Cloud receives metrics for job duration, queue latency, runner utilization, test outcomes, and retries, along with the corresponding build logs. Your team tells the watcher that a small number of retries is normal, but a sustained increase across multiple suites or a new error pattern should receive attention.
On each run, the watcher compares the current window with its baseline and considers the operator's intent, calibration notes, and previous observations. It records a concise ok, warning, or critical assessment and maintains a ranked list of unresolved concerns. It also remembers what it already reported, so you don't have to worry about it posting the same notification every few minutes while an issue remains unchanged.
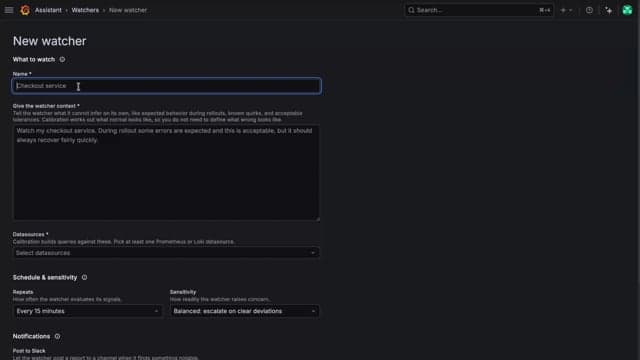
For example, our platform team's watcher might notice that checkout latency has been creeping upward over the last two days. Error rates remain stable and there's no sign of any customer-facing impact, so the watcher doesn't launch an Investigation. Instead, it records the observation, posts a short summary to Slack, and gives the team an opportunity to decide whether the trend deserves attention.
That is a meaningful step beyond a static threshold. A threshold can tell you that a value crossed a line, but a watcher can consider whether the change is unusual, whether multiple signals corroborate it, or whether it fits a known-normal event. It can even tell whether it's important enough to interrupt someone.
When the watcher decides the issue is worth flagging, it can post a short, evidence-based observation to Slack.
In our example, the message might explain that checkout latency has increased by 20% over the past six hours, summarize the supporting evidence, and link back to the relevant dashboards. An engineer can quickly decide whether to continue monitoring the trend or launch a deeper investigation.
Escalate the exception, not the noise
Watchers are deliberately scoped. A watcher observes a narrow slice of telemetry and decides whether something warrants attention. It does not pretend that this is enough information to diagnose the cause or prescribe a fix.
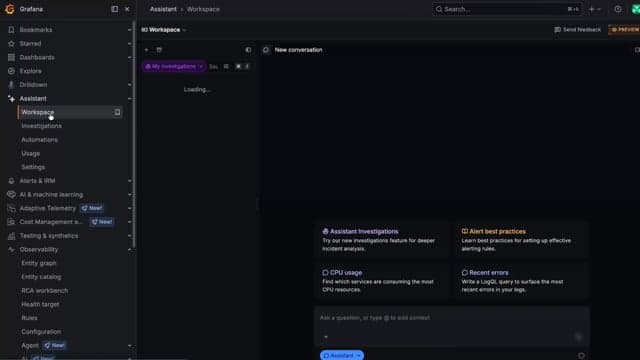
When deeper analysis is justified, a watcher can trigger an investigation with Grafana Assistant Investigations, which is now generally available, to examine the broader system. Investigations works across metrics, logs, traces, and profiles to develop and test hypotheses, then it produce a structured report. In Assistant Workspace, you can follow its progress, inspect its source queries and panels, review what it has ruled out, and add guidance while it works.
This separation creates a useful operational pattern:
- The watcher continuously and economically assesses a focused set of signals.
- It stays quiet when behavior is normal or the evidence is weak.
- It escalates only when independent, deeper analysis is warranted.
- Investigations gathers evidence across the system and presents its conclusions for review.
Suppose your team's test retries rise sharply while build duration and runner saturation remain normal. The watcher can report the change without guessing why it happened. The resulting investigation can look beyond the initial signal to examine the build logs, compare failure timing, trace calls to affected test dependencies, and check whether other services show the same behavior.
If your team connects GitHub to Assistant through a Model Context Protocol (MCP) server, Investigations can also bring recent pull requests, commits, issues, and code context into the analysis. It might find that the new failures began after a dependency change, identify the affected code path, and show the evidence connecting that change to the telemetry. From there, it can recommend a focused next step, such as correcting the test setup, isolating a shared dependency, or reverting a change while the team investigates further.
The engineer still reviews the evidence and decides what to change. The value is that they arrive at that decision with the likely regression, relevant context, and a proposed path forward already assembled.
This is what resolution should look like in an AI-backed delivery workflow today: less time reconstructing what happened, more time applying informed judgment to the fix.
Bring the result to the team in Slack
An insight that waits silently in another tab doesn't remove much operational burden. The loop has to reach the people responsible for the decision.
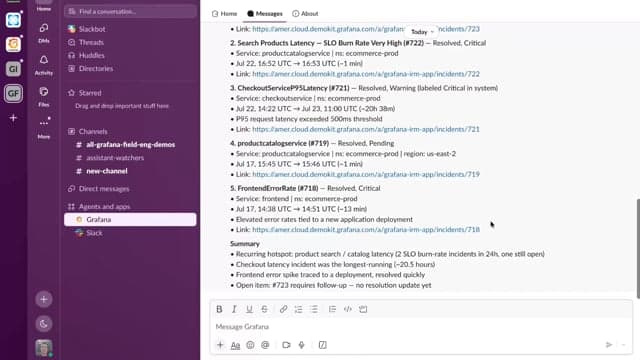
Automations and watchers can proactively notify your team in Slack.
In our platform team's case, the watcher posts that checkout latency has been steadily increasing, explains why it considers the trend unusual, and links to the supporting dashboards. During the morning standup, an engineer immediately recognizes that the increase began after a recent infrastructure change and decides it's worth launching an investigation with Assistant Investigations.
A watcher notification includes the assessment, its strongest supporting evidence, the current count of ongoing concerns, and links back to the watcher or launched investigation. Instead of pasting screenshots and partial log excerpts into a channel, an engineer can open the underlying work with its context intact.
Your team can also interact with Assistant directly from Slack. Teammates can ask follow-up questions, find relevant dashboards, query metrics and logs, and continue an incident conversation using their own linked Grafana permissions. This keeps routine coordination close to the team's existing workflow without separating it from the underlying observability evidence.
The outcome isn't simply fewer clicks. It is less context reconstruction. The person receiving the notification doesn't need to ask who checked which dashboard, what timeframe they used, or whether the conclusion was based on one noisy signal. The investigation and its sources are already there.
Treat agent quality as a CI signal
The same principles become even more important when the software you're preparing to deploy includes an AI agent.
Traditional software usually fails in ways our delivery systems understand: a test assertion fails, a process crashes, or a response violates a schema. Agents can regress more subtly.
- A prompt change may make responses less useful without producing an error.
- A new model may improve quality but double latency or cost.
- A tool change may work for common requests while making an important edge case unreliable.
- The same input can produce different results across repeated runs.
Grafana Agent Observability, which will be generally available later this week, makes conversations, generations, tool calls, traces, evaluation scores, latency, token use, and cost observable together. It also catalogs agent versions so you can understand how prompt, model, and tool changes relate to behavior over time.
With offline experiments, you can bring that visibility directly into CI. Define known test scenarios in YAML or JSON, run the candidate agent against them from your existing harness or CI job, and send the resulting trials, scores, traces, conversations, and artifacts to Agent Observability. The experiment report groups the results by test case and lets you compare a candidate with a baseline side by side.
Imagine the same platform team is rolling out an update to its customer support agent. Before promoting the new version, they compare it against the current production baseline. The experiment immediately highlights that while the new model improves overall quality, it also introduces a regression in refund-related conversations and increases latency by 30%, giving the team enough evidence to delay the rollout.
That comparison can answer the questions a green build cannot:
- Did the candidate improve quality across the full suite, or only on average?
- Does it succeed consistently when the same scenario runs more than once?
- Which test cases regressed, and what happened inside those conversations?
- Did a model or prompt change increase latency, token usage, or cost?
- Are the results strong enough to pass the team's release criteria?
Because the experiment connects scores to the underlying agent conversations and traces, a failed quality check is not a dead end. You can open the low-scoring trial, inspect the prompt and tool flow, review the evaluator's explanation, and compare it with the baseline behavior. Your CI gate becomes both a decision and a path into the evidence behind it.
After deployment, online evaluations can continue scoring live traffic and alert when quality drops. Together, offline and online evaluation turn agent quality into a continuous delivery signal rather than a one-time manual review.
Offload vigilance, not accountability
As AI systems become more autonomous, the question is no longer whether to automate, but where humans should remain in control. Modern AI can interpret telemetry, identify likely causes, and initiate workflows, but practitioners still need to understand why those decisions were made and retain control over consequential actions.
Practitioners are interested in that potential, but they expect transparency and control. In the Grafana Labs 2026 Observability Survey, 92% of respondents saw value in AI surfacing anomalies before they cause downtime. At the same time, autonomous action attracted more skepticism than any other AI observability use case, and 95% of respondents said it was important for AI to explain its reasoning.
An effective AI-backed delivery system should reflect both sides of that result.
Automations and watchers run within configured scopes and identities. Watchers expose their assessment, rationale, calibrated checks, and telemetry digest. Assistant Investigations shows its hypotheses and source queries instead of returning an unsupported answer. Connected tools continue to use permissions and approval controls. Humans remain responsible for consequential changes and the final release decision.
The point is not to remove people from CI/CD. We want you to stop spending your attention on work a system can perform repeatedly: polling, comparing, correlating, summarizing, and carrying context between tools. You should enter the loop where your judgment has the most value.
Start with one boring loop
You don't need to redesign your entire software delivery process to benefit from this approach. Start with a task your team already performs often and understands well.
Bring the relevant production telemetry into Grafana Cloud. Turn recurring operational checks into an Assistant Automation. Configure a watcher with a clear description of what normal looks like and when the team wants to be interrupted. Send meaningful findings to Slack, and let critical exceptions open an Investigation using the evidence preserved in an Assistant workspace.
Need some inspiration to help you get started? Try these sample prompts in Assistant. Just modify the text to fit your needs, and enter it directly into the chat window.
Automation
"Create an automation that runs every weekday at 8:00 AM to summarize the operational health of the checkout service over the previous 24 hours. Highlight unusual latency, error rates, infrastructure changes, and any unresolved investigations. Keep the summary under 250 words and prioritize anything that may require attention today."
Watcher
"Create a watcher to monitor the checkout service for issues that could impact customers. Look for unusual patterns across the available telemetry, notify me when you identify something that deserves attention, and explain why you think it's important."
If you ship agents, add a small offline evaluation suite for the scenarios you would be least comfortable breaking. Compare each candidate with the current release and make quality, consistency, latency, and cost part of the deployment decision.
The best first workflow probably won't be the most ambitious one. It will be the familiar task everyone agrees is tedious, necessary, and repeated too often. Automate that loop, learn where human judgment still matters, and expand from there.
CI/CD gave us repeatable execution. AI-backed observability can make the attention around that execution repeatable too. That means fewer interruptions, faster answers, clearer release decisions, and more time for engineers to work on improvements that last.
Grafana Assistant is the easiest way to get started with metrics, logs, traces, dashboards, and more in Grafana Cloud. We have a generous forever-free tier and plans for every use case. Sign up for free now!
%3Aquality(90)%2F&w=3840&q=75)
%3Aquality(90)%2F&w=3840&q=75)


