

A faster way to pinpoint performance bottlenecks: Using Profiles Drilldown with Grafana Cloud Knowledge Graph
When you identify CPU or memory spikes in your services, it’s critical to understand why they’re happening. But switching between tools or crafting complex queries can slow you down when trying to pinpoint a root cause.
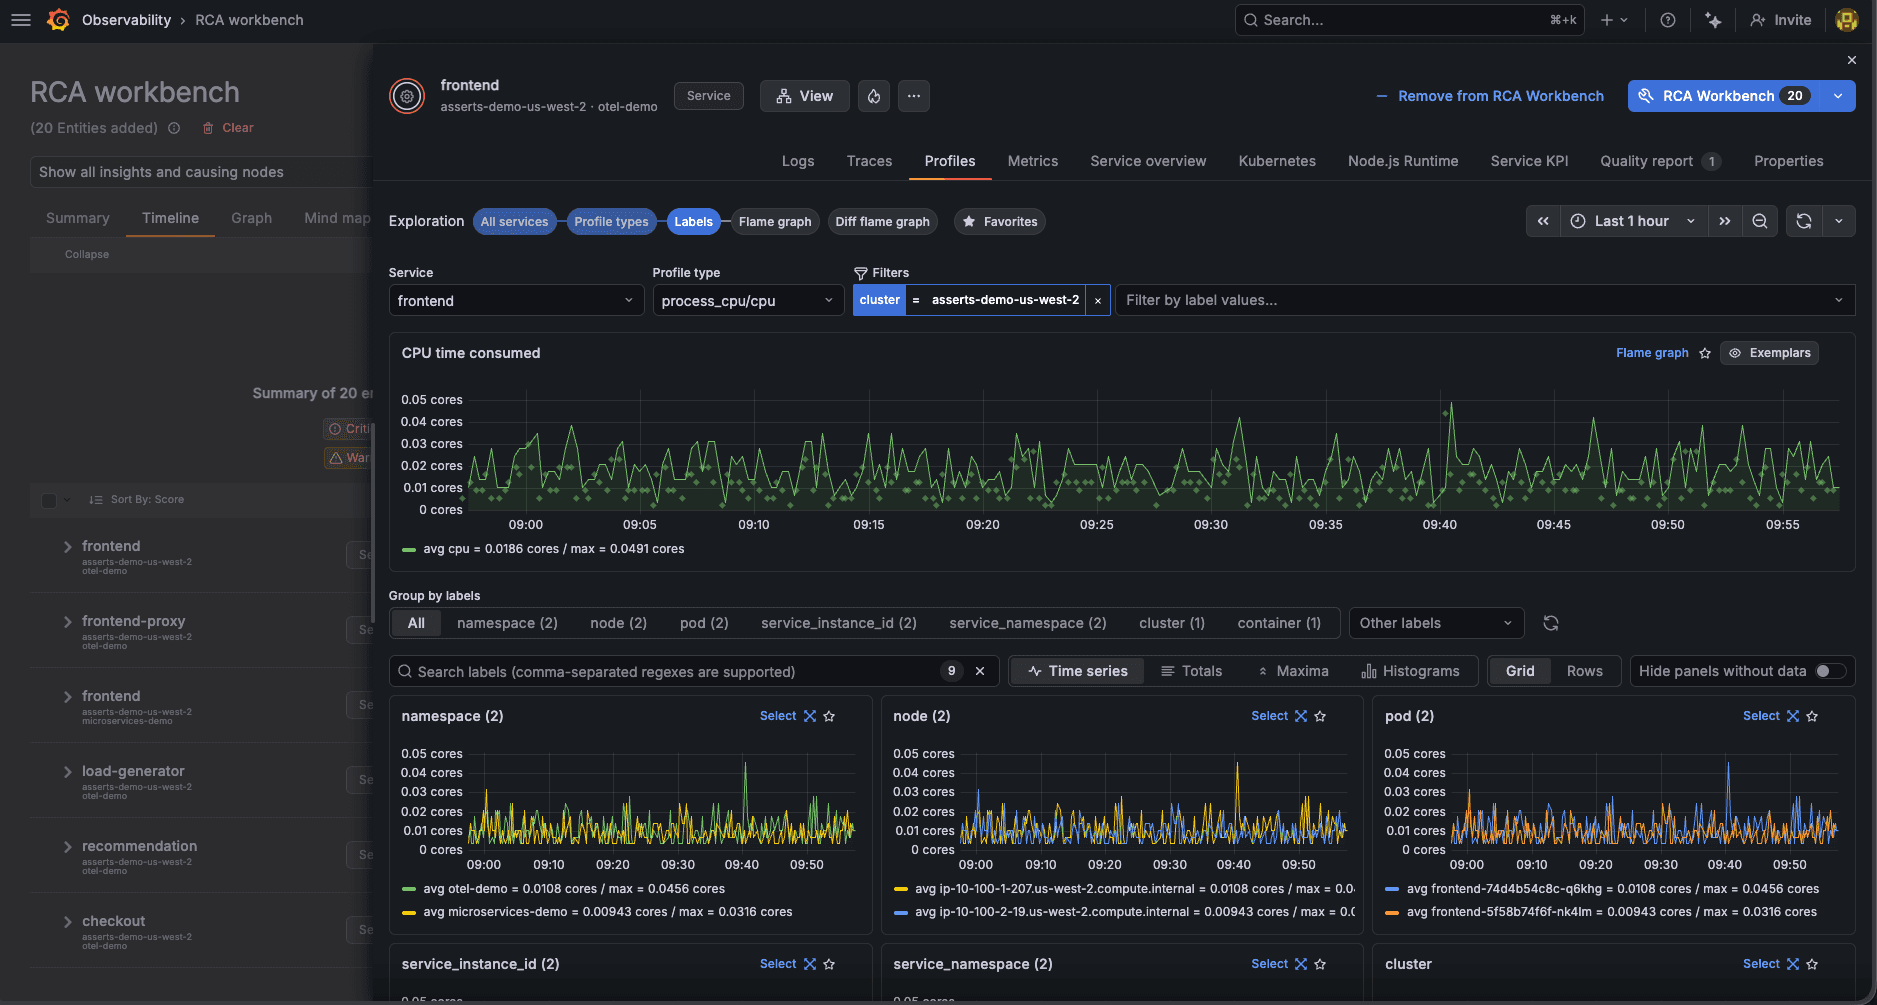
This is why we’re excited to share that Profiles Drilldown, an application that lets you easily explore profiling data through an intuitive, point-and-click interface (no queries required), is now integrated with Grafana Cloud Knowledge Graph.
This powerful integration brings CPU profiling data directly into your existing knowledge graph workflows, making it easier and faster to find the exact code paths responsible for performance bottlenecks.
Why integrate the Drilldown apps with the knowledge graph?
The knowledge graph connects metrics, logs, traces, and profiles across Application Observability, Frontend Observability, and Kubernetes Monitoring solutions in Grafana Cloud and combines the telemetry into a single intelligent map of a system's apps, databases, nodes, and more. By modeling your environment as entities and relationships, the knowledge graph lets you correlate telemetry and investigations across any part of your stack so you can resolve issues faster.
Profiles Drilldown builds on the queryless investigation experience already available in Grafana Cloud Knowledge Graph. With this integration, you can move from infrastructure and application signals into code-level profiling data without leaving your investigation workflow. The goal of bringing Profiles Drilldown into the knowledge graph is simple: to help you go from detecting a performance issue to understanding the exact code paths behind it, without changing context or writing complex queries.
For example, if you’re investigating a service with high CPU or memory usage, you can now open Profiles Drilldown directly from the knowledge graph KPI drawer for that entity, such as a service or pod. Profiles Drilldown automatically inherits the entity context, filters, and time window from your knowledge graph investigation.
In addition to viewing your profiling data from within the knowledge graph drawer, you can also view it alongside Metrics Drilldown, Logs Drilldown, and Traces Drilldown for a fully integrated experience.
This allows for:
- Faster root cause analysis: Move immediately from spotting a high resource usage alert in the knowledge graph to seeing flame graphs and profiling data that explain why that resource is being consumed.
- Contextual insight: Profiles Drilldown automatically filters the profiling data based on the knowledge graph entity you are focused on, ensuring you dive straight into the most relevant data.
- A fully queryless experience: You can connect profiling data to operational context without manually building queries across tools.
A streamlined workflow for troubleshooting
With Profiles Drilldown embedded in the knowledge graph, troubleshooting performance issues becomes much more direct. Here’s an example of what that new workflow looks like:
- Spot the issue in the knowledge graph: Identify an anomalous KPI related to CPU or memory usage.
- Access Profiles Drilldown: Click to view the service's profiles directly in the knowledge graph KPI drawer.
- Explore the flame graph: Instantly see the flame graph rendered within the knowledge graph, showing the exact functions consuming resources over time.
- Isolate the problem: Use the interactive flame graph and top function list to identify the most expensive operations, accelerating your path to a fix.

The embedded experience uses the same intuitive interface as the standalone Profiles Drilldown app, allowing you to quickly switch between CPU and memory profiles, and compare historical trends and attributes without ever leaving the knowledge graph.
Next steps
This integration reflects our on-going commitment to reducing complexity across observability workflows. Grafana Cloud Knowledge Graph helps you identify where a problem is happening, and Profiles Drilldown helps you understand why by exposing the code-level work behind CPU and memory consumption.
To learn more, please check out our documentation for the knowledge graph and Drilldown apps, and stay tuned as we continue to extend our exploration workflows across Grafana Cloud.
Grafana Cloud is the easiest way to get started with metrics, logs, traces, dashboards, and more. We have a generous forever-free tier and plans for every use case. Sign up for free now!

