
Visualize Amazon Aurora, Zendesk, and more: What’s new in Grafana data sources
One of our biggest goals at Grafana Labs is to help you unify and derive value from your data, regardless of where that data lives. As a result, we’re fully committed to making Grafana an open, composable, and extensible observability platform.
Last week at GrafanaCON 2025, where we celebrated the launch of Grafana 12, we highlighted one of the key ways we deliver on this promise of openness and extensibility: our broad ecosystem of Grafana data sources.
These data sources enhance your overall observability strategy by letting you query, visualize, and alert on disparate systems from within one, centralized platform. This means you can more easily correlate data, identify root causes, and reduce MTTR.
A growing ecosystem of data sources
Today, there are over 150 data sources in our catalog. Some of these were created by the Grafana Labs team, and others by our community members and partners (thank you!). Many of these data sources are freely available for use in Grafana OSS.
Grafana Enterprise data sources, in particular, are data sources that are exclusively built and maintained by Grafana Labs and are available in Grafana Enterprise and Grafana Cloud, including in our generous free-forever tier.
We’re always working to expand our line-up of data sources to help you visualize data from all your go-to tools and platforms directly within Grafana. Here, we’ll take a closer look at some of our new Grafana data sources, and how they can help you gain deeper insights into databases, your CI/CD pipelines, incident response systems, and more.
Data sources for application databases
With so many organizations managing distributed, multi-cloud environments, we know there’s a growing need to visualize data from different application database services. To help you do just that using the Grafana dashboards you already know and love, we’ve introduced the following data sources:
Amazon Aurora: Analyze data from the highly available relational database service running on AWS. This data source supports Aurora Engines compatible with both MySQL and Postgres.

Azure CosmosDB: View data from the globally distributed, fully managed NoSQL database service running on Microsoft Azure.
CockroachDB: Use Grafana dashboards to drill down into the cloud native, distributed SQL database designed for high availability and scalability.

Yugabyte: Connect Grafana to your instance of YugabyteDB, another cloud-native, distributed SQL database.
Note: Amazon Aurora, Azure CosmosDB, and CockroachDB data sources are available for Grafana Enterprise and Grafana Cloud.
Data sources for web development and CI/CD tools
Looking to visualize data related to your CI/CD pipelines? The following data sources for Grafana can help:
Drone: Retrieve data from your repositories and builds in Drone, the continuous deployment platform.
Netlify: Visualize data from Netlify, the platform for building, deploying, and scaling modern web applications, in Grafana dashboards. You can view information related to all sites within your Netlify account, each of your builds, and more.
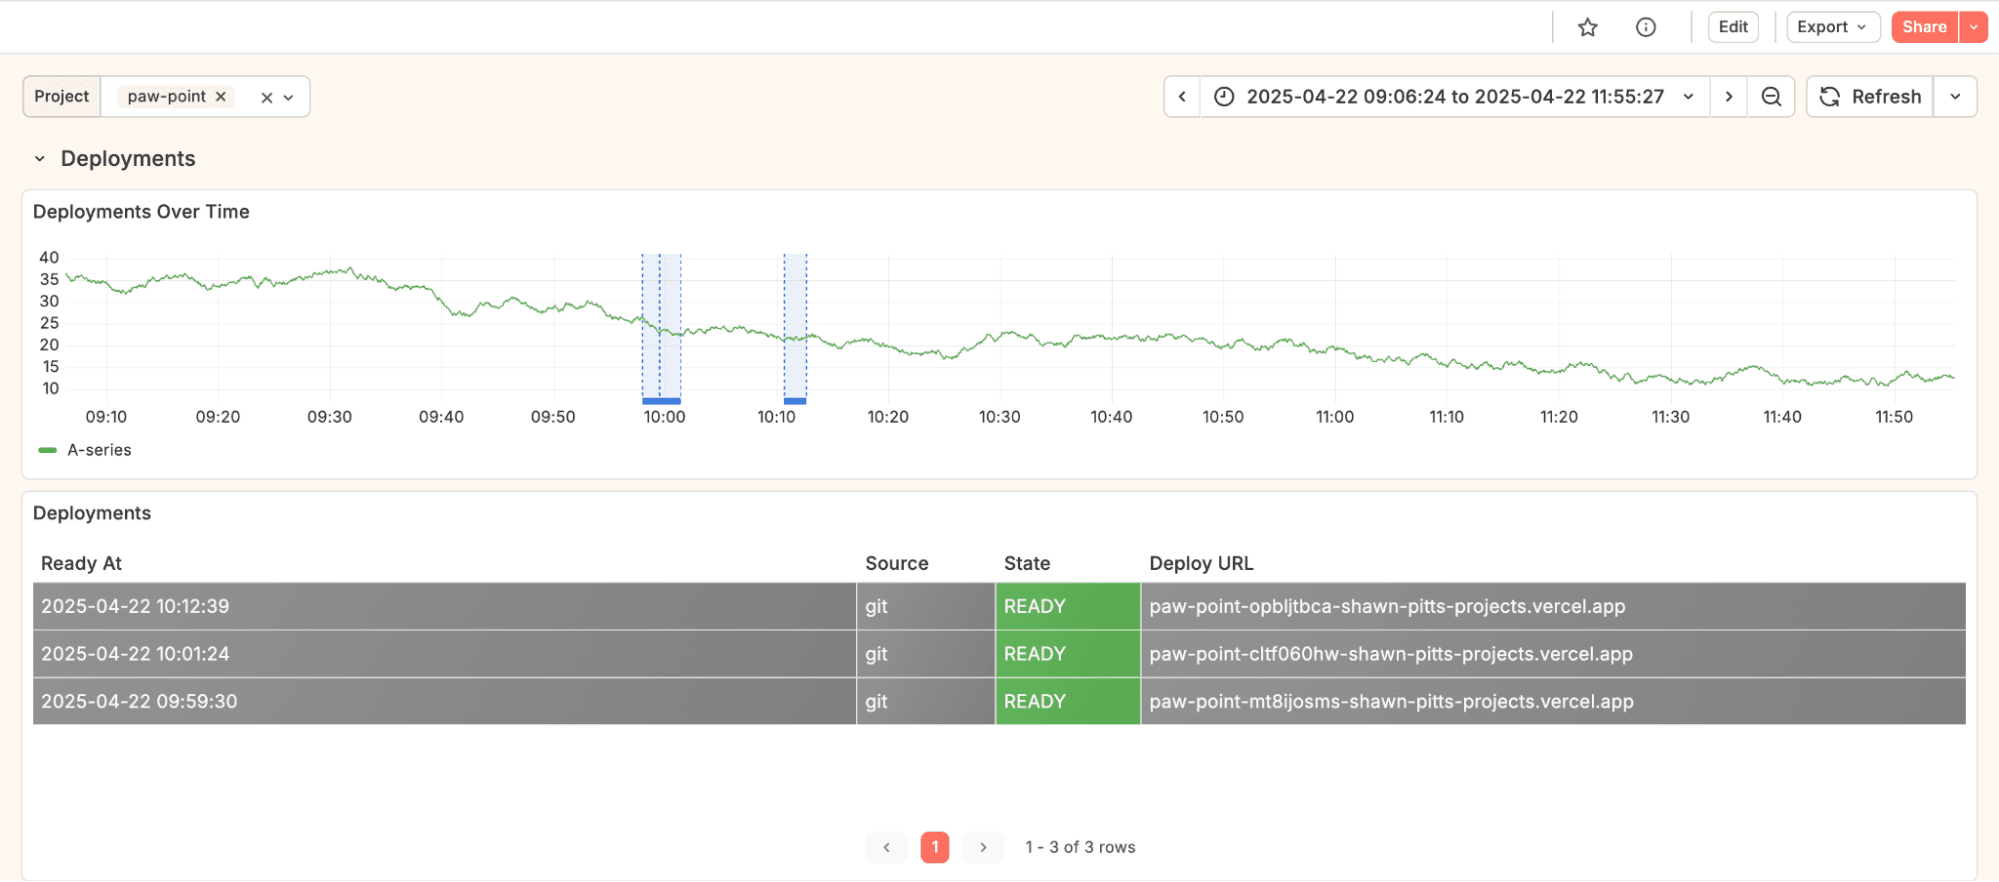
Vercel: Analyze data from the cloud web development platform with queries including Access Groups, Aliases, Artifacts, Checks, Deployments, and Projects.
Note: Netlify and Vercel data sources are available for Grafana Enterprise and Grafana Cloud.
Data sources for incident management, support, and analytics tools
We’ve also rolled out the following data sources for incident management, support, and analytics tools:
Adobe Analytics: Use Grafana dashboards to view data from your reports in Adobe Analytics, the web, product, and mobile analytics solution.
Atlassian Statuspage: Visualize critical data related to incidents and maintenance windows from Atlassian’s communication tool. Supported queries include Unresolved incidents, All incidents, Upcoming scheduled maintenances, and Active scheduled maintenances.
Zendesk: Dig into data from Zendesk customer service and help desk systems.

Note: Adobe Analytics, Atlassian Statuspage, and Zendesk data sources are available for Grafana Enterprise and Grafana Cloud.
Data sources for observability and monitoring tools
Lastly, in the past year, we’ve announced the following data sources to help you query and visualize data from popular infrastructure and network monitoring tools:
Amazon Managed Service for Prometheus: Create dashboards for the Prometheus-compatible AWS service that monitors and provides alerts on containerized applications and infrastructure at scale.
Azure Monitor Managed Service for Prometheus: Use Grafana to visualize data from Azure’s managed service that helps you collect and analyze Prometheus metrics.
Catchpoint: Create custom queries using the SLO, RUM, and Test query types to fetch the exact service-level objective, real user monitoring, and performance testing data you need.

Cloudflare: Query and visualize data from the web application security and performance platform, including critical data about your Domain Name System and your global internet traffic.

LogicMonitor: Easily view data from the cloud-based infrastructure monitoring and observability platform in your Grafana dashboards. To try an early preview of this data source, please contact us.
Note: Catchpoint, Cloudflare, and LogicMonitor data sources are available for Grafana Enterprise and Grafana Cloud.
To learn more about Grafana data sources, please check out our technical docs and watch this webinar.
Ready to start extending Grafana with these and other data sources? Sign up for a free Grafana Cloud account (if you don’t already have one) to start exploring the possibilities today!

