Grafana 11.4 release: Introducing support for OpenSearch PPL and OpenSearch SQL in the AWS CloudWatch data source plugin
Holidays came early for AWS users: Grafana 11.4 introduces support for two new query languages in the AWS CloudWatch data source plugin.
Announced during AWS re:Invent, AWS CloudWatch Logs expanded its querying capabilities with the addition of OpenSearch Piped Processing Language (PPL) and OpenSearch SQL. In Grafana 11.4, the AWS Cloudwatch data source plugin has been updated to offer the same functionality — and the same flexibility. If you’re an AWS user, you can now choose the query language that you’re most familiar with to filter and aggregate your CloudWatch logs, and OpenSearch users will be able to query their logs without having to duplicate data.
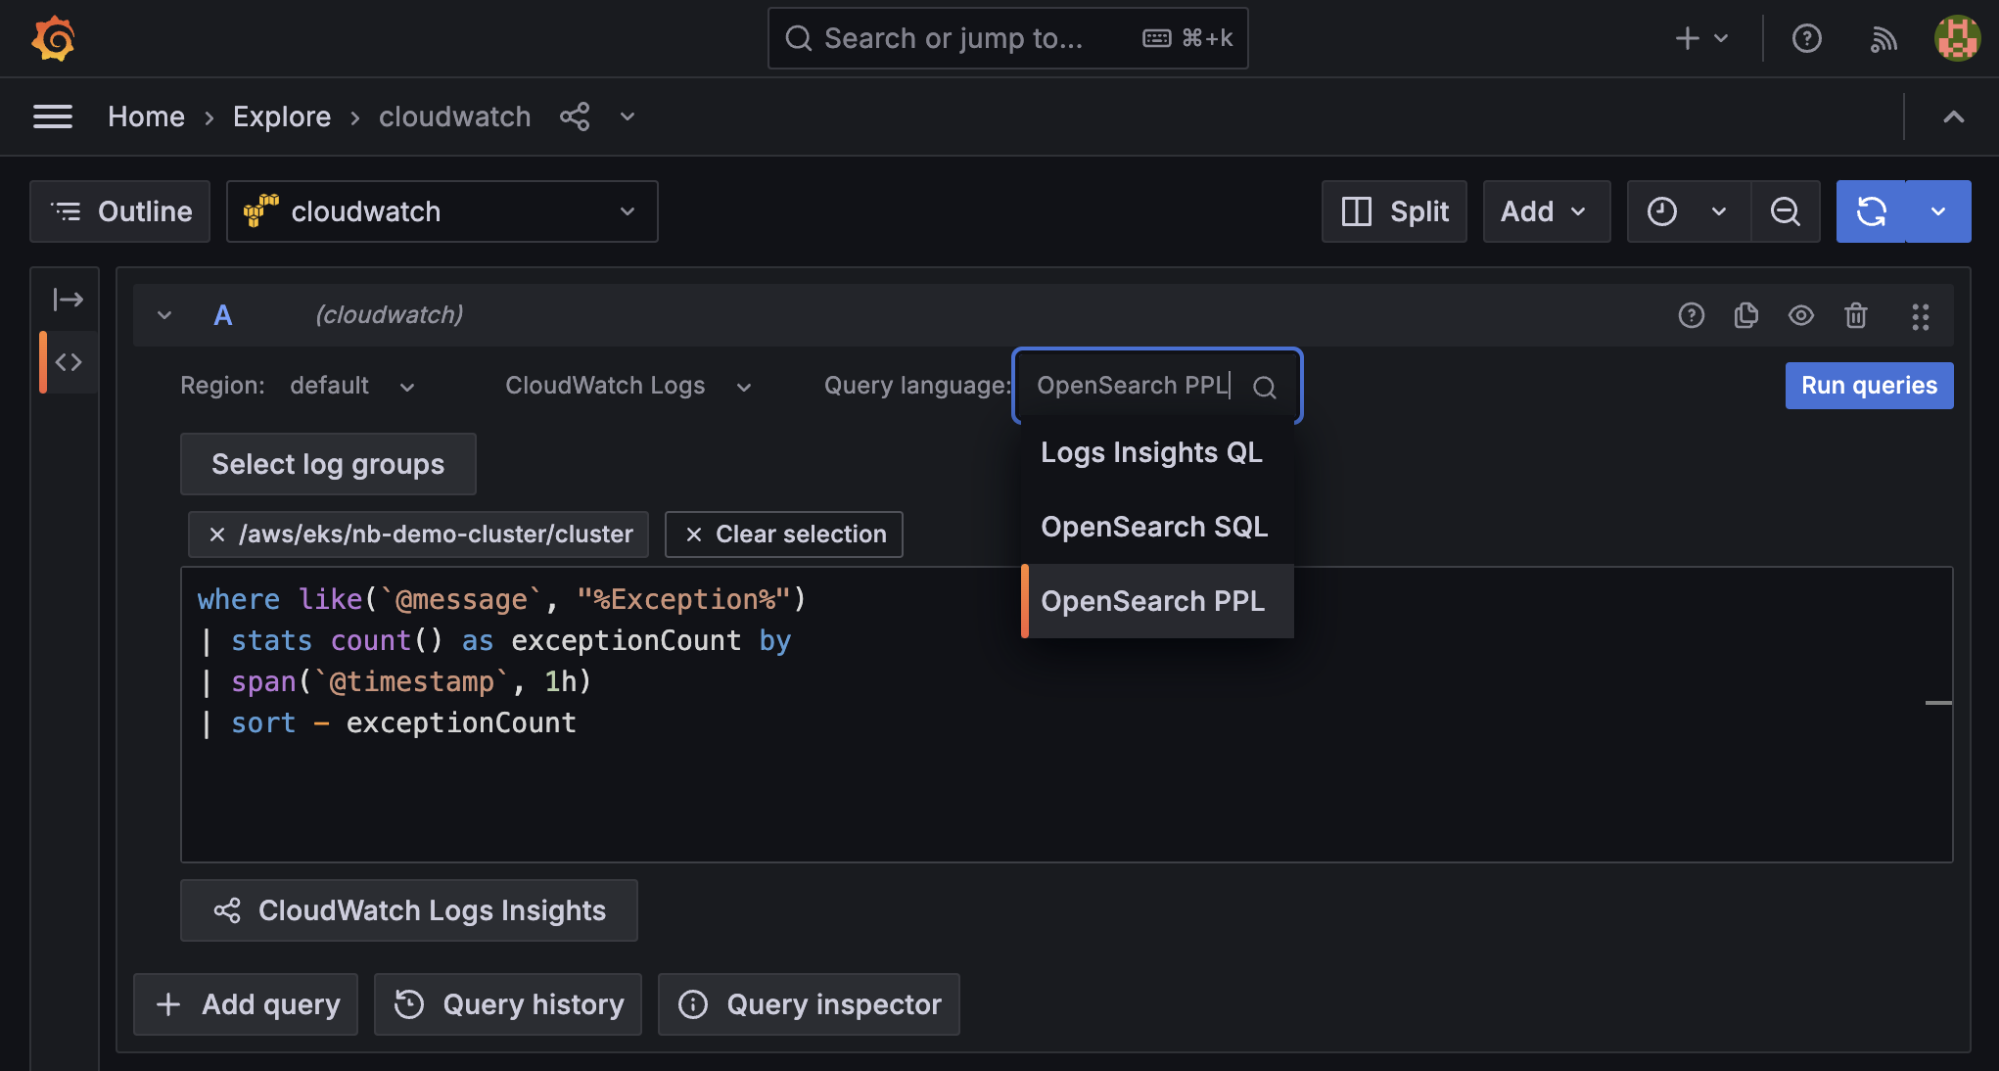
In addition to the already supported Logs Insights QL option, you can find the added query language options in the new Query language drop-down menu.
The following features are supported in the AWS CloudWatch data source plugin for both OpenSearch PPL and OpenSearch SQL:
- Syntax highlighting to improve readability of complex queries.
- Live code completion with suggestions of language-specific commands and functions depending on what you’re typing. This includes discovered fields based on your selected log groups.
- Sample queries in Logs Cheat Sheet that contain a number of example queries, which you can simply select to paste in the query field.
For the complete list of commands supported for OpenSearch PPL and OpenSearch SQL, refer to the AWS CloudWatch Logs Insights documentation.
Learn more about Grafana
For an in-depth list of all the new features in Grafana, check out our Grafana documentation, the Grafana changelog, or our What’s New documentation.
Join the Grafana Labs community
We invite you to engage with the Grafana Labs community forums. Share your experiences with the new features, discuss best practices, and explore creative ways to integrate these updates into your workflows. Your insights and use cases are invaluable in enriching the Grafana ecosystem.
Upgrade to Grafana 11.4
Download Grafana 11.4 today or experience all the latest features by signing up for Grafana Cloud, which offers an actually useful forever-free tier and plans for every use case. Sign up for a free Grafana Cloud account today.
Our Grafana upgrade guide also provides step-by-step instructions for those looking to upgrade from an earlier version to ensure a smooth transition.
A special thanks to our community
We extend our heartfelt gratitude to the Grafana community!
Your contributions, ranging from pull requests to valuable feedback, are crucial in continually enhancing Grafana. And your enthusiasm and dedication inspire us at Grafana Labs to persistently innovate and elevate the Grafana platform.
We’d love to hear your thoughts on the state of observability. Click the button below to take our annual Observability Survey today!

Grafana Cloud is the easiest way to get started with metrics, logs, traces, dashboards, and more. We have a generous forever-free tier and plans for every use case. Sign up for free now!

