
New in Kubernetes Monitoring: cost management, resource usage monitoring, and more
KubeCon + CloudNativeCon North America 2023 is just around the corner, and the OSS and cloud native community is eagerly anticipating the event, which will take place November 6 - 9 in Chicago.
For the uninitiated, KubeCon is the Cloud Native Computing Foundation’s flagship conference and is widely regarded as an annual gathering where engineers can reconnect with out-of-state and online friends, explore new technologies and vendors, and stay up-to-date with the emerging trends in cloud native technologies.
As always, one of KubeCon’s central themes is Kubernetes, and we are thrilled to share all of the exciting developments and advancements we have made in the Kubernetes Monitoring solution in Grafana Cloud.
We invite you to attend our KubeCon sessions led by Grafana Labs pros and visit us at booth C18. We’ll be ready to provide in-depth demonstrations, answer your questions, and of course, hand out some swag. We’ll also showcase the latest features outlined below for Kubernetes Monitoring in Grafana Cloud.
Kubernetes cost management with Grafana Cloud
It’s not uncommon for cloud costs to spiral out of control as Kubernetes fleets scale. To help manage your related bills, we recently introduced a new cost monitoring feature in Kubernetes Monitoring that provides a host of tools to help manage and monitor your Kubernetes spend.
Cost monitoring in Kubernetes Monitoring includes opinionated, out-of-the-box visualizations that help you easily identify cost-intensive components so you can reallocate resources in your fleet appropriately. It contains an overview tab that gives you a breakdown view of your cost attribution and a savings tab that provides actionable insights to help you lower your Kubernetes infrastructure costs.
By combining the cost monitoring feature, which is based on the open source tool OpenCost, with our resource utilization efficiency feature in Kubernetes Monitoring, you can gain real-time insights and more control over how available resources are utilized and the costs associated with each of them in your fleet.
Learn more in our blog post about cost monitoring in Kubernetes Monitoring in Grafana Cloud.
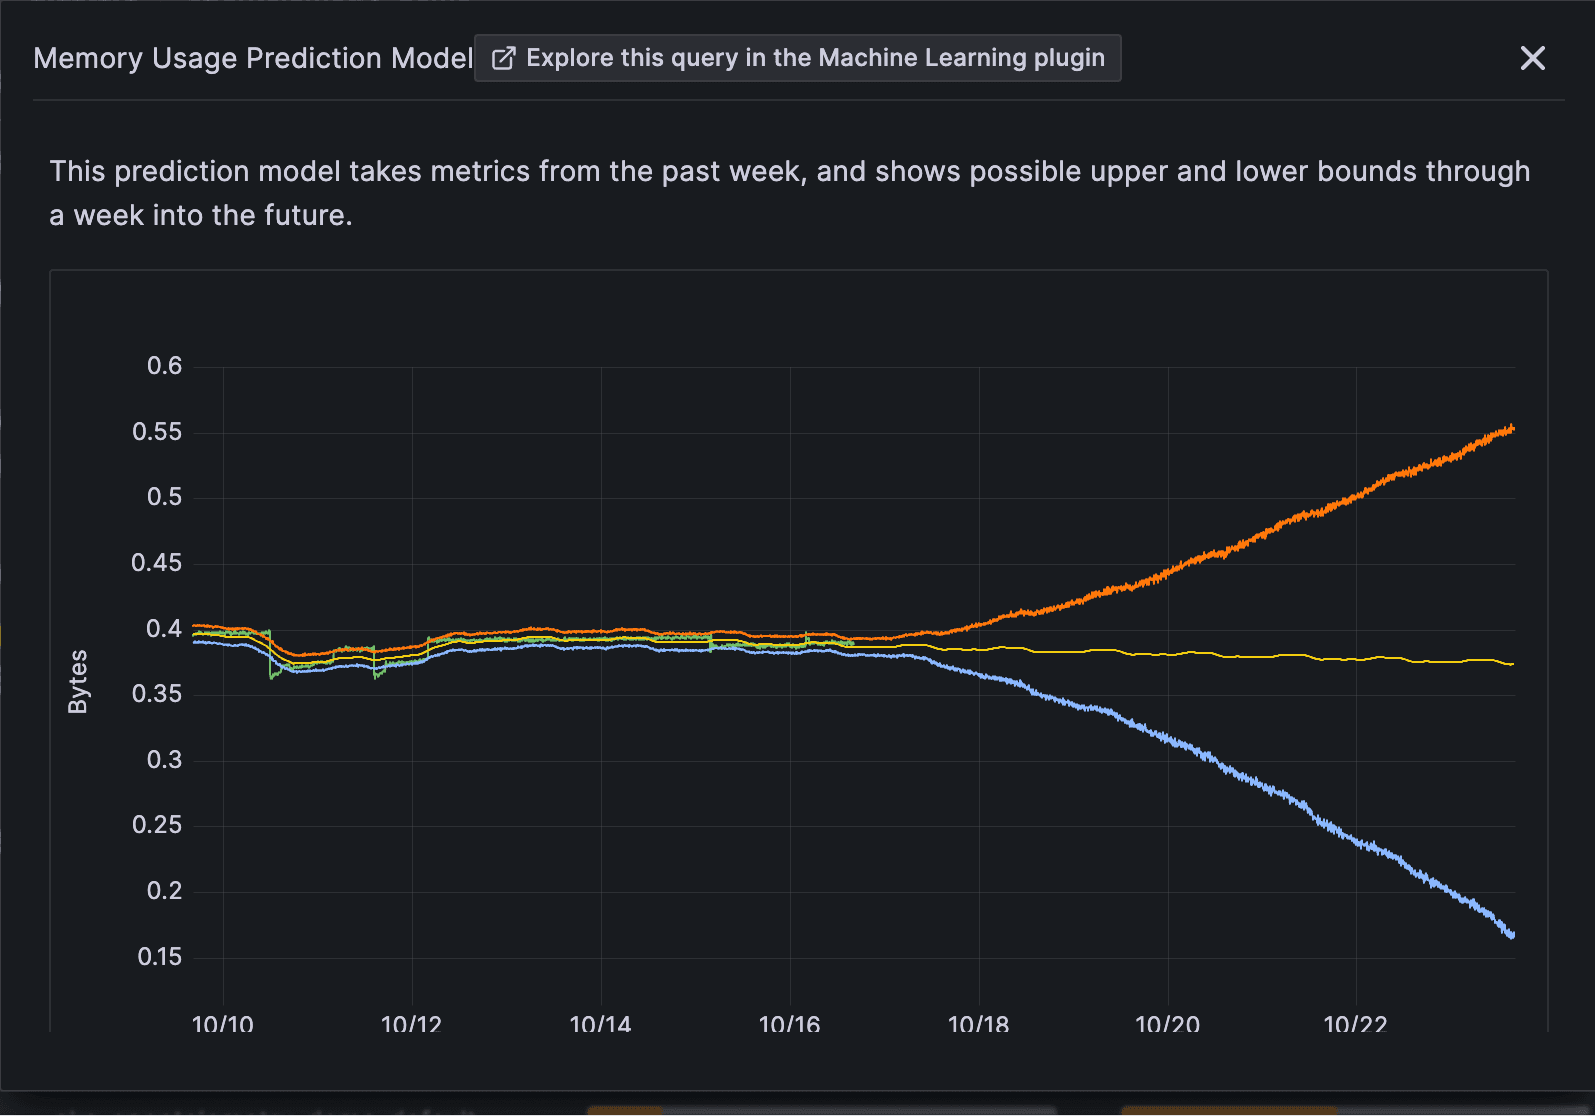
Predict CPU and memory usage in Kubernetes with Grafana Cloud
Machine learning (ML) is increasingly becoming a valuable tool in the monitoring toolkit. Kubernetes Monitoring offers out-of-the-box ML predictions for CPU and memory usage and can also identify CPU outlier pods. This equips users with the ability to anticipate potential resource issues before they directly impact mission-critical infrastructure or your bottom line.
Identify critical Kubernetes infrastructure issues at a glance
Navigating the vast volume of Kubernetes telemetry data can be overwhelming and reduce troubleshooting efficiency when systems experience performance issues. That’s why we’ve developed a comprehensive homepage in Kubernetes Monitoring that highlights the metrics that matter and helps clearly identify issues in your infrastructure, such as ContainerCreating, CrashLoopBackOff, ImagePullBackOff, PodInitializing. You can also identify capacity shortages for node PCU, persistent volumes, and storage.

Monitor services running in Kubernetes with Grafana Cloud
We’ve significantly expanded the number of integrations available in Kubernetes Monitoring that include prebuilt dashboards, scraping rules, and alerts to help you easily monitor the services running in your fleet. You can now access out-of-the-box monitoring for technologies such as Aerospike, Apache ActiveMQ, Cilium, CoreDNS, etcd, NGINX, GitLab, Apache Kafka, CockroachDB, Apache Cassandra, PostgreSQL, MySQL.
Learn more about Kubernetes Monitoring in Grafana Cloud
Through continuous monitoring and optimization, you can eliminate unnecessary spending, improve efficiency, and maximize your return on investment. With Kubernetes cost monitoring, you can take control of your budget and implement proactive alerting mechanisms to make data-driven decisions about resource allocation, scaling strategies, and technology investments.
To learn more about Kubernetes Monitoring in Grafana Cloud, visit our solutions page or watch our Kubernetes Monitoring out-of-the-box with Grafana Cloud webinar on demand.
If you’re not already using Grafana Cloud — the easiest way to get started with observability — sign up now for a free 14-day trial of Grafana Cloud Pro, with unlimited metrics, logs, traces, and users, long-term retention, and access to all Enterprise plugins.

