
Monitoring smart city IoT devices with Grafana and Grafana Loki: Inside the Fuelics observability stack
For smart cities of the future, monitoring infrastructure metrics like fuel and water levels is vital to optimizing operations. Fuelics PC designs and deploys battery-operated narrowband IoT (NB-IoT) sensors that monitor fuel, water, waste, and even parking capacity at the edge, then transmit that data to the cloud for easy viewing and monitoring.
In their recent GrafanaCONline 2022 talk titled “Monitoring battery-operated NB-IoT sensors with Grafana and Grafana Loki,” (available on demand now) Fuelics Partner and Head of Cloud and Platforms Ioannis Nikolau and Operations Engineer Marios Klavdianos shared how their team uses Grafana Loki to gather observability data from their NB-IoT sensors and Grafana dashboards to visualize that data as well as measurement insights for their clients.
Retrieving IoT observability data with Grafana Loki
Fuelics’ sensors provide reliable, flexible data collection at the edge. They can be utilized in areas that are hard to access or don’t have power supply – for example, a fuel tank in the desert or a water logger inside an underground manhole. In addition to gathering measurement data from each sensor, the Fuelics team, which is based in Greece, also collects data to monitor device health, network status, and measurements. “This is critical information we need to have to monitor the devices, which in the case of a smart city deployment, could be up to thousands of sensors,” said Nikolau.
The data is captured in the sensor, processed by their firmware, and sent through the narrowband to the cloud. “We were looking for a deployment-agnostic way to collect all this information, mainly for observability, while at the same time keeping the flexibility that supported all our project business requirements,” said Nikolau. That’s what led them to Grafana Loki.
With Grafana Loki pipelines, the Fuelics team can parse the logs generated by each sensor as the data is transmitted from edge to cloud. The process is highly asynchronous, so they take advantage of the ability to adjust data time stamps in Grafana Loki, ensuring that data is stored in the proper time series order. To optimize data storage, they use the lowest cardinality possible during parsing to include only the necessary information for data streams. “And at the Grafana dashboard level, we make extensive use of regular expressions and transformations to create the structure that is required for visualization through dashboards,” said Nikolau.
All of this allows the team to efficiently collect observability data from thousands of sensors at the edge and funnel it into the cloud for visualization via Grafana dashboards.
Leveraging Grafana dashboards to unify observability data
The Fuelics team utilizes a variety of Grafana dashboards to visualize measurements, track device metrics like battery life and capacity, and cross-check events to ensure accuracy and monitor sensor health.
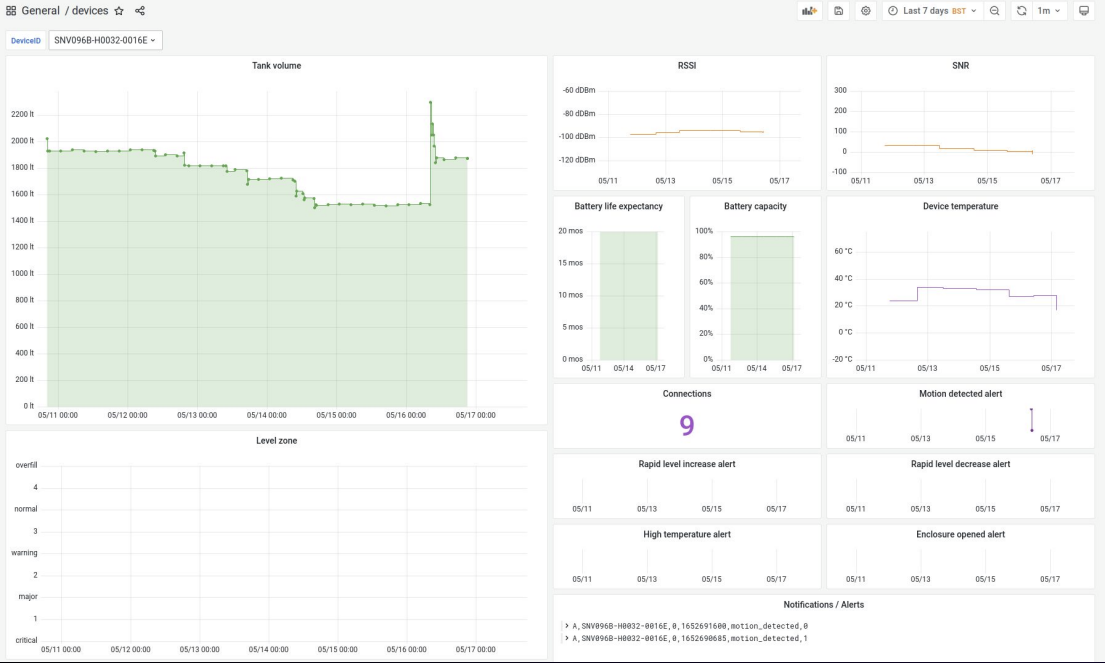
One of the most valuable features of these Grafana dashboards is the ability to cross-relate events between the panels. For example, if there’s a spike in the motion detection alert panels, they can correlate the info with another data point like fuel level. This confirms that the tank has been refilled. “That’s how we actually double-check the successful implementation of the calibration parameters and the correctness of the measurements before we send them to the web app to be viewed by our client,” said Klavdianos.
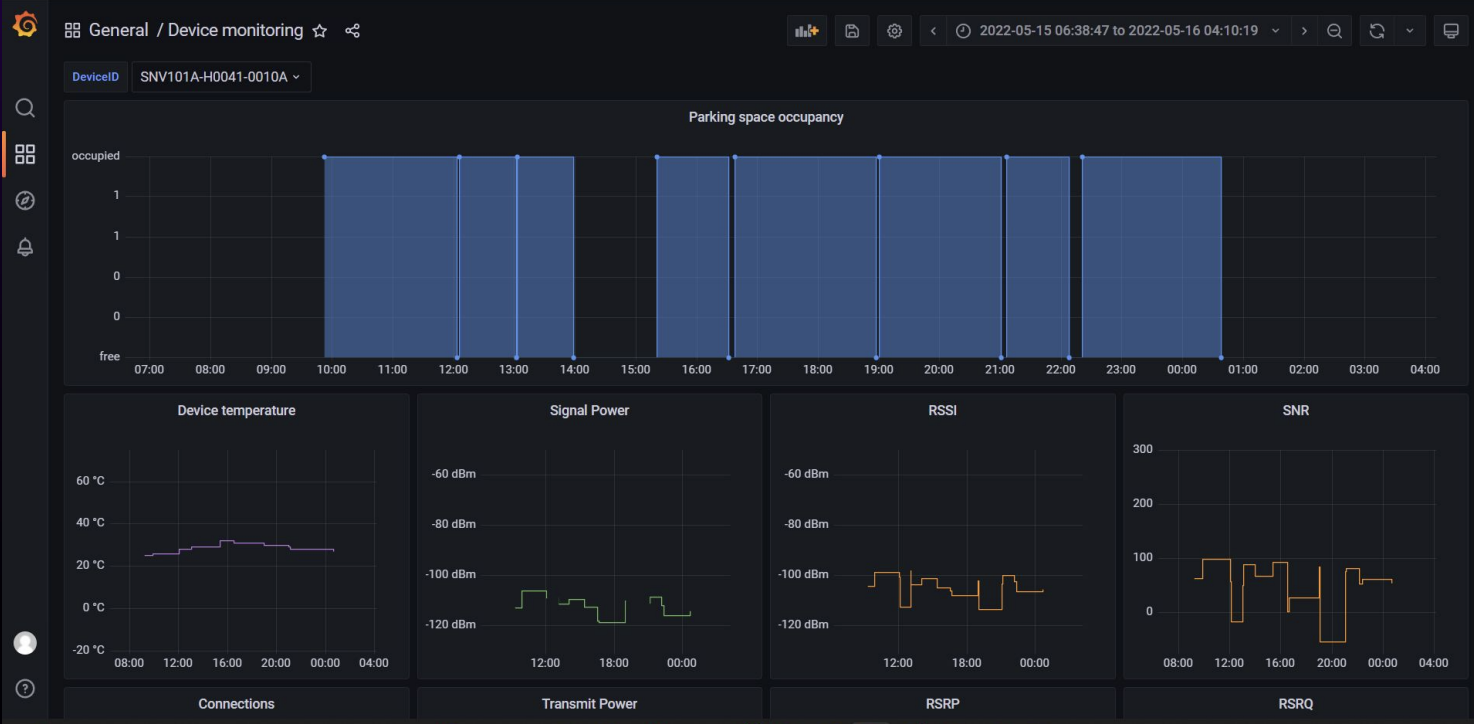
Because they are able to collect so much data via Grafana Loki, each dashboard can display many data points over a seven-day time period for each sensor. The data is then simplified for clients and shared via a web application to provide accurate measurements and deliver insights on the resources being tracked. Grafana, said Klavdianos, “is a very useful way for us to frequently check the measurement correctness, accuracy, and generally monitor each sensor’s behavior.”
Watch the full session to learn how Fuelics manages large sensor deployments with Grafana dashboards. All our sessions from GrafanaCONline 2022 are now available on demand.


