New in Grafana 9: Introducing the command palette
Grafana is an open source tool for people with many different perspectives and various skill levels. Many initiatives to improve the Grafana user experience start by thinking about someone who’s just getting started on their observability journey. However, late last year, a Grafana Labs hackathon team looked to improve the user experience for our power users by introducing a command palette to Grafana.
What is a command palette?
If you’re not familiar with the command palette, it’s a feature available in many applications that allows the user to perform various actions with a few keystrokes. In code editors, programmers can use it to go to different files or perform simple tasks without taking their hands off the keyboard. On some websites, a command palette can be used to navigate to different areas or do other tasks that are usually performed by clicking menus or buttons. Command palettes make work more efficient for people who need or prefer to keep their hands on the keyboard.
Command palette in Grafana 9
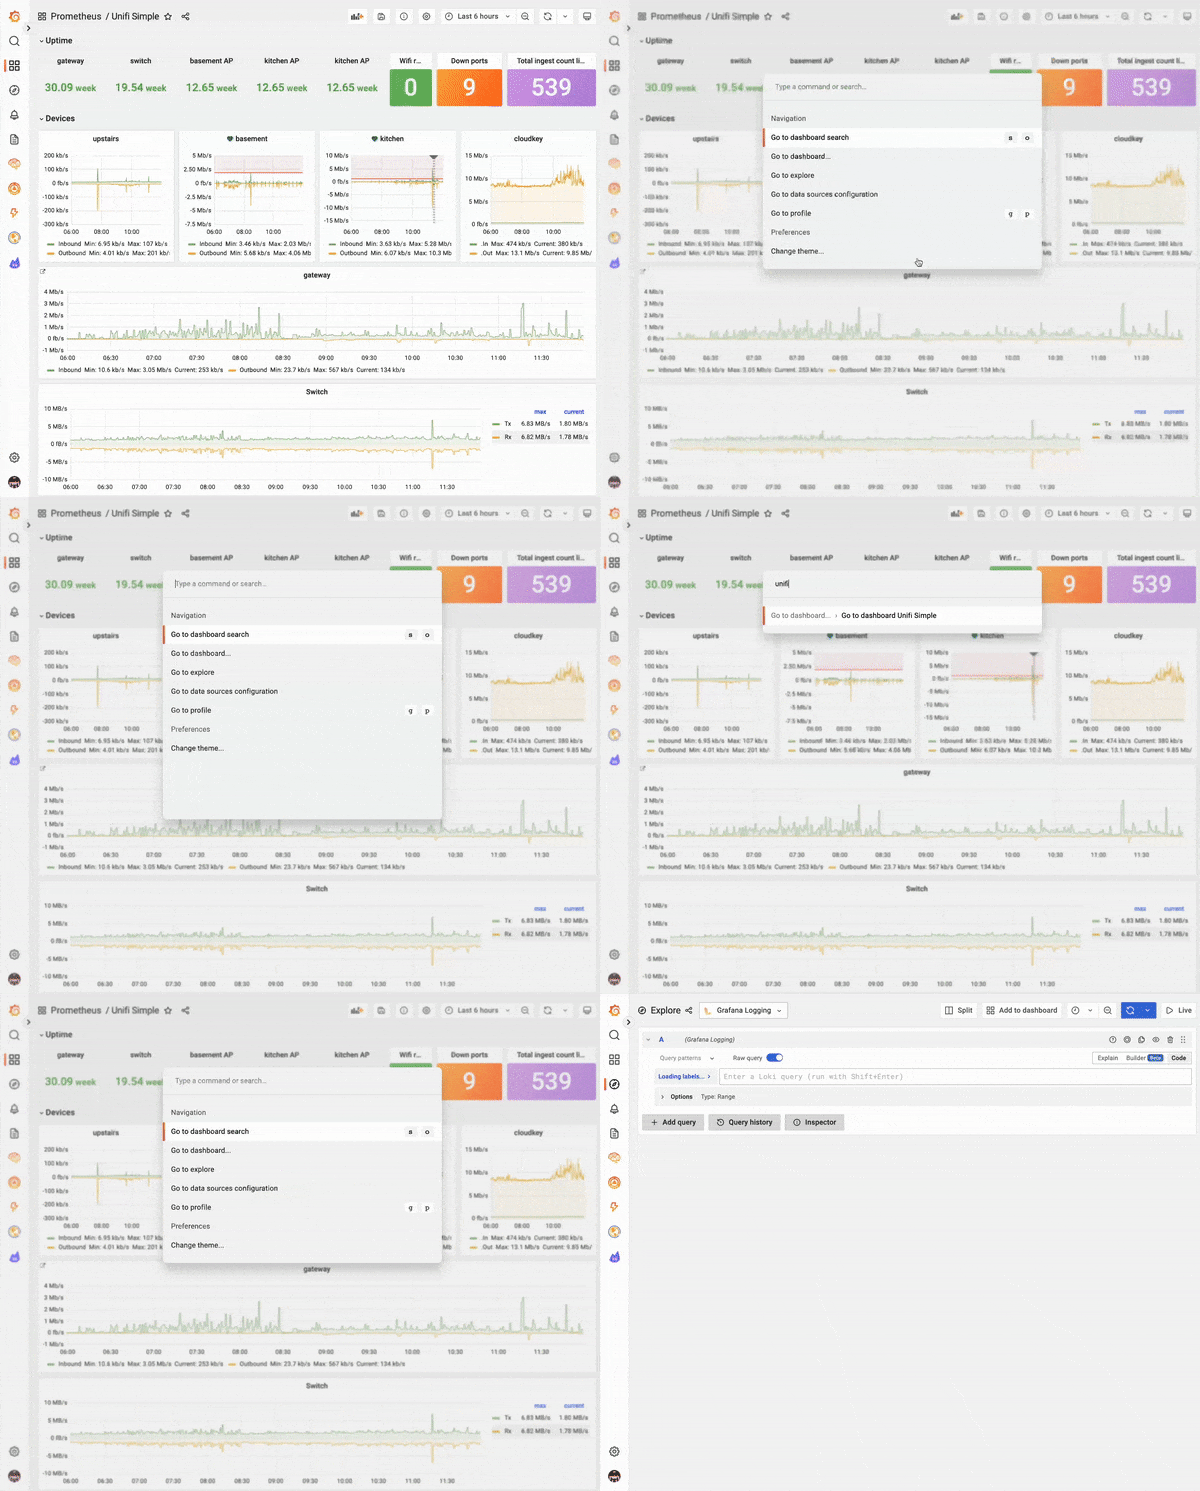
With the release of Grafana 9, we introduced a command palette with fairly basic features — simply press cmd+k in macOS or ctrl+k in Linux/Windows to see it for yourself!

From the pop-up menu, you can navigate to various areas as well as search, open, and create dashboards and folders.

In the Explore section, you can open and close the split view, as well as run queries — all with a few keystrokes.

There are plenty of areas that we can build out and lots more features to add, but we wanted to get the command palette out there quickly for teams to get their hands on it (and on their keyboards). We’re super excited to add a whole new way for users to make the most out of Grafana!
Learn more about Grafana 9
The Grafana 9 release introduced a host of new features and functionalities, such as navigation and search improvements, new Prometheus and Grafana Loki query builders, as well as security updates. To learn more about the latest stable release, check out our latest Grafana documentation or watch our recent “Deep dive into Grafana 9” from GrafanaCONline 2022, available on demand now.
Grafana Cloud is the easiest way to get started with metrics, logs, traces, and dashboards. We have a generous free forever tier and plans for every use case. Sign up for free now!


