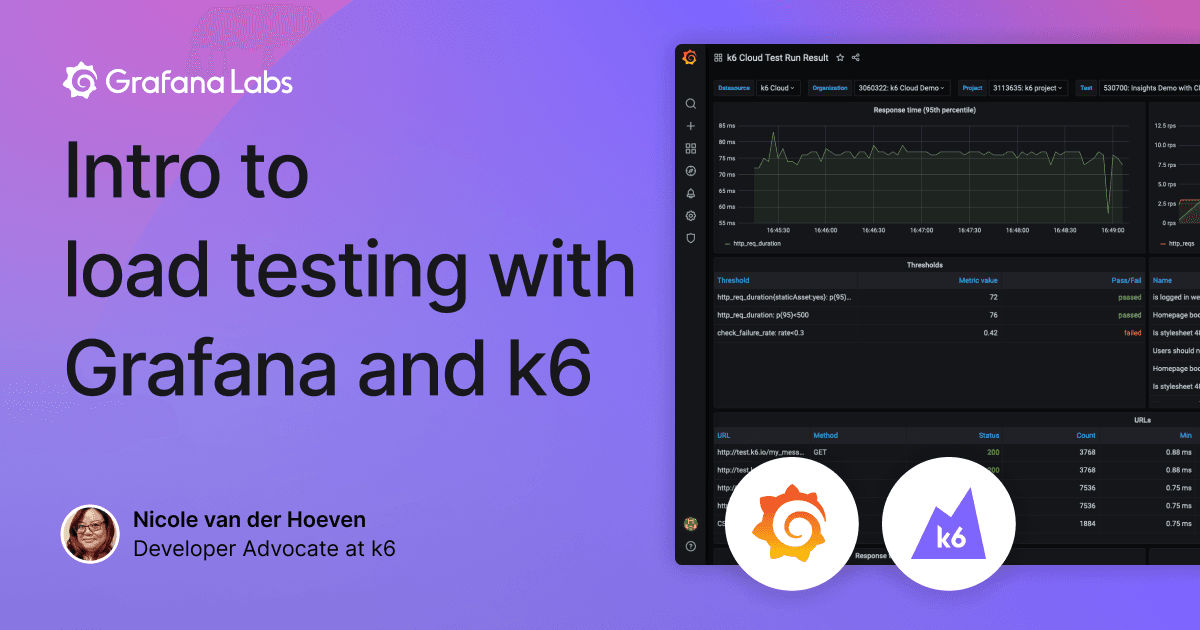
Learn how to get started with k6 load testing and Grafana in this week’s live webinar
Interested in learning about load testing? Join us for our next live webinar, “Intro to load testing with Grafana and k6,” on Sept. 16 at 9:30 PT / 12:30 ET / 16:30 UTC.

Observability tools give you better insight into application performance in production. Load testing is the other half of the observability puzzle, giving you quality data to test for application performance before going live and highlighting performance issues before it’s too late to fix them
In this webinar, Developer Advocate Nicole van der Hoeven will give an overview of k6, a load testing platform for modern engineering teams. You’ll get a live demo of how to create in minutes a load testing script that is realistic enough to make your test environments more production-like. Then we’ll go over your options for integration with Grafana and Prometheus, so your load test results can be seen wherever your team is already looking. By the end of this webinar, you’ll understand how to use k6 to run thousand-user load tests from different geographical regions on the cloud, and how to use Grafana to make sense of all the results.
Register now for the webinar. You can alsofind out how Grafana Labs uses k6 internally in this blog post.


