How the FourthDown NFL play-by-play API measures its performance with Prometheus, Jaeger, and Grafana Cloud
Pratik Thanki is a Software Engineer at Trayport, developing tools and features purpose-built for the energy trading markets. In this blog post, he takes a deep dive into his passion for football through his NFL play-by-play API, FourthDown, and shows how Grafana Cloud is central to his observability stack.
About FourthDown
FourthDown is an API that allows data-obsessed NFL fans to access all sorts of information, from schedules and team details to play-by-play game data and players’ combine workouts.
The motivation behind developing this API was to create a language-agnostic tool for accessing play-by-play data, as existing tools/libraries cater to Python/R users. (The API leverages data from the open source R package, nflfastr.) The FourthDown API, which is organized around the HTTP REST protocol, has predictable resource-oriented URLs, returns JSON-encoded responses, and uses standard HTTP response codes and verbs.
Most endpoints share the same set of base query parameters: GameId, Season, Team, and Week. This API is documented in OpenAPI format and supported by a few vendor extensions.
On the back of the announcement of a new free plan earlier this year, I was excited to use Grafana Cloud to monitor FourthDown.
So excited to monitor my nfl play-by-play api! 🏈 https://t.co/Y1jDBHs5WZ
— Pratik Thanki (@pratik_thanki) January 16, 2021
The API is designed with observability in mind, and leverages the powerful capabilities of Prometheus and Jaeger. My prior experience with these tools helped me integrate them faster to collect monitoring data.
From a technical perspective, the API is designed and built on ASP.NET Core and utilizes the Repository Pattern. The overall architecture of the API is described below.


Pratik (left) and his brother at Twickenham Stadium for the NFL London Games (Arizona Cardinals @ Los Angeles Rams).
Observability principles
Application observability was designed with three key components in mind:
Logging: information about events happening in the system, which can vary from instances of throwing out-of-memory exceptions and app configuration on startup not reflecting expected values. Useful for getting a complete understanding of what has occurred in the system.
Tracing: information about end-to-end requests received by the system. A trace is similar to a stack trace spanning multiple applications. Traces are a good starting point in identifying potential bottlenecks in application performance, such as asynchronous web requests, serialization, or data processing.
Metrics: real-time information of how the system is performing. KPIs can be defined to build alerts, allowing for proactive steps when performance degrades. Compared to logs and traces, the amount of data collected using metrics remains constant as the system load increases. Application problems are realized through alerting when metrics exceed some threshold. Examples include CPU usage being higher than before, increase in 5xx requests or average response times.
Findings
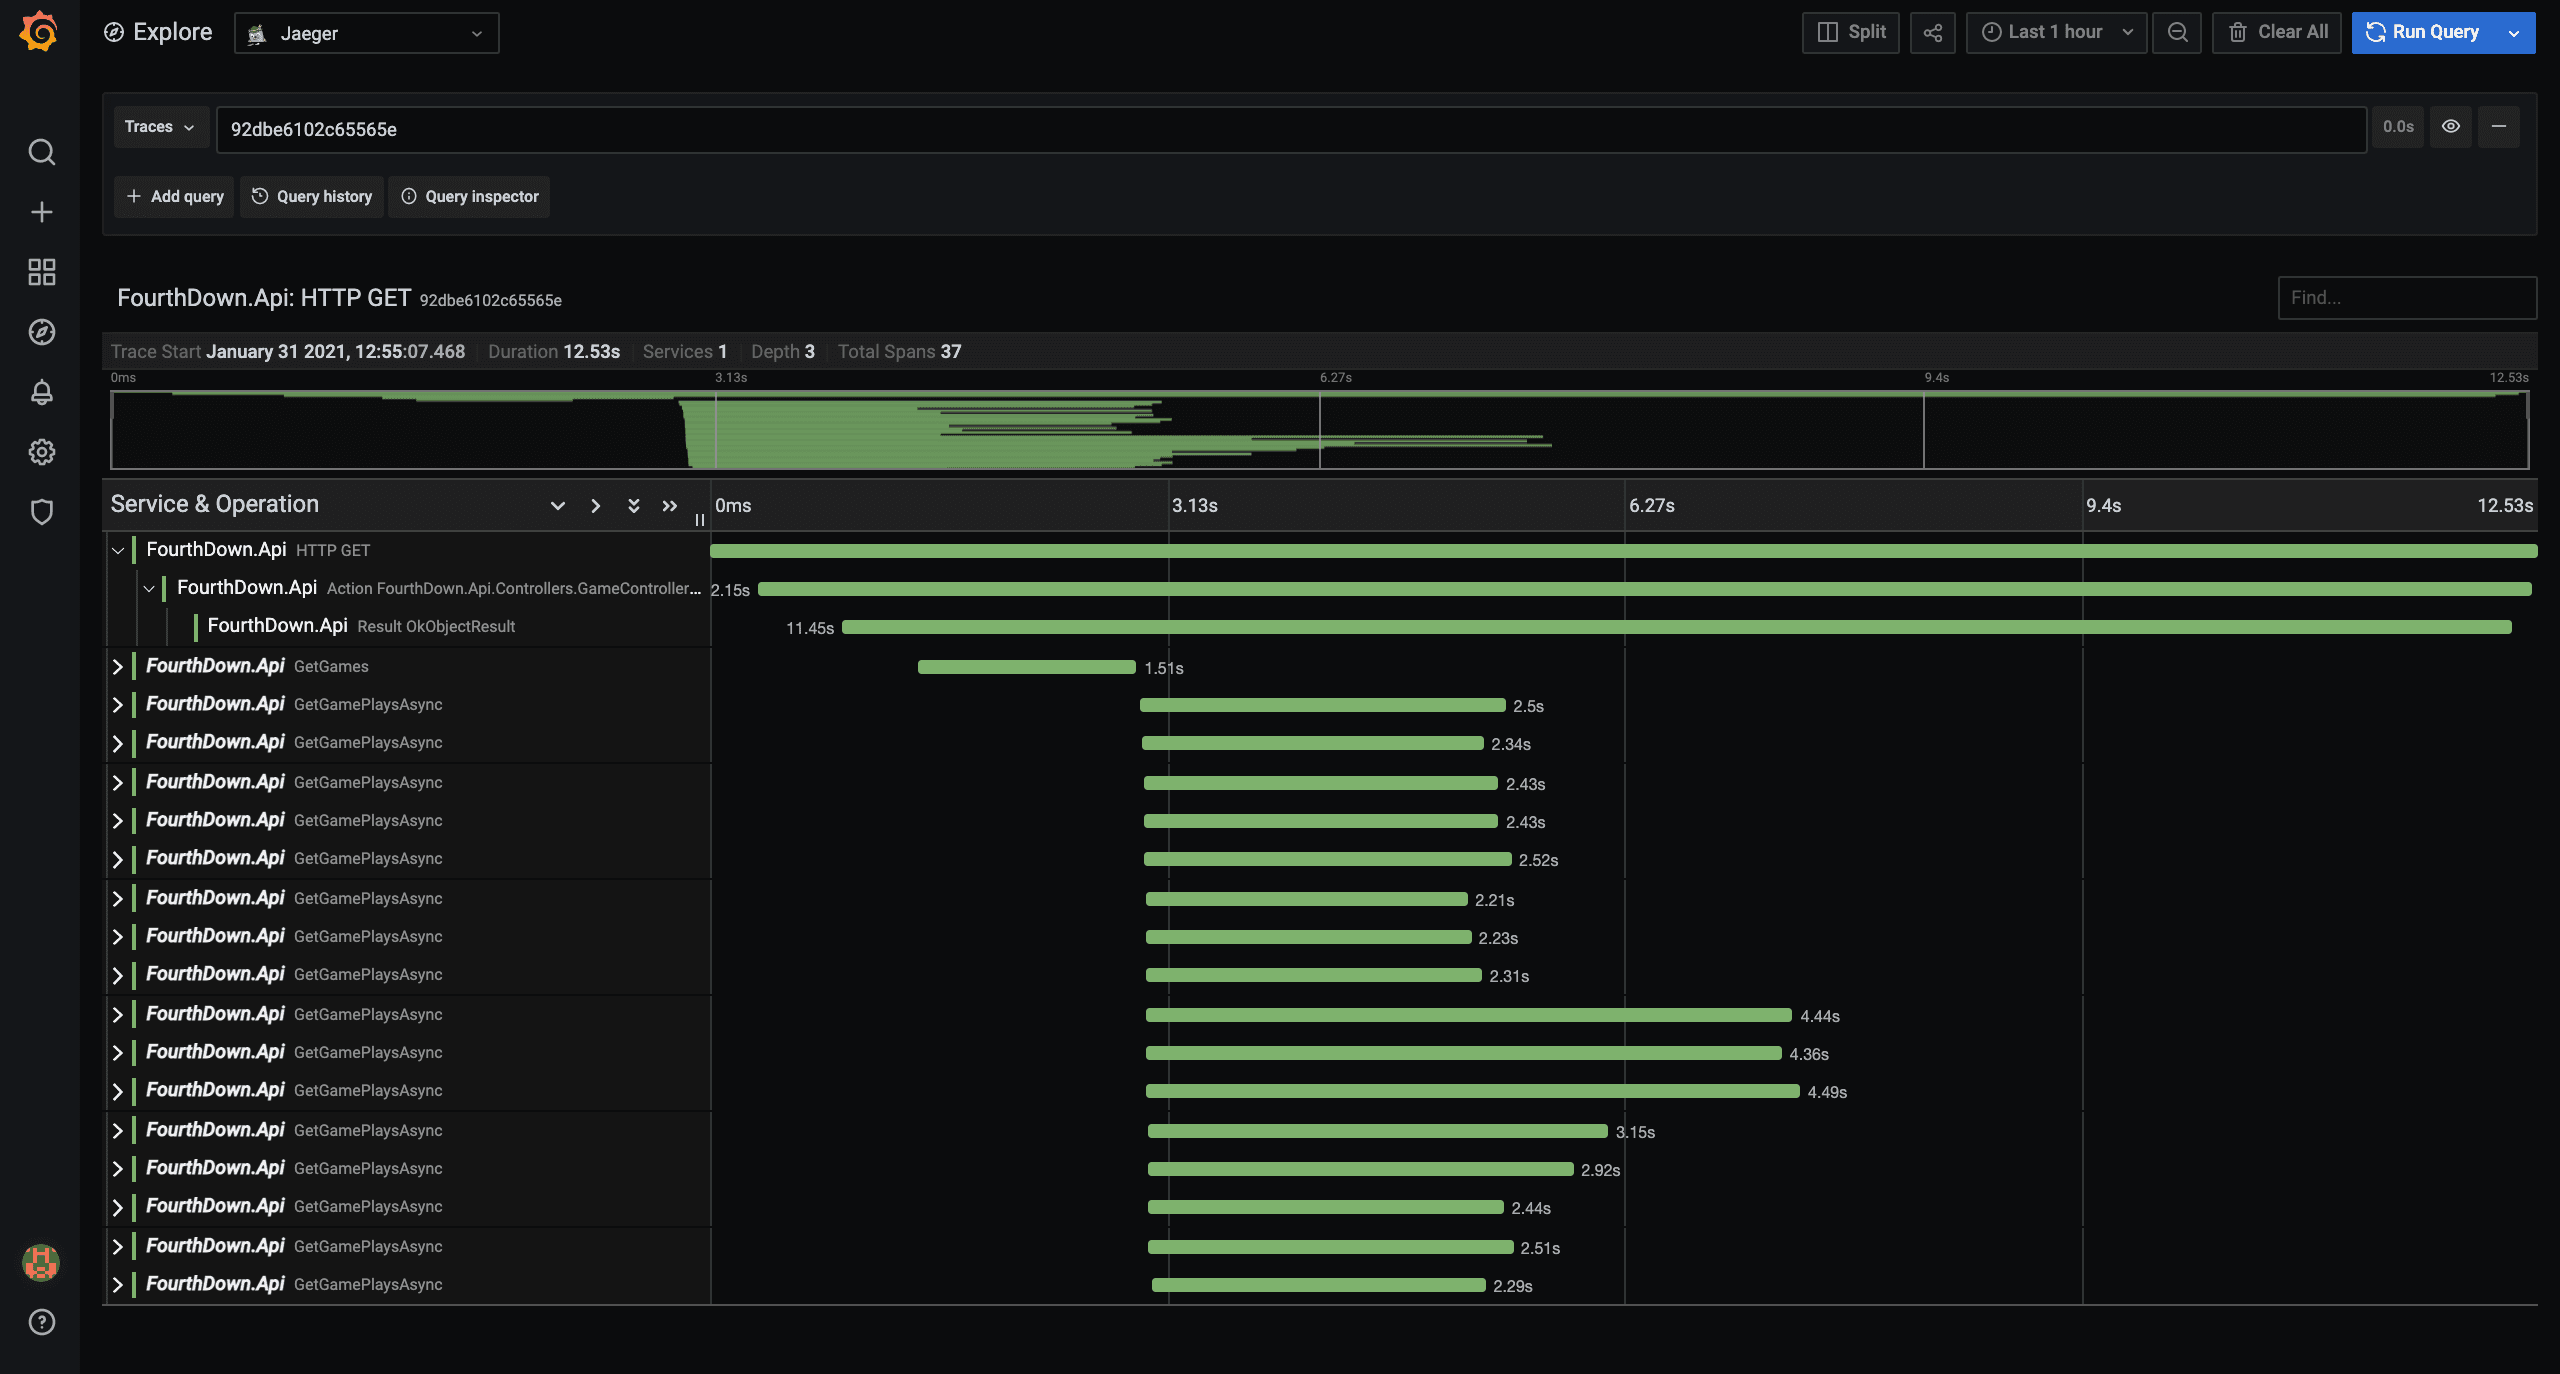
After we went live with the monitoring capabilities, it was evident that API performance was sub-optimal. This was easy to spot with Jaeger. Here’s an example trace of synchronous HTTP web requests:

Quickly finding this bottleneck that was directly impacting end-user performance was a big win. In this case, improving how multiple HTTP web requests were being sent saw a five-fold improvement in response times. We get the following trace with this change:

The Grafana-Jaeger integration view:

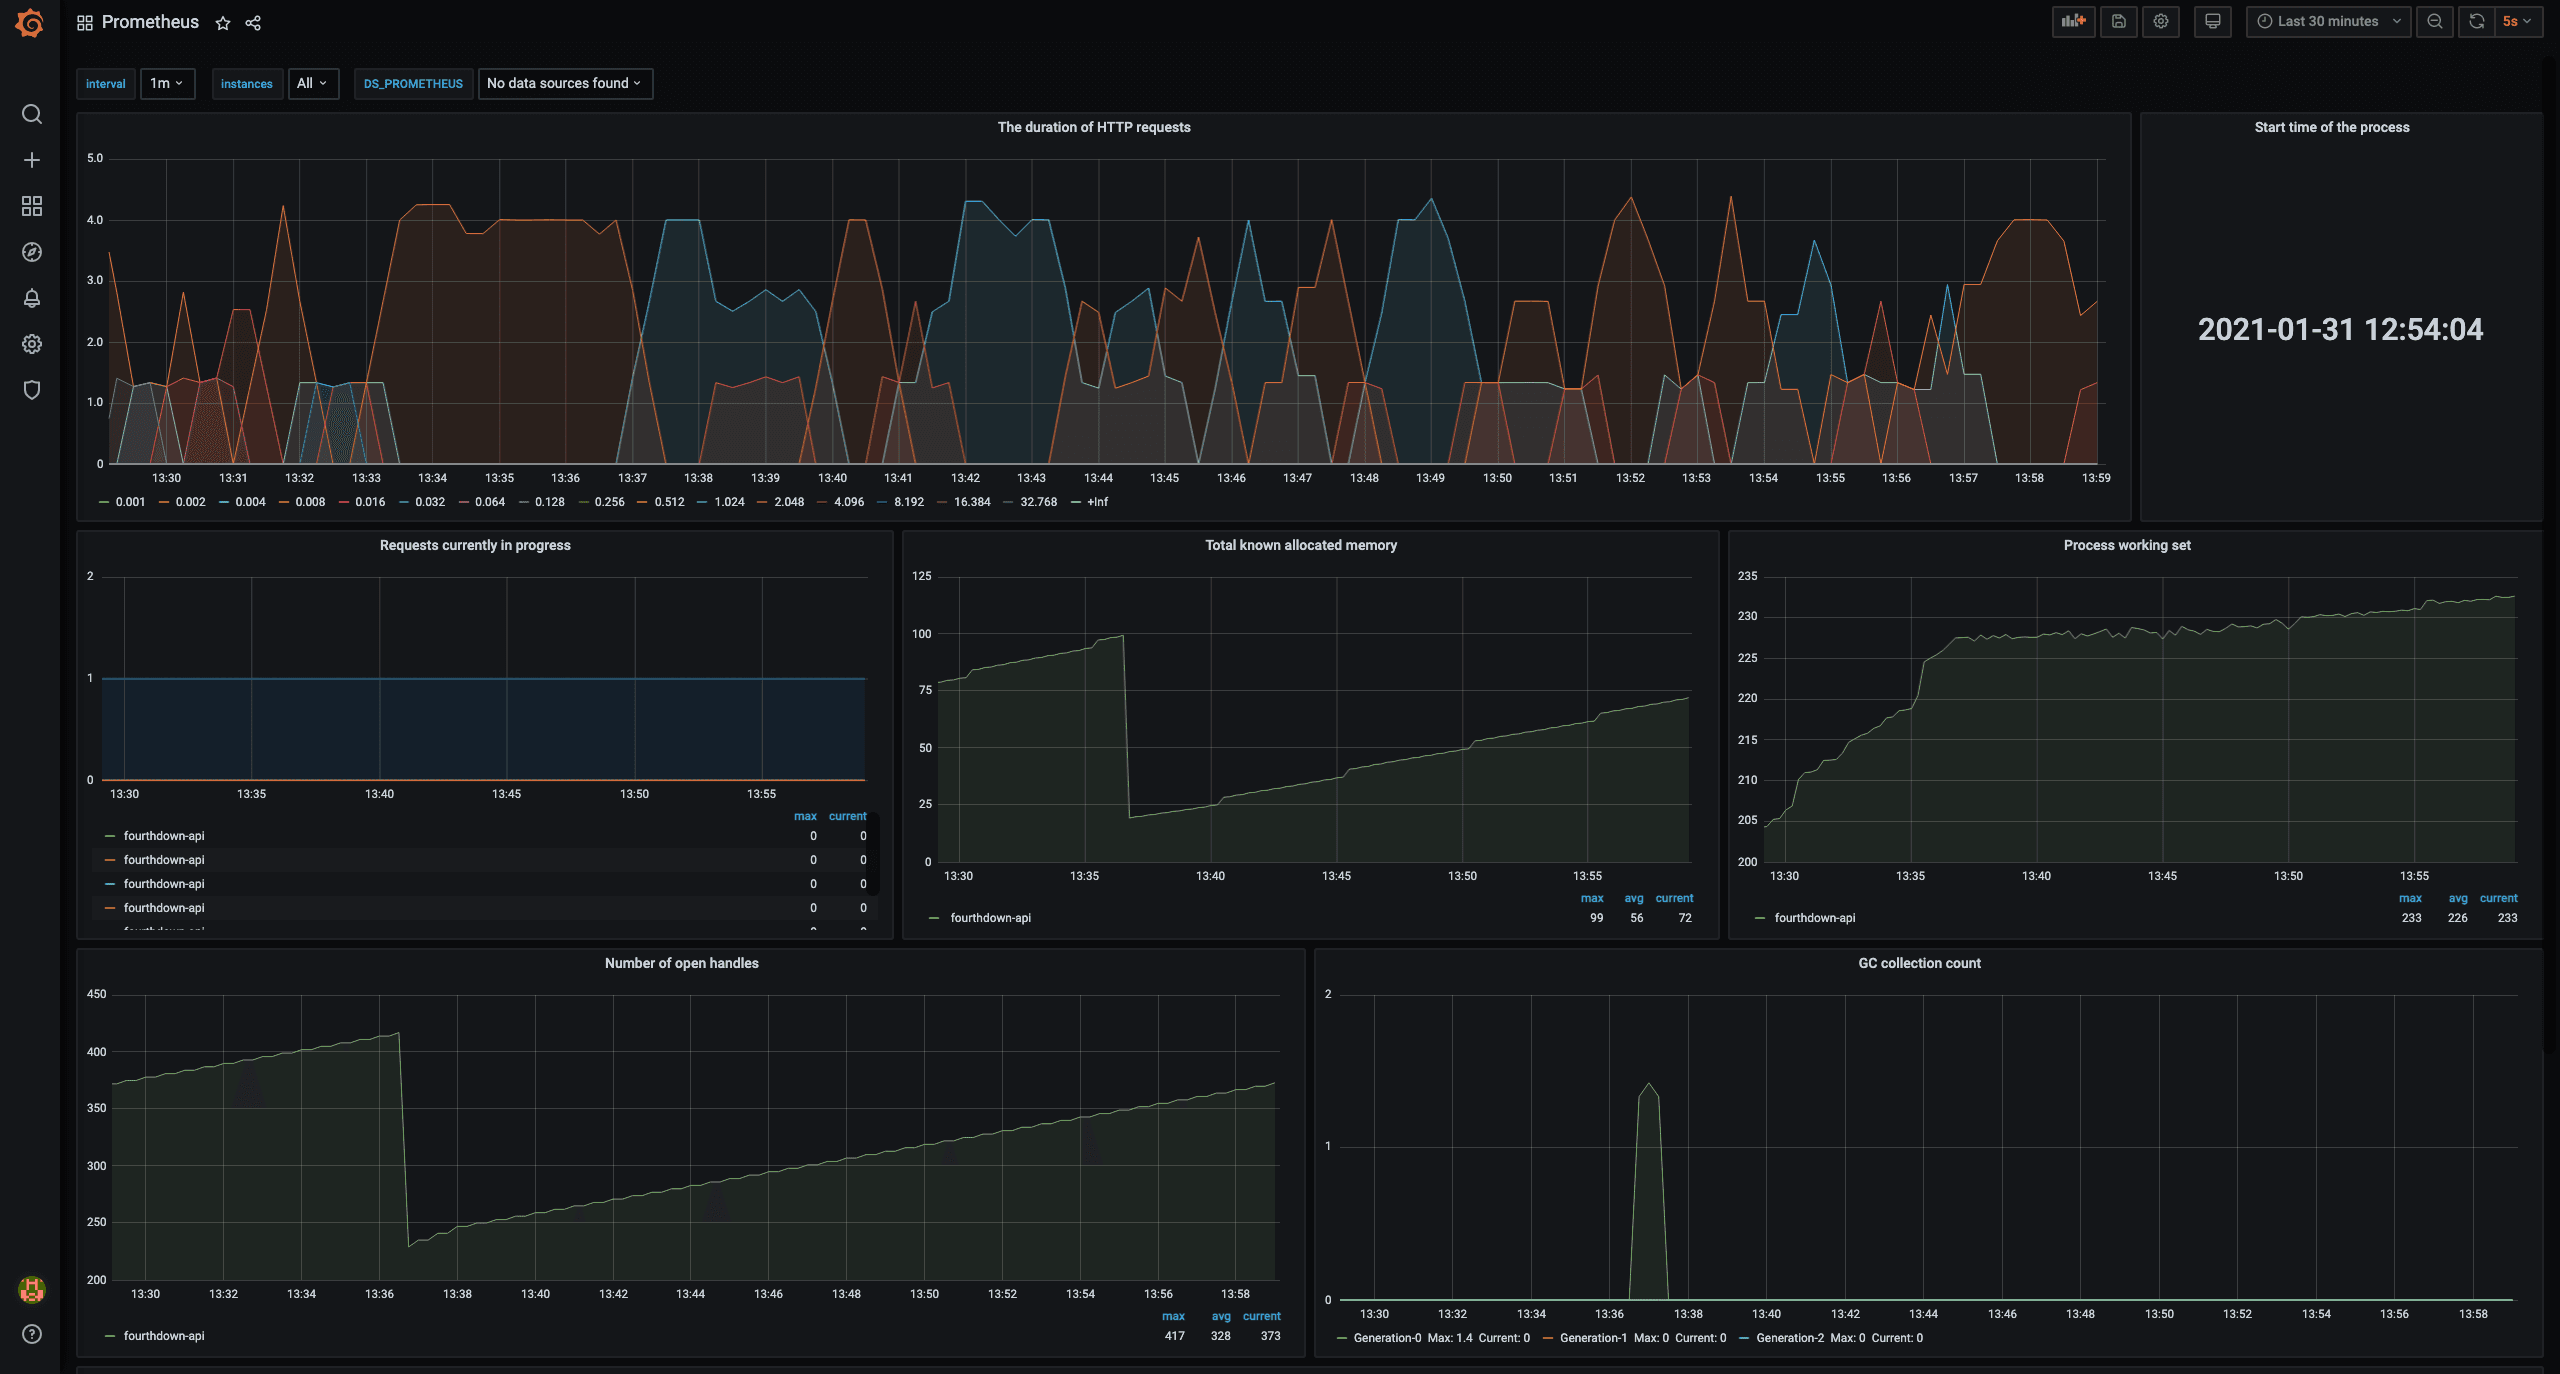
Monitoring the state of the API:

Conclusion
Getting started with Grafana Cloud inspired me to look further into other aspects of monitoring, and I now appreciate the open source observability ecosystem — Prometheus, Jaeger, and Grafana, not to mention other frameworks and libraries I didn’t use for this project.
Next up, I want to expand my use of Grafana Cloud with Prometheus-based alerting to move towards proactive monitoring and incorporate application logging with Loki.
If you’re interested in using the FourthDown API, getting started with any language is super simple. You can check out this post with code snippets, FourthDown API Samples, or the FourthDown API docs.


