
Learn all about Grafana plugins and Loki logging configuration at two webinars this week
We hope you’ll join us this week for two webinars featuring Grafana Labs technical experts. Sign up to attend live or to receive a link to watch the recording on demand another time.
Logging with Loki: Essential configuration settings
July 21, 2020 @ 9:30 AM PT / 12:30 PM ET/ 18:30 CET
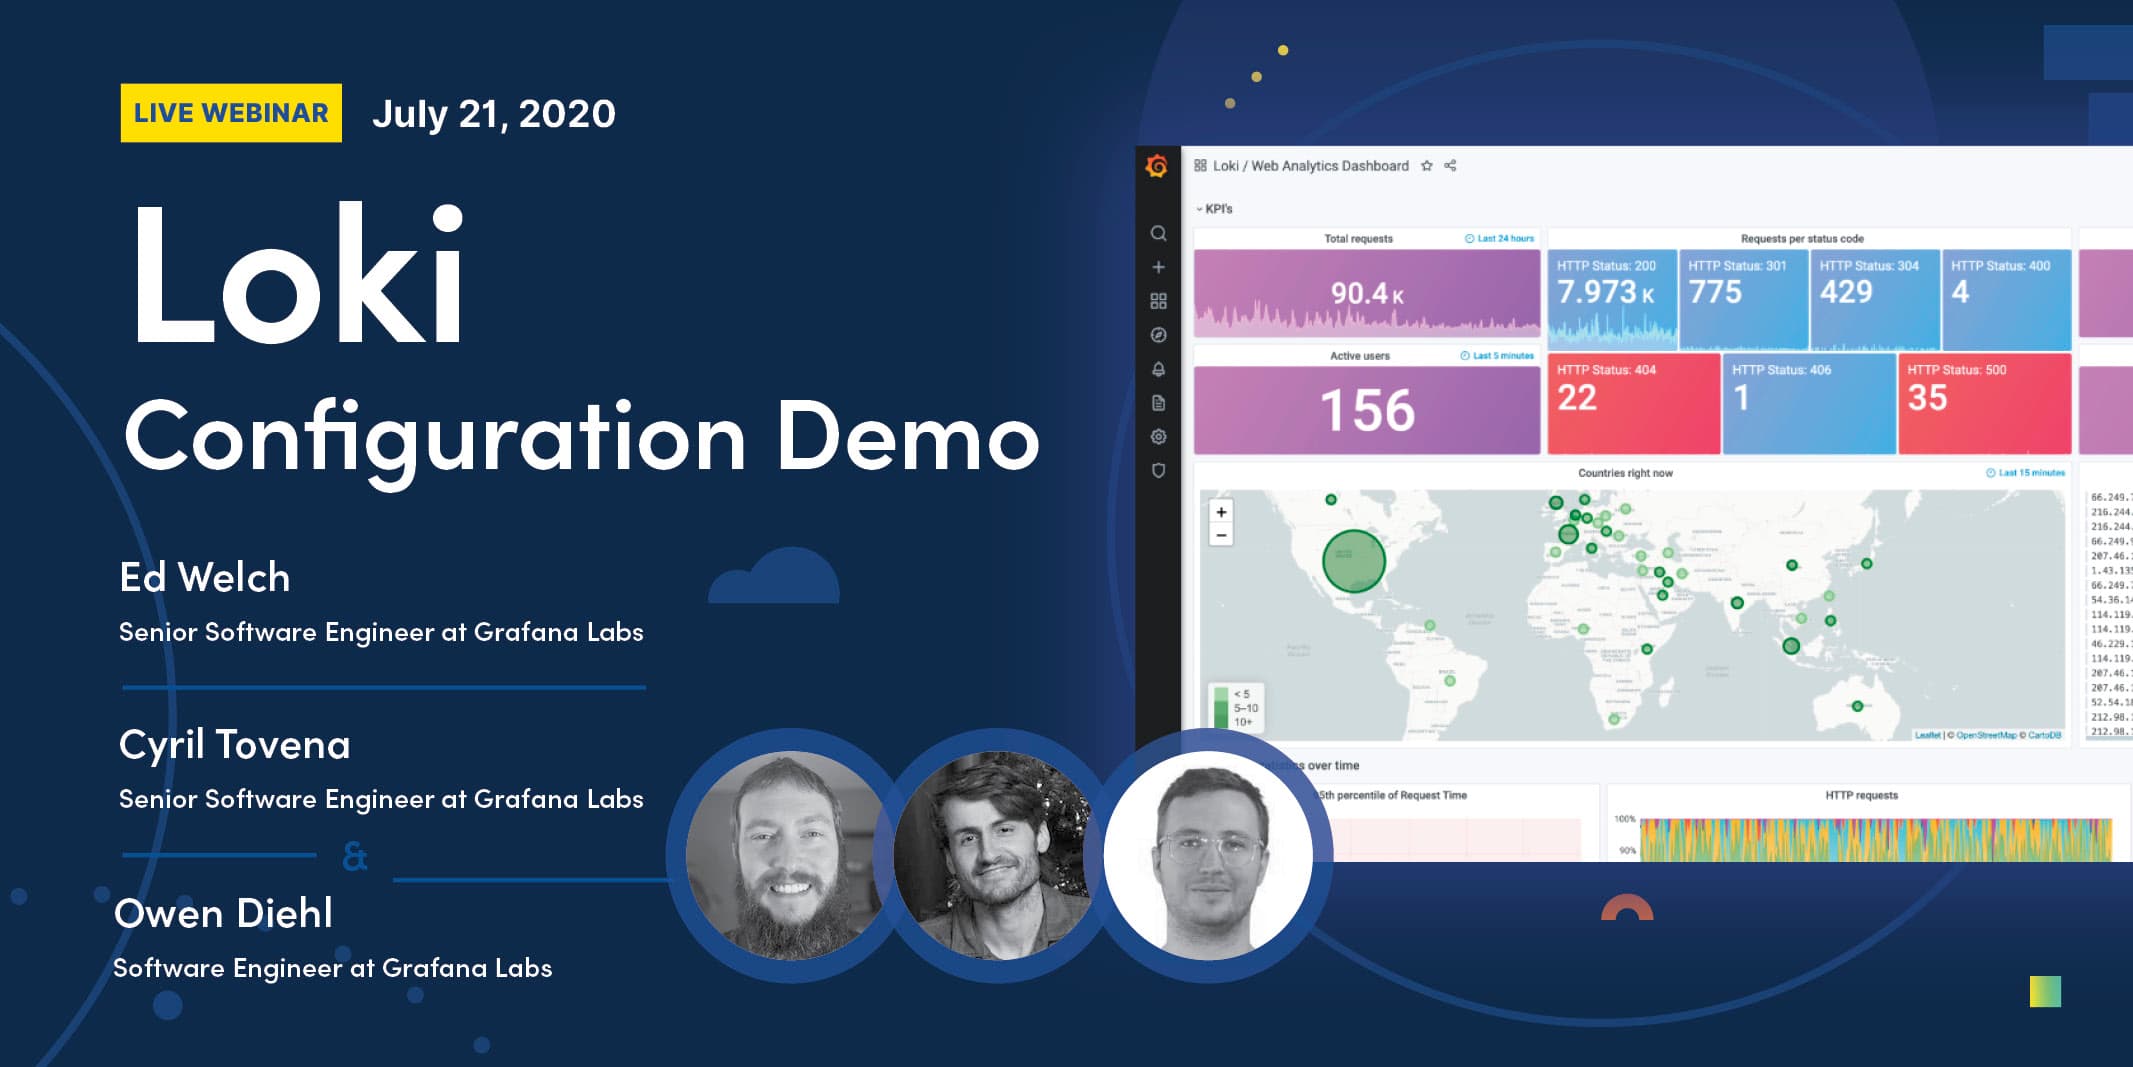
Led by Loki project maintainers, this webinar picks up where they left off at the end of the Intro to Loki webinar. Watching the introductory webinar ahead of time is highly recommended, as the session will dive right into how to set up and configure:
- Promtail and Docker driver, Loki’s most popular agents;
- the Loki server, including the most common and important configuration settings; and
- Loki storage for a few of the most popular storage backends.
Register for the Loki configuration webinar here.
All about Grafana plugins: Visualizing disparate data sources in one place
July 22, 2020 @ 9:30 AM PT / 12:30 PM ET/ 18:30 CET
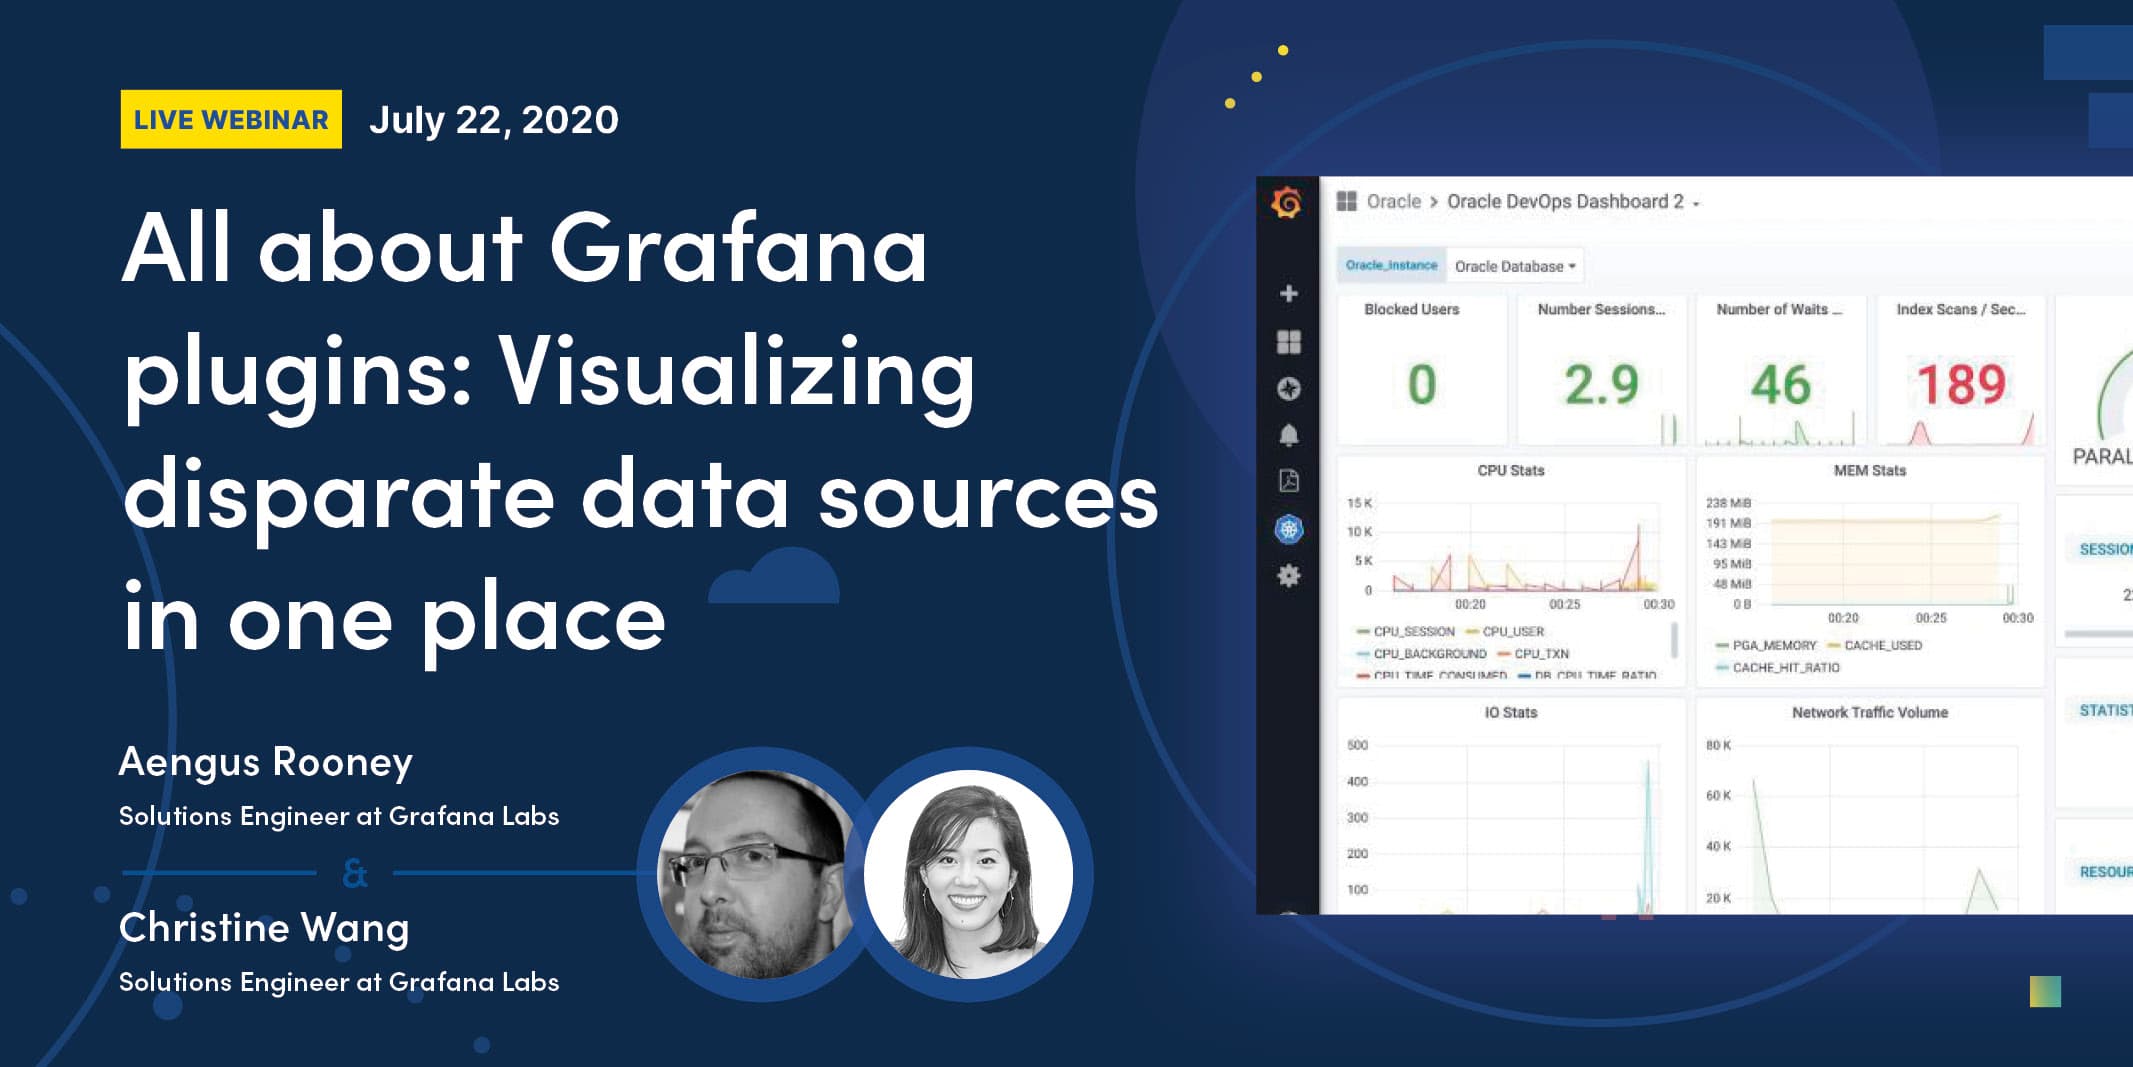
Learn from Grafana Labs Solutions Engineers how our data source plugins enable you to leverage existing investments in popular data and monitoring platforms such as Elasticsearch, Splunk, Oracle, and ServiceNow within Grafana. This webinar will also focus on the unique features of our top Enterprise plugins that allow you to create actionable dashboards for your teams, and how to utilize Grafana features to transform your existing data to get the most out of your metrics and logs.

