Easily monitor your Rocky Linux server using the Linux integration for Grafana CloudIntegrationsGrafana Cloud
How to monitor Windows logs with the updated Windows integration for Grafana CloudGrafana CloudIntegrations
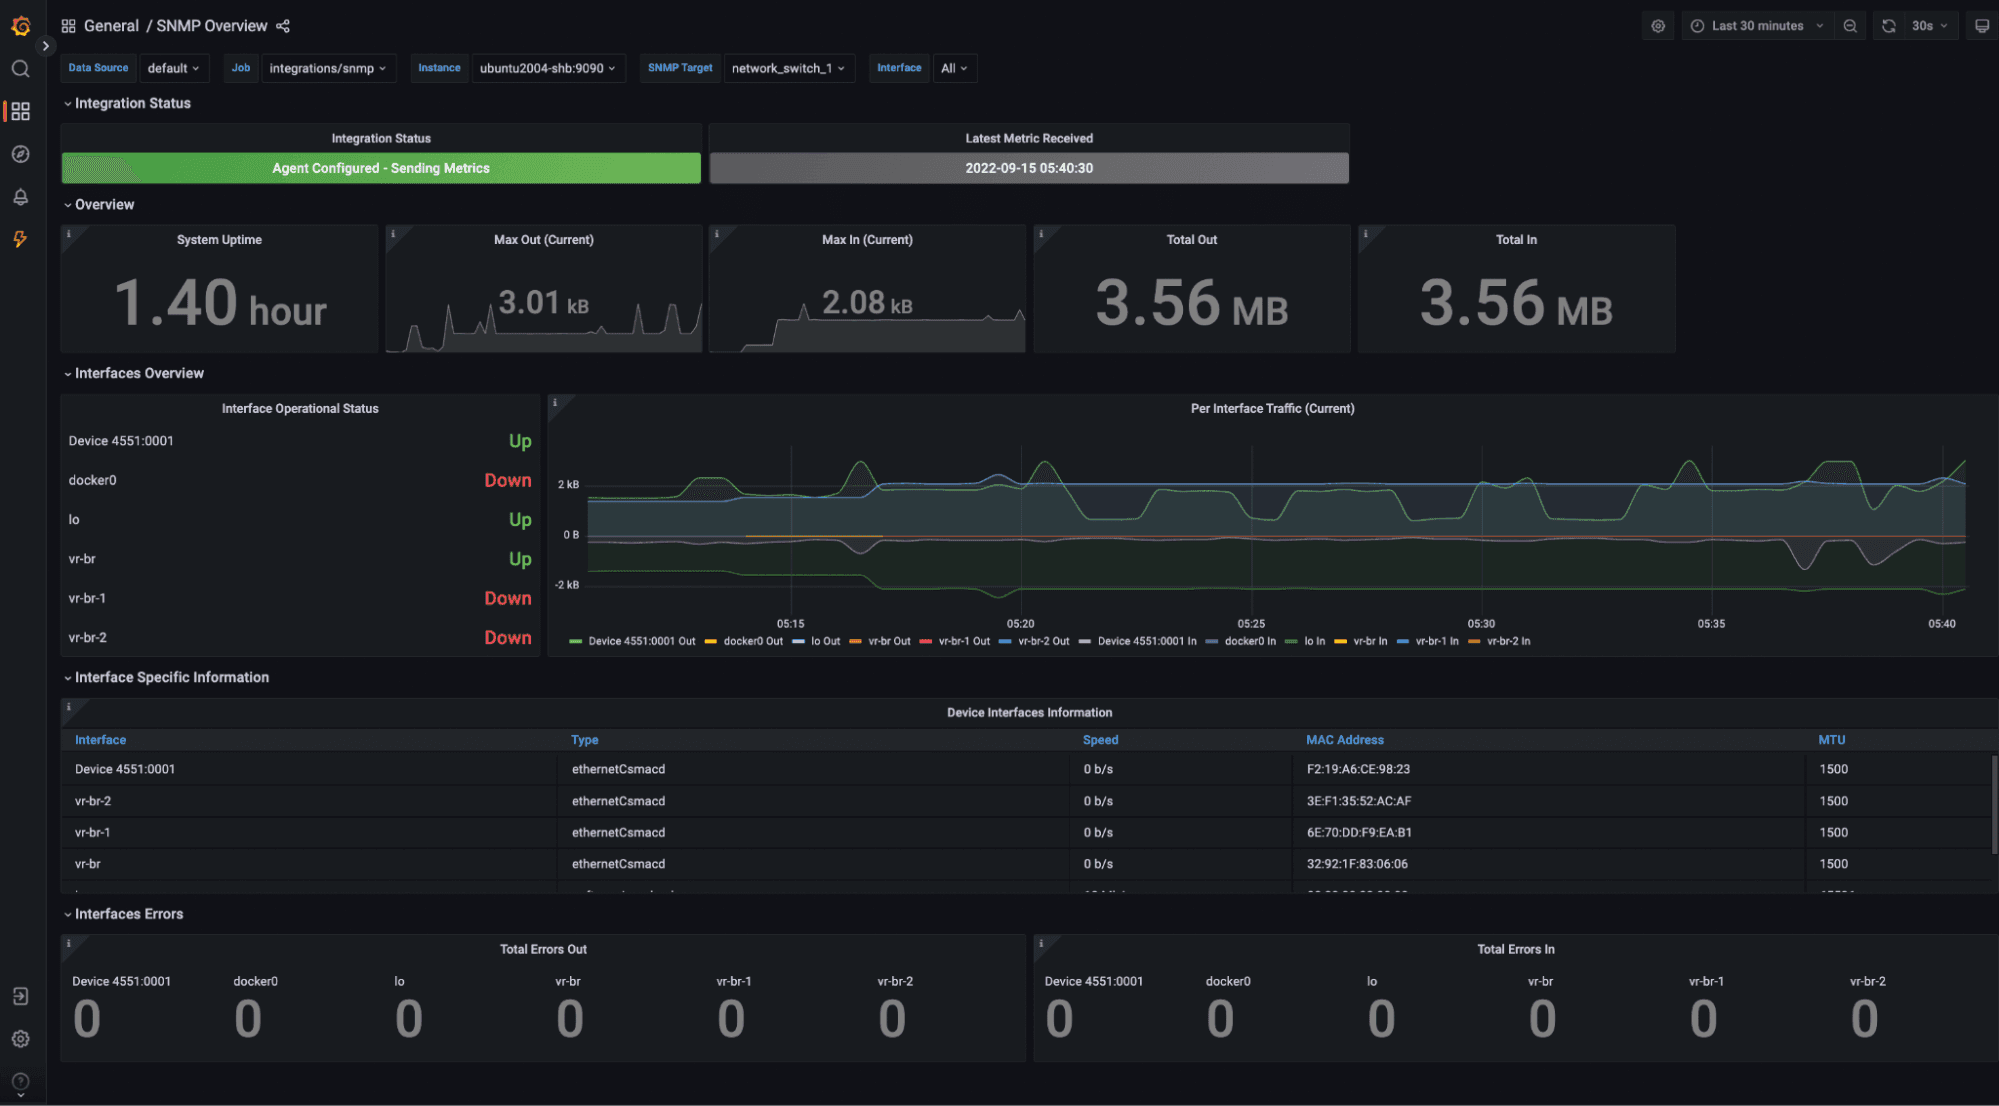
Set up instant SNMP monitoring with the new SNMP integration in Grafana CloudGrafana CloudIntegrations
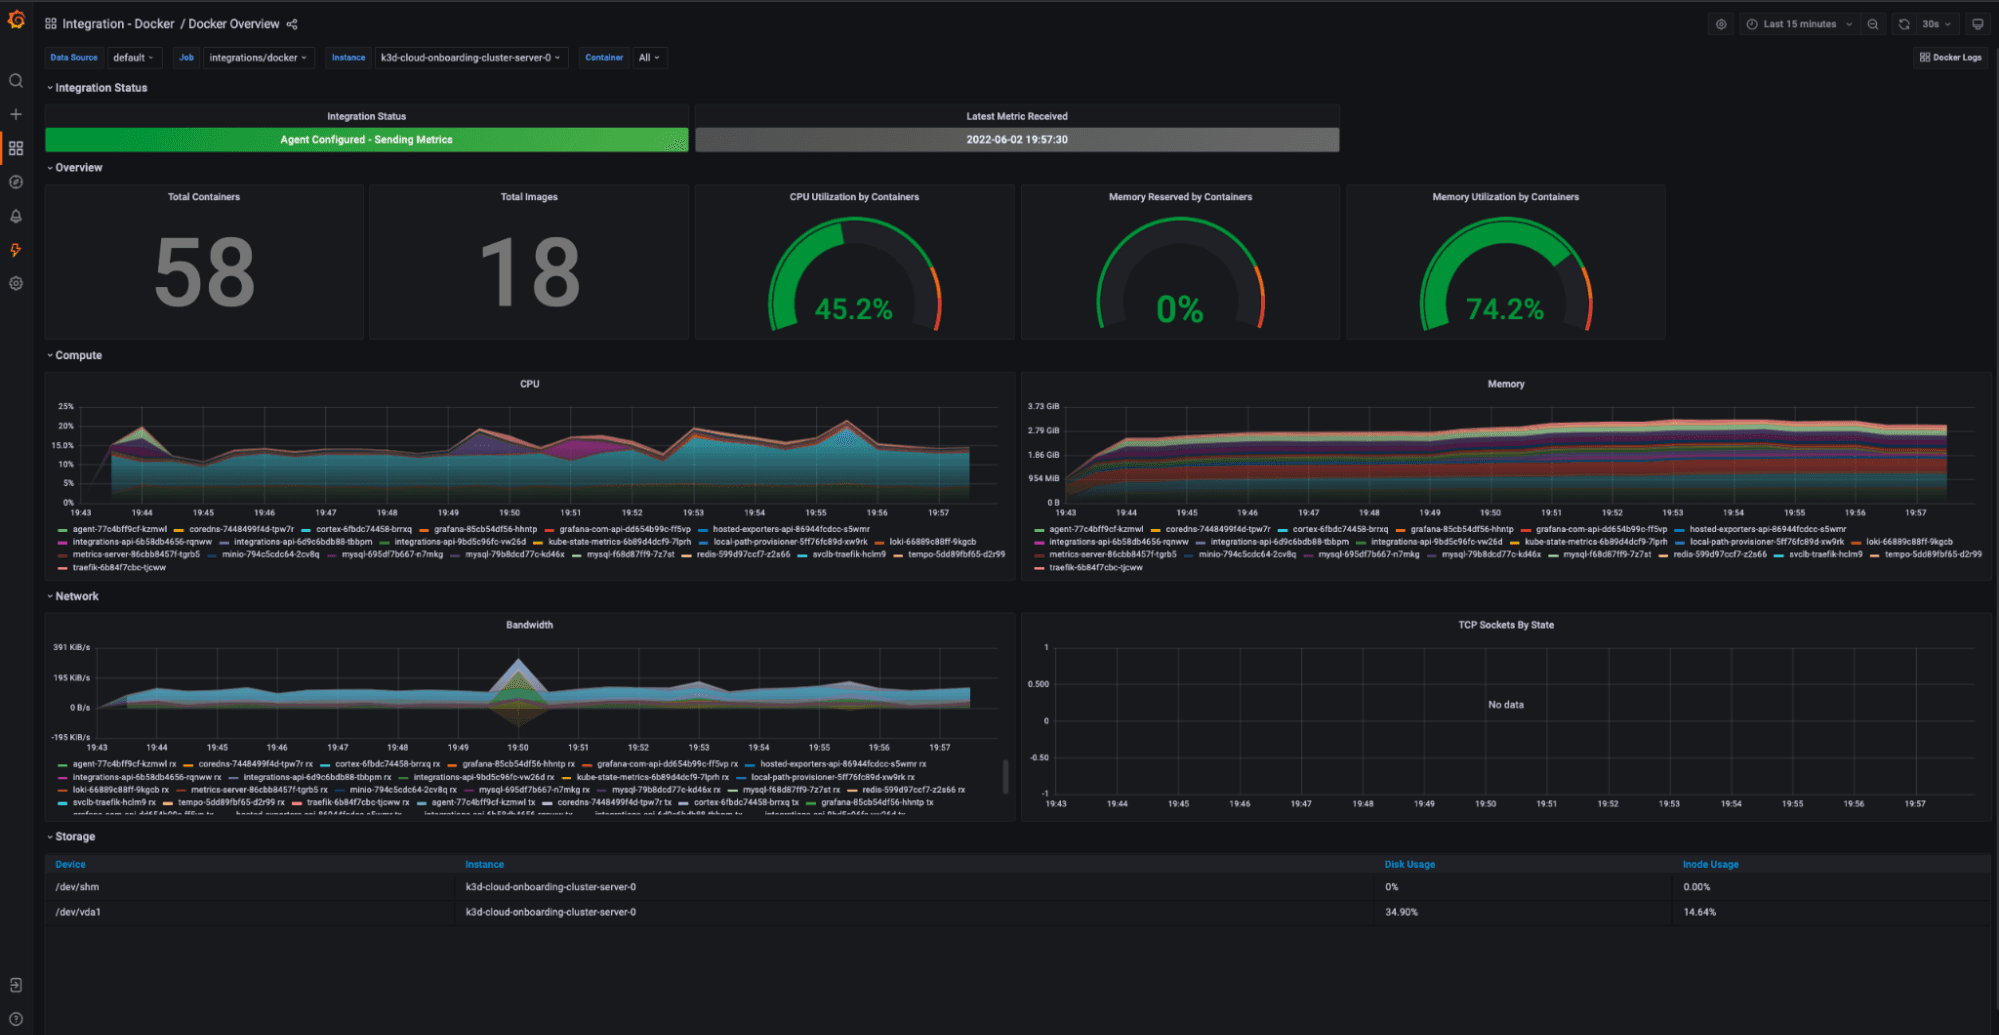
The updated Docker integration in Grafana Cloud now supports logs and metricsIntegrationsGrafana Cloud