PromQL vector matching: what it is and how it affects your Prometheus queries
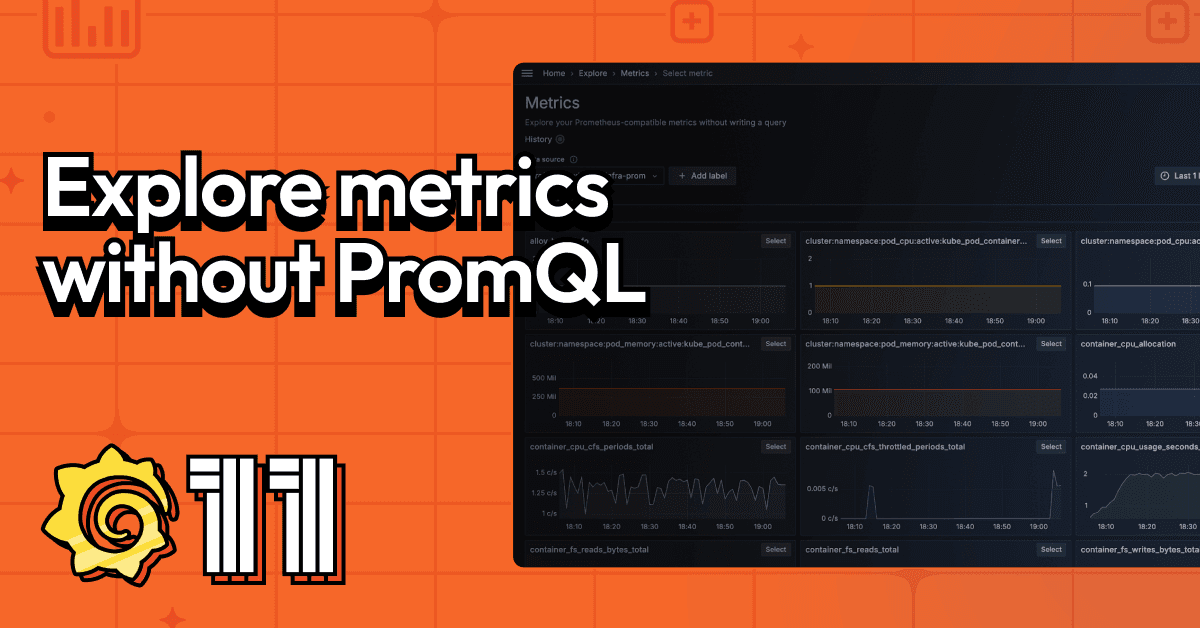
How to explore metrics without PromQL queries in Grafana
Build better PromQL queries with Grafana’s metrics explorer
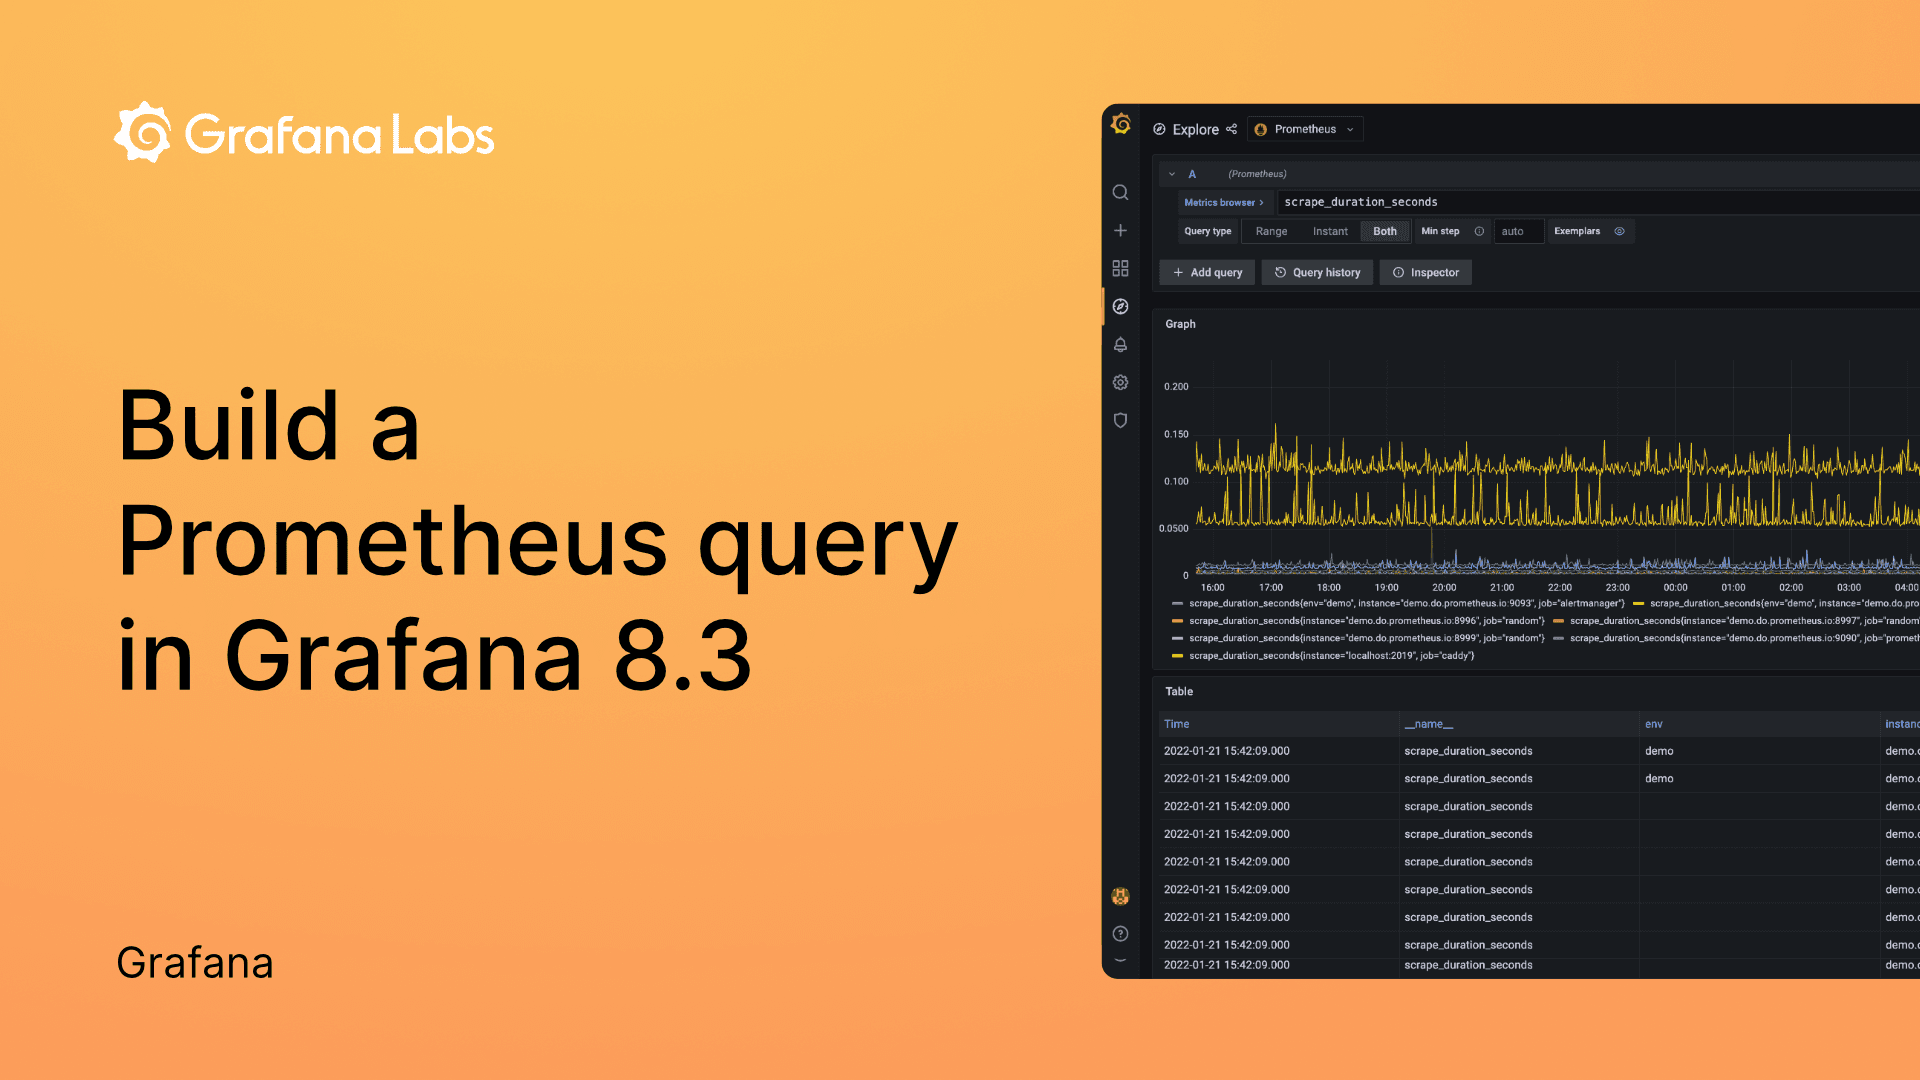
Video: How to build a Prometheus query in Grafana
How to use PromQL joins for more effective queries of Prometheus metrics at scale
Basics and best practices for getting started with PromQL