Grafana Labs at KubeCon: OpenTelemetry eBPF Instrumentation, Prometheus deep dives, and moreKubeConEvents
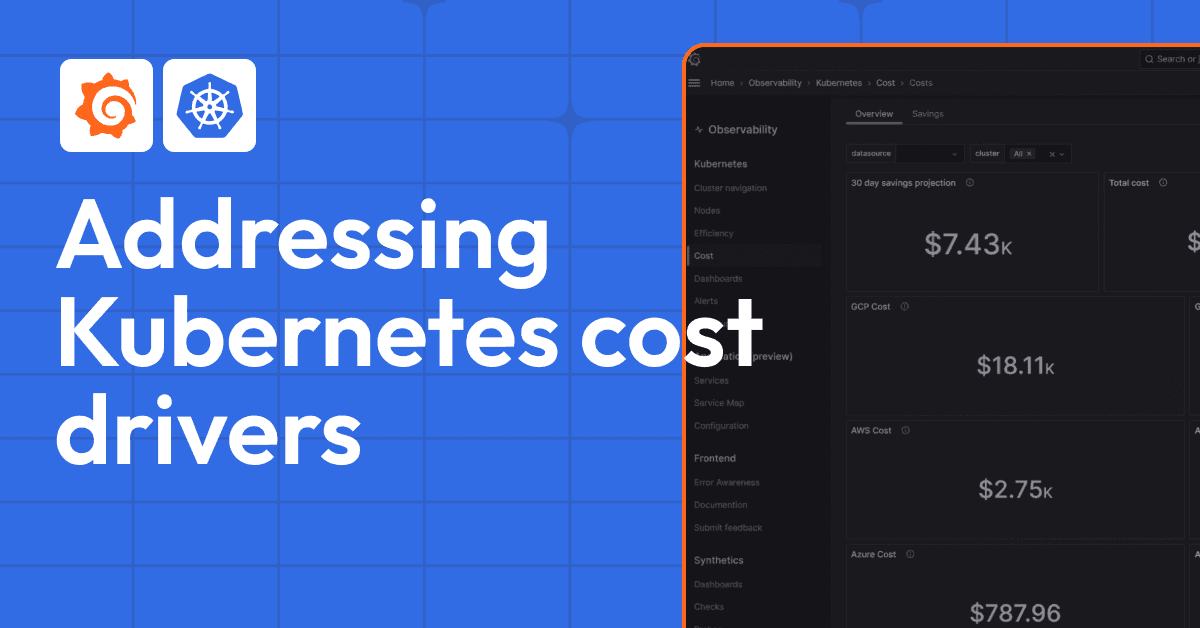
Understand your Kubernetes cost drivers and the best ways to rein in spendingKubernetes MonitoringKubeCon
Grafana Labs at KubeCon: eBPF, sustainability, Prometheus, and moreKubeConKuberneteseBPFPrometheusEventsSustainability
What’s next in Kubernetes monitoring, Prometheus histograms, observability, and more: KubeCon EU 2022 in reviewKubeCon
KubeCon + CloudNativeCon NA 2021 preview: Attend our sessions on Prometheus, Jaeger, and moreEventsPrometheusJaegerKubeCon
KubeCon + CloudNativeCon Europe 2021 preview: Grafana Labs team members talk about Cortex, Prometheus, observability, and distributed tracingEventsMimirPrometheusJaegerObservabilityKubeCon