The 2026 Golden Grot Awards finalists are here: It’s time to vote!Golden GrotsGrafanaConCommunityGrafana
Dive into the GrafanaCON 2026 agenda: technical talks, hands-on learning, and community connectionsGrafanaConEvents
From chaos to clarity with Grafana dashboards: How video game company EA monitors 200+ metricsDashboardGrafanaGrafanaCon
How Dropbox rebuilt its logging stack with Grafana Loki after a data center went darkLokiLoggingGrafanaCon
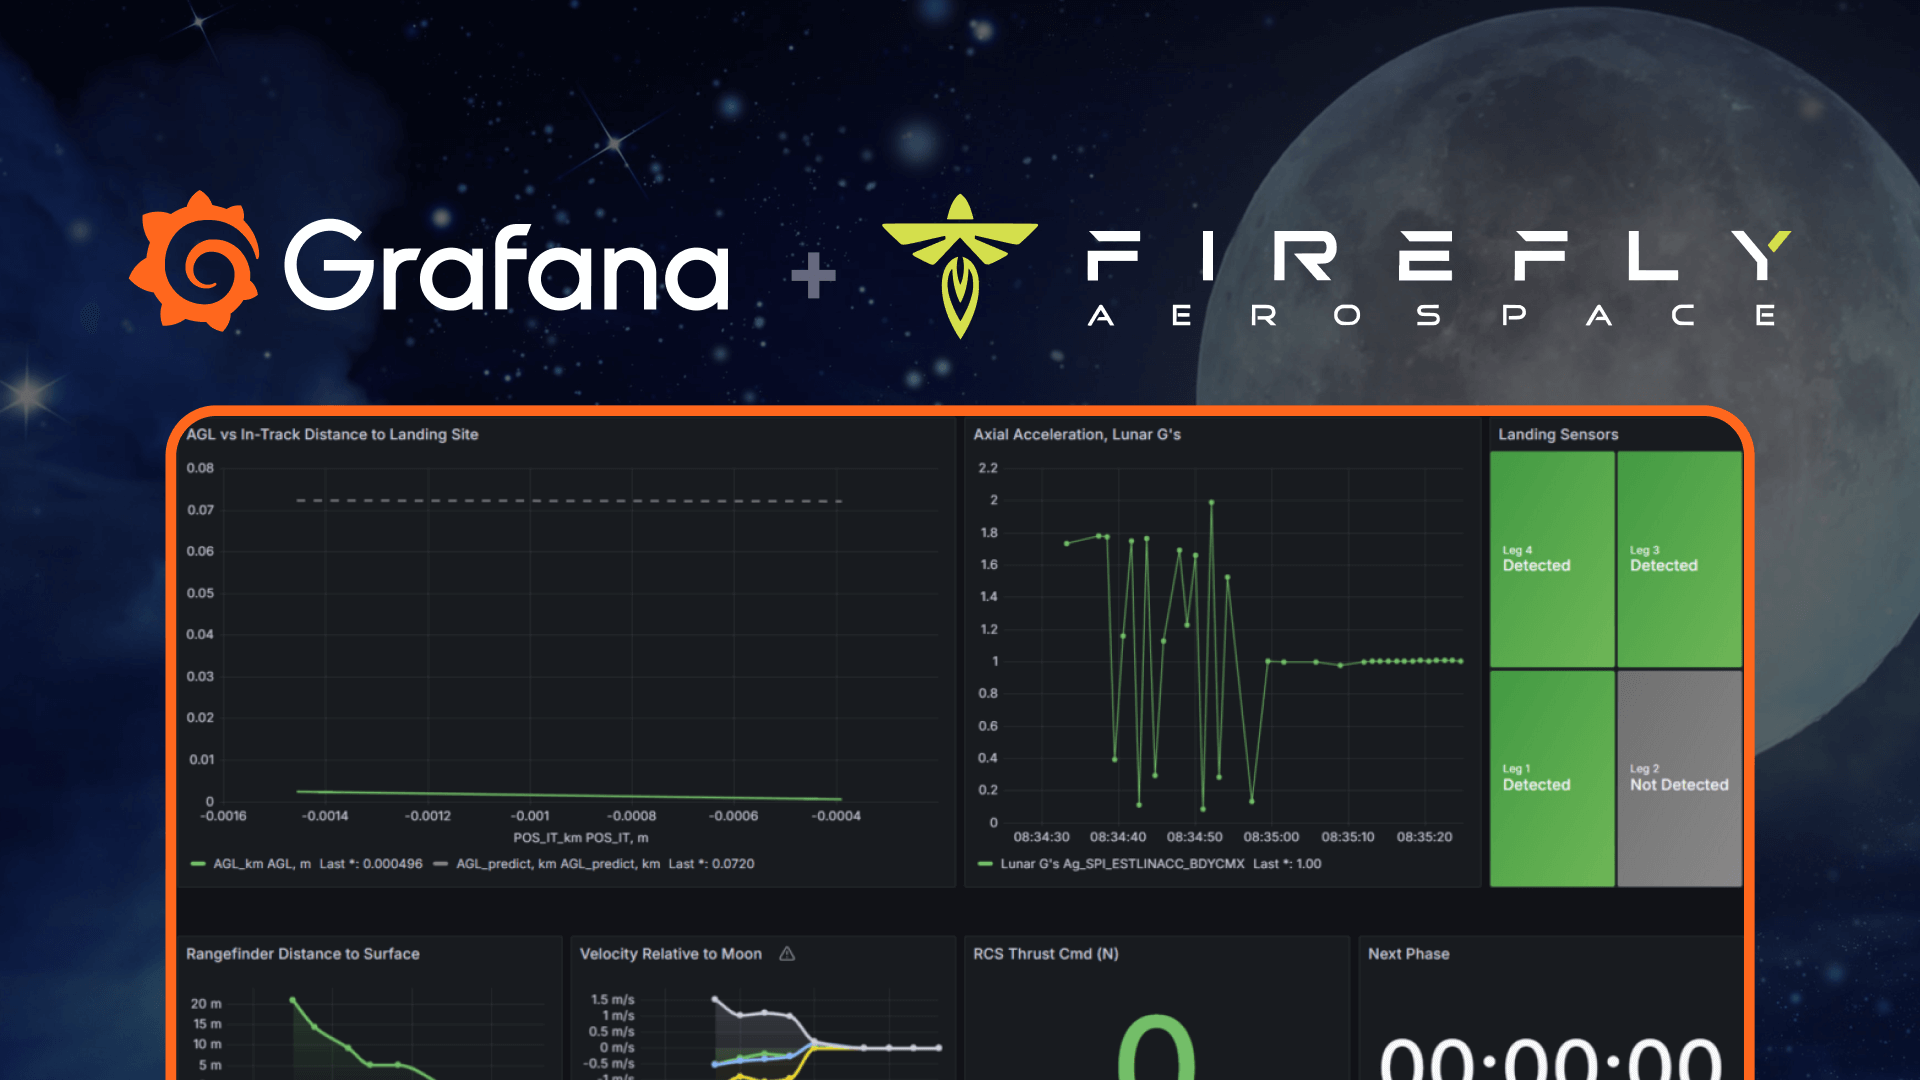
Lunar-level observability: How Firefly Aerospace used Grafana to monitor its historic moon landingCommunityGrafanaConGrafana
GrafanaCON 2025: Agenda highlights and how to start planning your conference experience todayGrafanaConEventsCommunity
The Golden Grot Awards need you: Vote for your favorite dashboard today!Golden GrotsCommunityGrafanaConGrafana
Metrics, logs, and literature: Inside The National Library of the Netherlands’ observability stackGrafanaMimirLokiGrafanaCon
GrafanaCON 2024 Keynote Recap webinars: Register today to catch up on all the latest announcementsCommunityGrafanaConEvents