Plugins 〉Host Overview


Host Overview

Host Overview Panel
A Grafana panel plugin for visualizing the status of fleets of resources — servers, database instances, containers, or any entity with a status field and optional metrics.


Features
- Modern design for Grafana 12 — panel uses built-in theme-ready components.
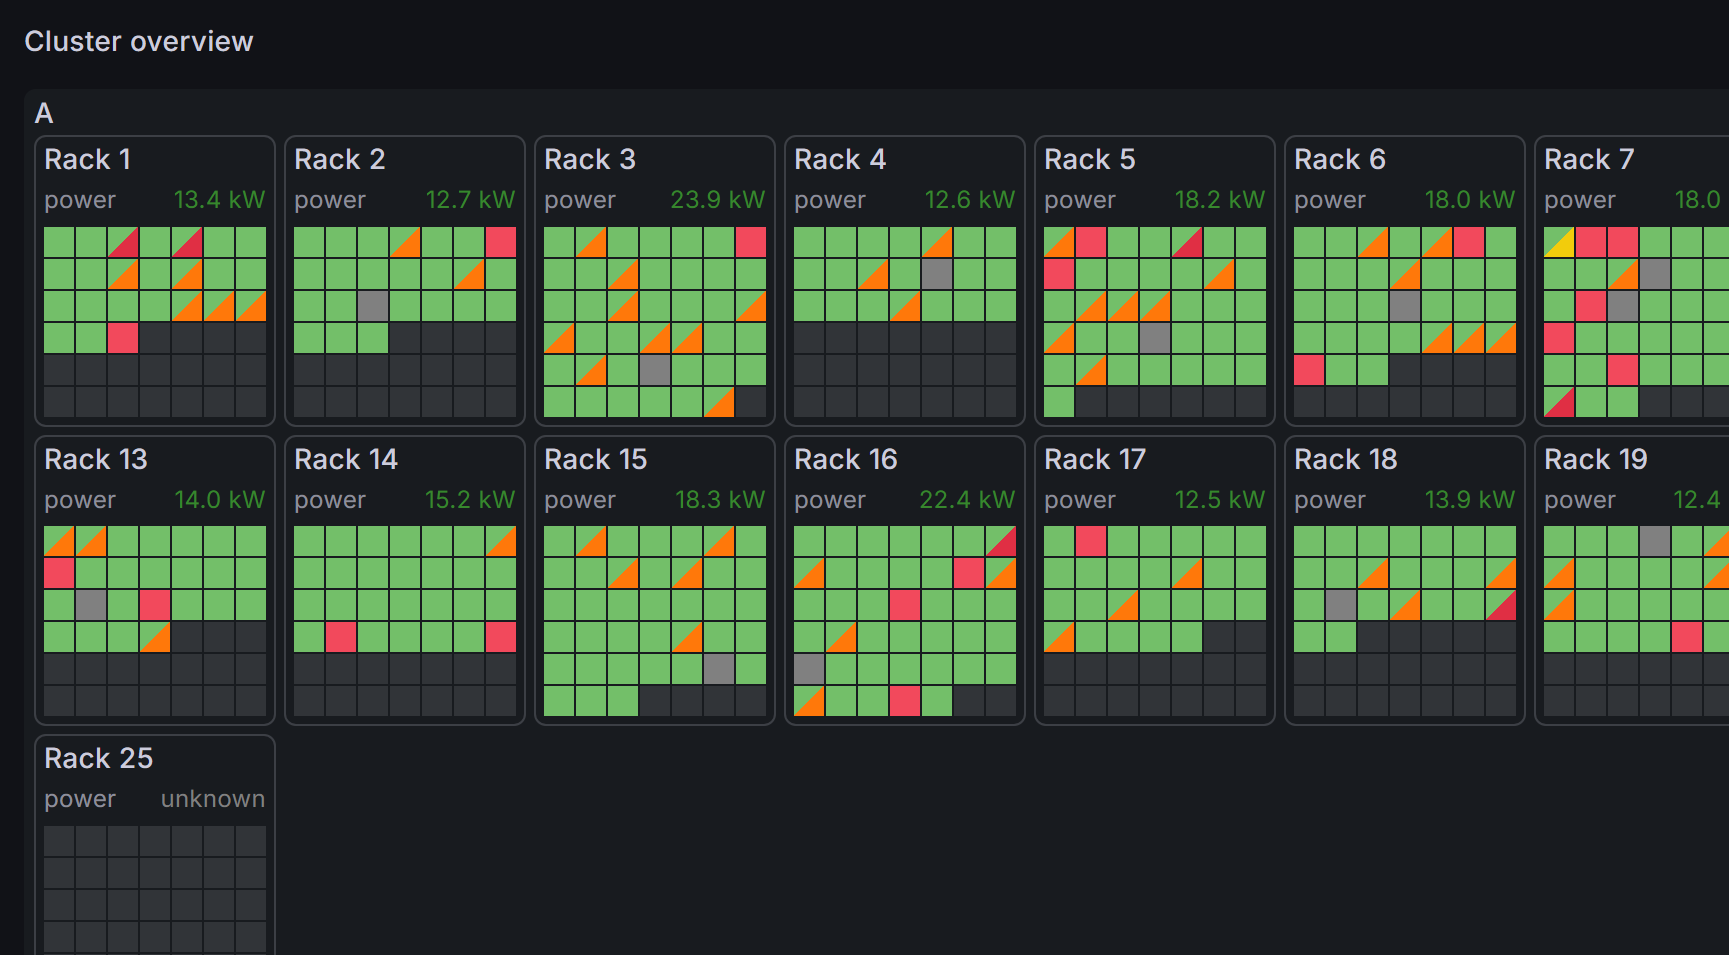
- Flexible grouping — nest resources by any combination of fields, with configurable sort order, coloring, and layout.
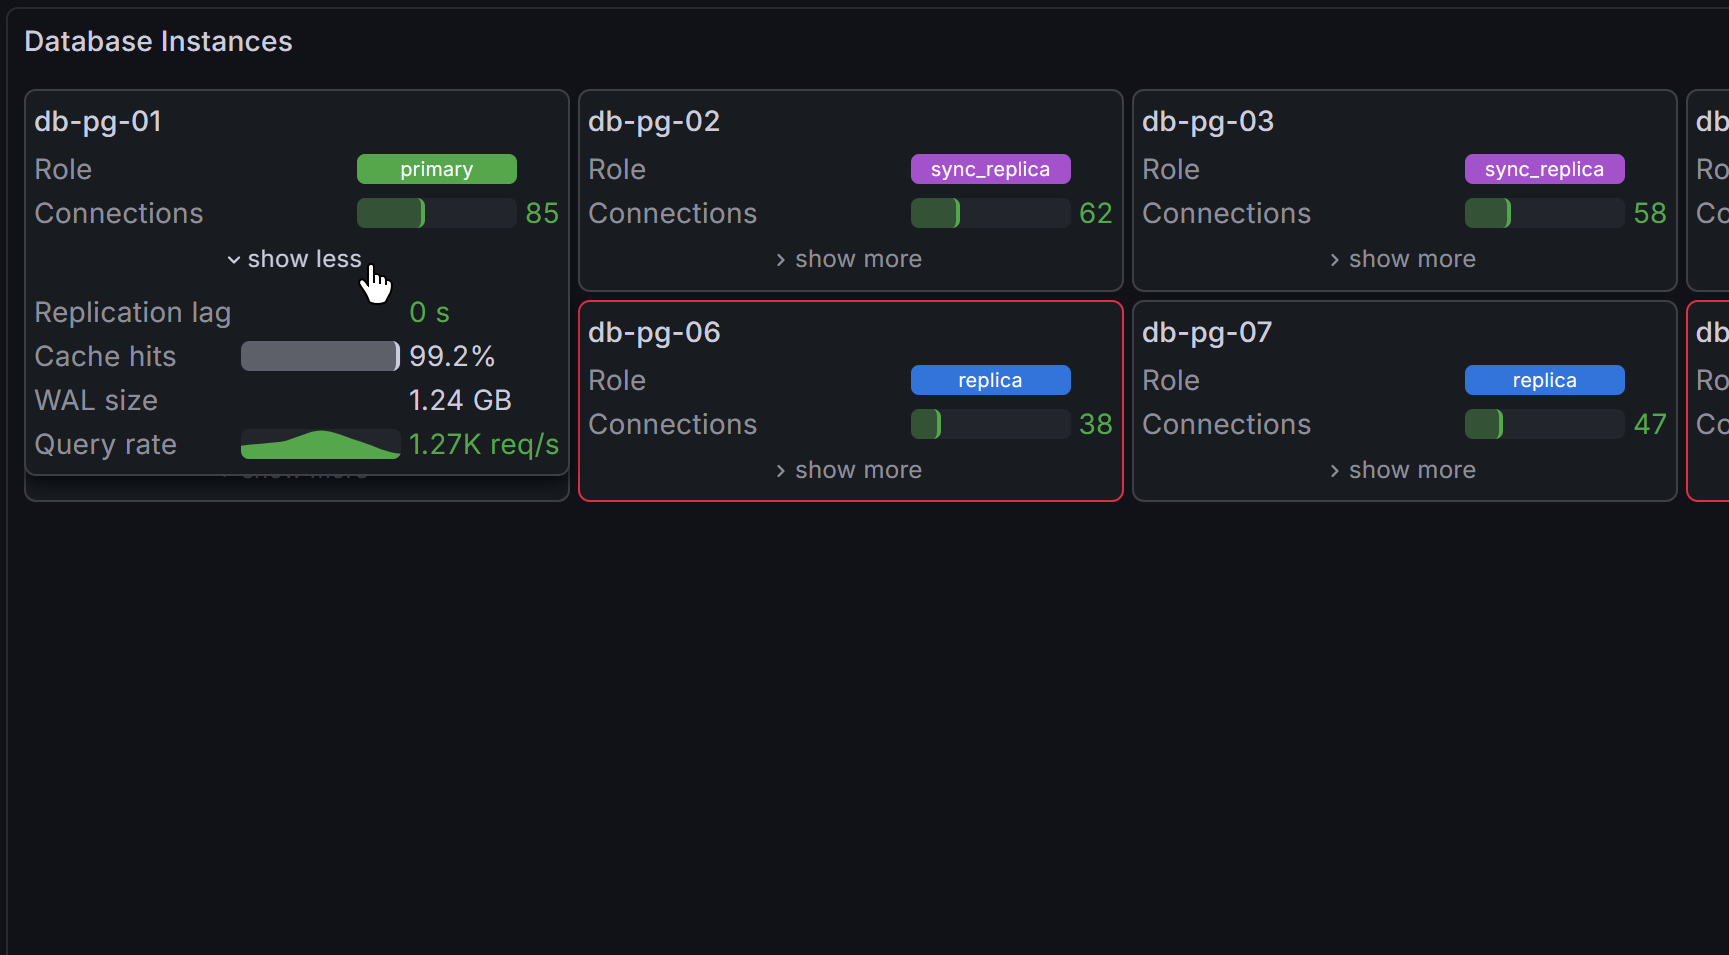
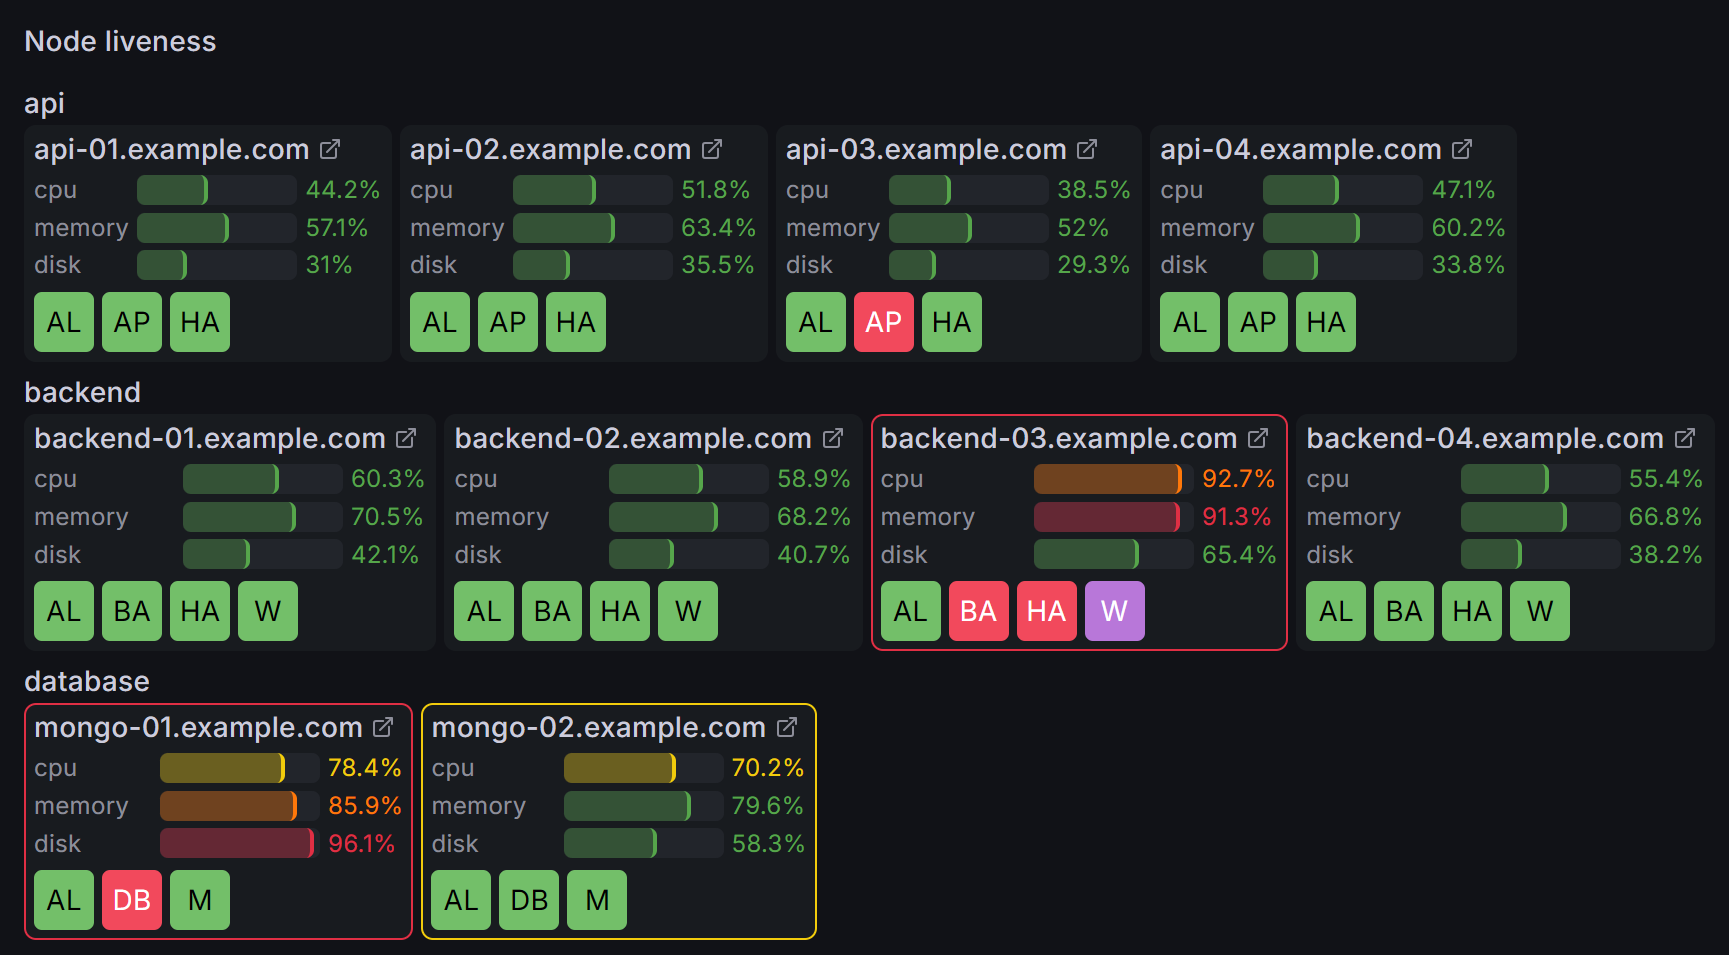
- Multiple display modes — simple colored cells, cells with text labels, or rich table cards showing multiple fields per resource.
- Joins — attach metrics from other data frames to groups or individual resources via key-based joins.
- Field visualizations — text, colored text, colored background, gauges, and sparklines for joined or inline fields.
- Color overrides — fields and joins can override cell colors based on threshold severity.
- Data links support — define data links for any group, resource, or metric.
- Tooltips — hoverable tooltips with configurable title, fields, and joined data.
Requirements
- Grafana 12.0 or later.
Documentation
For setup guides, tutorials, and a full options reference, see the documentation site.
Grafana Cloud Free
- Free tier: Limited to 3 users
- Paid plans: $55 / user / month above included usage
- Access to all Enterprise Plugins
- Fully managed service (not available to self-manage)
Self-hosted Grafana Enterprise
- Access to all Enterprise plugins
- All Grafana Enterprise features
- Self-manage on your own infrastructure
Install on Grafana Cloud
Plugins can be installed directly from within your Grafana instance or automated using the Cloud API or Terraform.
Learn more about plugin installationMarketplace plugins
This is a paid plugin developed by a marketplace partner. To purchase an entitlement, sign in first, then fill out the contact form.
Get this plugin
This is a paid for plugin developed by a marketplace partner. To purchase entitlement please fill out the contact us form.
What to expect:
- Grafana Labs will reach out to discuss your needs
- Payment will be taken by Grafana Labs
- Once purchased the plugin will be available for you to install (cloud) or a signed version will be provided (on-premise)
Thank you! We will be in touch.
For more information, visit the docs on plugin installation.
Installing on a local Grafana:
For local instances, plugins are installed and updated via a simple CLI command. Plugins are not updated automatically, however you will be notified when updates are available right within your Grafana.
1. Install the Panel
Use the grafana-cli tool to install Host Overview from the commandline:
grafana-cli plugins install The plugin will be installed into your grafana plugins directory; the default is /var/lib/grafana/plugins. More information on the cli tool.
Alternatively, you can manually download the .zip file for your architecture below and unpack it into your grafana plugins directory.
Alternatively, you can manually download the .zip file and unpack it into your grafana plugins directory.
2. Add the Panel to a Dashboard
Installed panels are available immediately in the Dashboards section in your Grafana main menu, and can be added like any other core panel in Grafana.
To see a list of installed panels, click the Plugins item in the main menu. Both core panels and installed panels will appear.
Changelog
1.2.0
- Added a "Cell size" panel option that controls cell width and height independently. The control supports three modes: free (width and height edited separately), locked (height drives both dimensions), and — in "Cell with text" display mode — auto-fit to text content. Existing dashboards keep their previous square cell appearance.
- Added a "Capitalize cell text" toggle (default on) that controls the uppercase styling of cell text in "Cell with text" display mode.
1.1.2
- Moved plugin documentation to ReadTheDocs.
- Added signature for Grafana Cloud.
- Minor refactorings, should not affect functionality.
1.1.1
- Fixed a bug when transparent background would not work for groups that have their borders hidden.
1.1.0
- Overhauled severity detection: criticality score is now based on normalized distance from a severity-0 anchor threshold (green by default), instead of simple index-based scoring.
- Added custom severity overrides per threshold color, allowing users to assign explicit severity scores to specific threshold colors.
- Added option to add tooltip sections. Merged tooltip content and resource content into a single section.
- Added option to specify known IDs by joining another data frame.
- Added option to specify resource status by joining another data frame.
- Added option to designate resource as a "sidecar", changing its appearance to indicate that this is an auxiliary resource.
- Fixed incorrect suggestions when selecting fields for grouping and joining.
- Fixed disappearing data links.
- Fixed resource tooltip being clipped by panel bounds.
- Fixed a bug when status field would show up twice in rich table rendering mode.
- Reworked rich table layout to fix lags and jitter when editing its fields.
1.0.0
Initial release 🎉
0.0.0
Initial beta release.