Plugins 〉Microsoft Teams Observability


Microsoft Teams Observability
MS Teams Observability - Grafana Application
The MS Teams Observability Grafana Application provides ready-to-use visualizations to monitor Microsoft Teams call quality, users, sites, and service health directly inside Grafana.
Installed in a Grafana environment, the application gives operational visibility into Microsoft Teams activity and quality using telemetry collected by the agent and stored in a Loki datasource. It helps organizations monitor collaboration experience, investigate service degradations, analyze call quality by stream and participant, and support operational troubleshooting across engineering, operations, and support teams.
The application is designed to work with the Microsoft Teams Observability Agent, which collects and forwards the data used by the dashboards and investigation views.
The application also supports a Demo Mode with built-in sample data, allowing evaluation, testing, or demonstrations without requiring a live collector connection.
Requirements
- Grafana >= 12.3.0
- A Loki datasource configured in the Grafana instance, containing the logs emitted by the Microsoft Teams Observability Agent (Live Mode only)
- The Microsoft Teams Observability Agent deployed against the target tenant (Live Mode only)
Demo Mode has no runtime dependencies and can be used immediately after installation.
Getting Started
Installation
The application can be installed from the Grafana plugin catalog or by uploading the application ZIP package manually through the Grafana CLI.
Once installed, enable the app from Administration -> Plugins -> MS Teams Observability -> Enable.
First use
The app ships with Demo Mode enabled by default — open any of its pages and explore the full UI with built-in sample data, no configuration required.
To switch to Live Mode:
- Open the Configuration page from the app navigation.
- Select the Loki datasource that receives telemetry from the Teams Observability Agent.
- Toggle Demo Mode off.
The Test button in the plugin configuration reports the current mode and confirms that a Loki datasource is wired up when Live Mode is active.
Datasource configuration
When using Live Mode, the MS Teams Observability datasource supports the following settings:
| Setting | Description | Default |
|---|---|---|
| Loki URL | HTTP URL of the Loki instance | http://loki:3100 |
| Loki tenant / org ID | X-Scope-OrgID header value for multi-tenant Loki | (empty) |
| Auth type | Authentication method (none, bearer, basic) | none |
| Service name | Value used in the LogQL selector {service_name="<value>"} | ms-teams-agent |
| Timeout | Loki query timeout in milliseconds | 30000 |
The service_name field allows configuring the LogQL selector to match the label used by your collector deployment:
{service_name="ms-teams-agent"} | log_source="MSTeams_CallRecords_CallMetadata"
Features
The application provides several views addressing different operational needs:
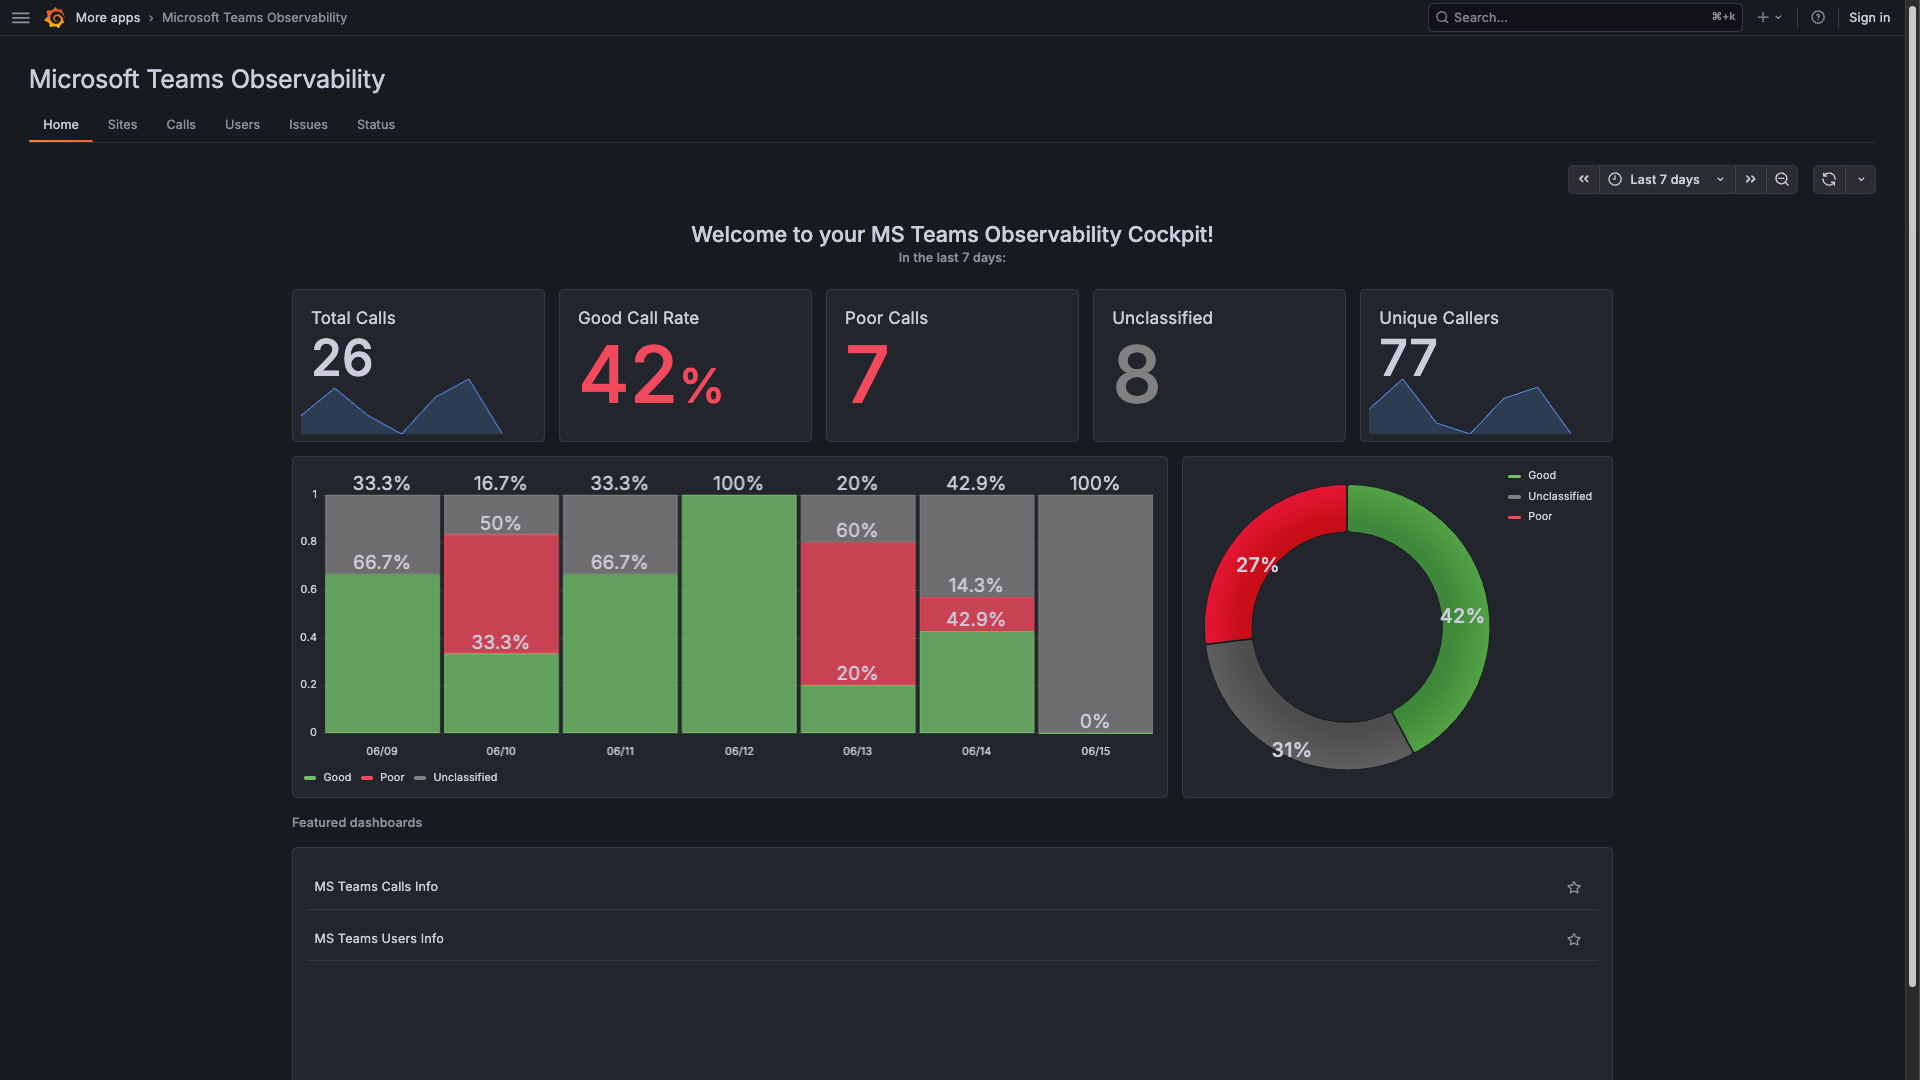
Home
High-level observability cockpit for Microsoft Teams, showing a configurable time-range summary of call activity and quality with KPI cards, call health distribution (good / poor / unclassified), platform distribution, and quick links to embedded dashboards.
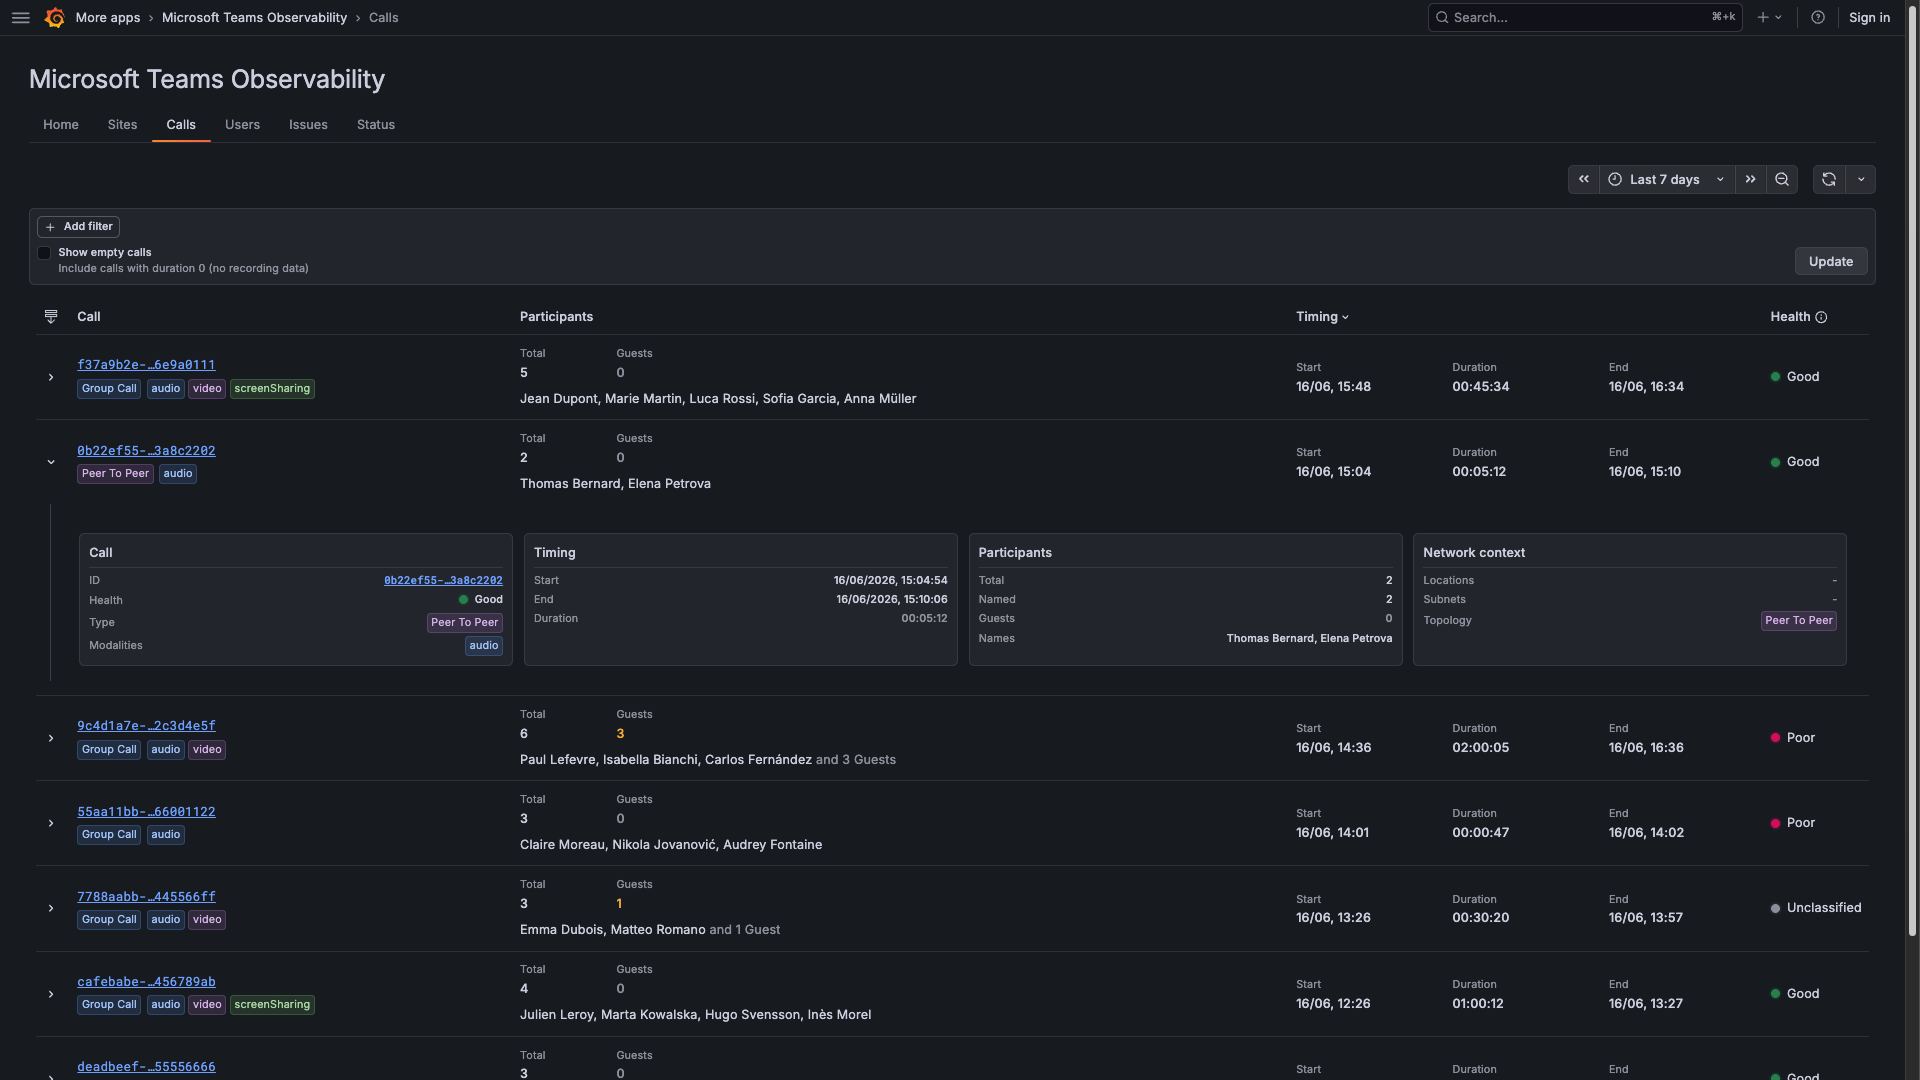
Calls
Searchable and filterable list of recorded Microsoft Teams calls, with per-call health status, type (peer-to-peer or group), participant count, duration, and time range. Used to locate calls quickly, investigate quality problems, and navigate to the detailed call analysis view.
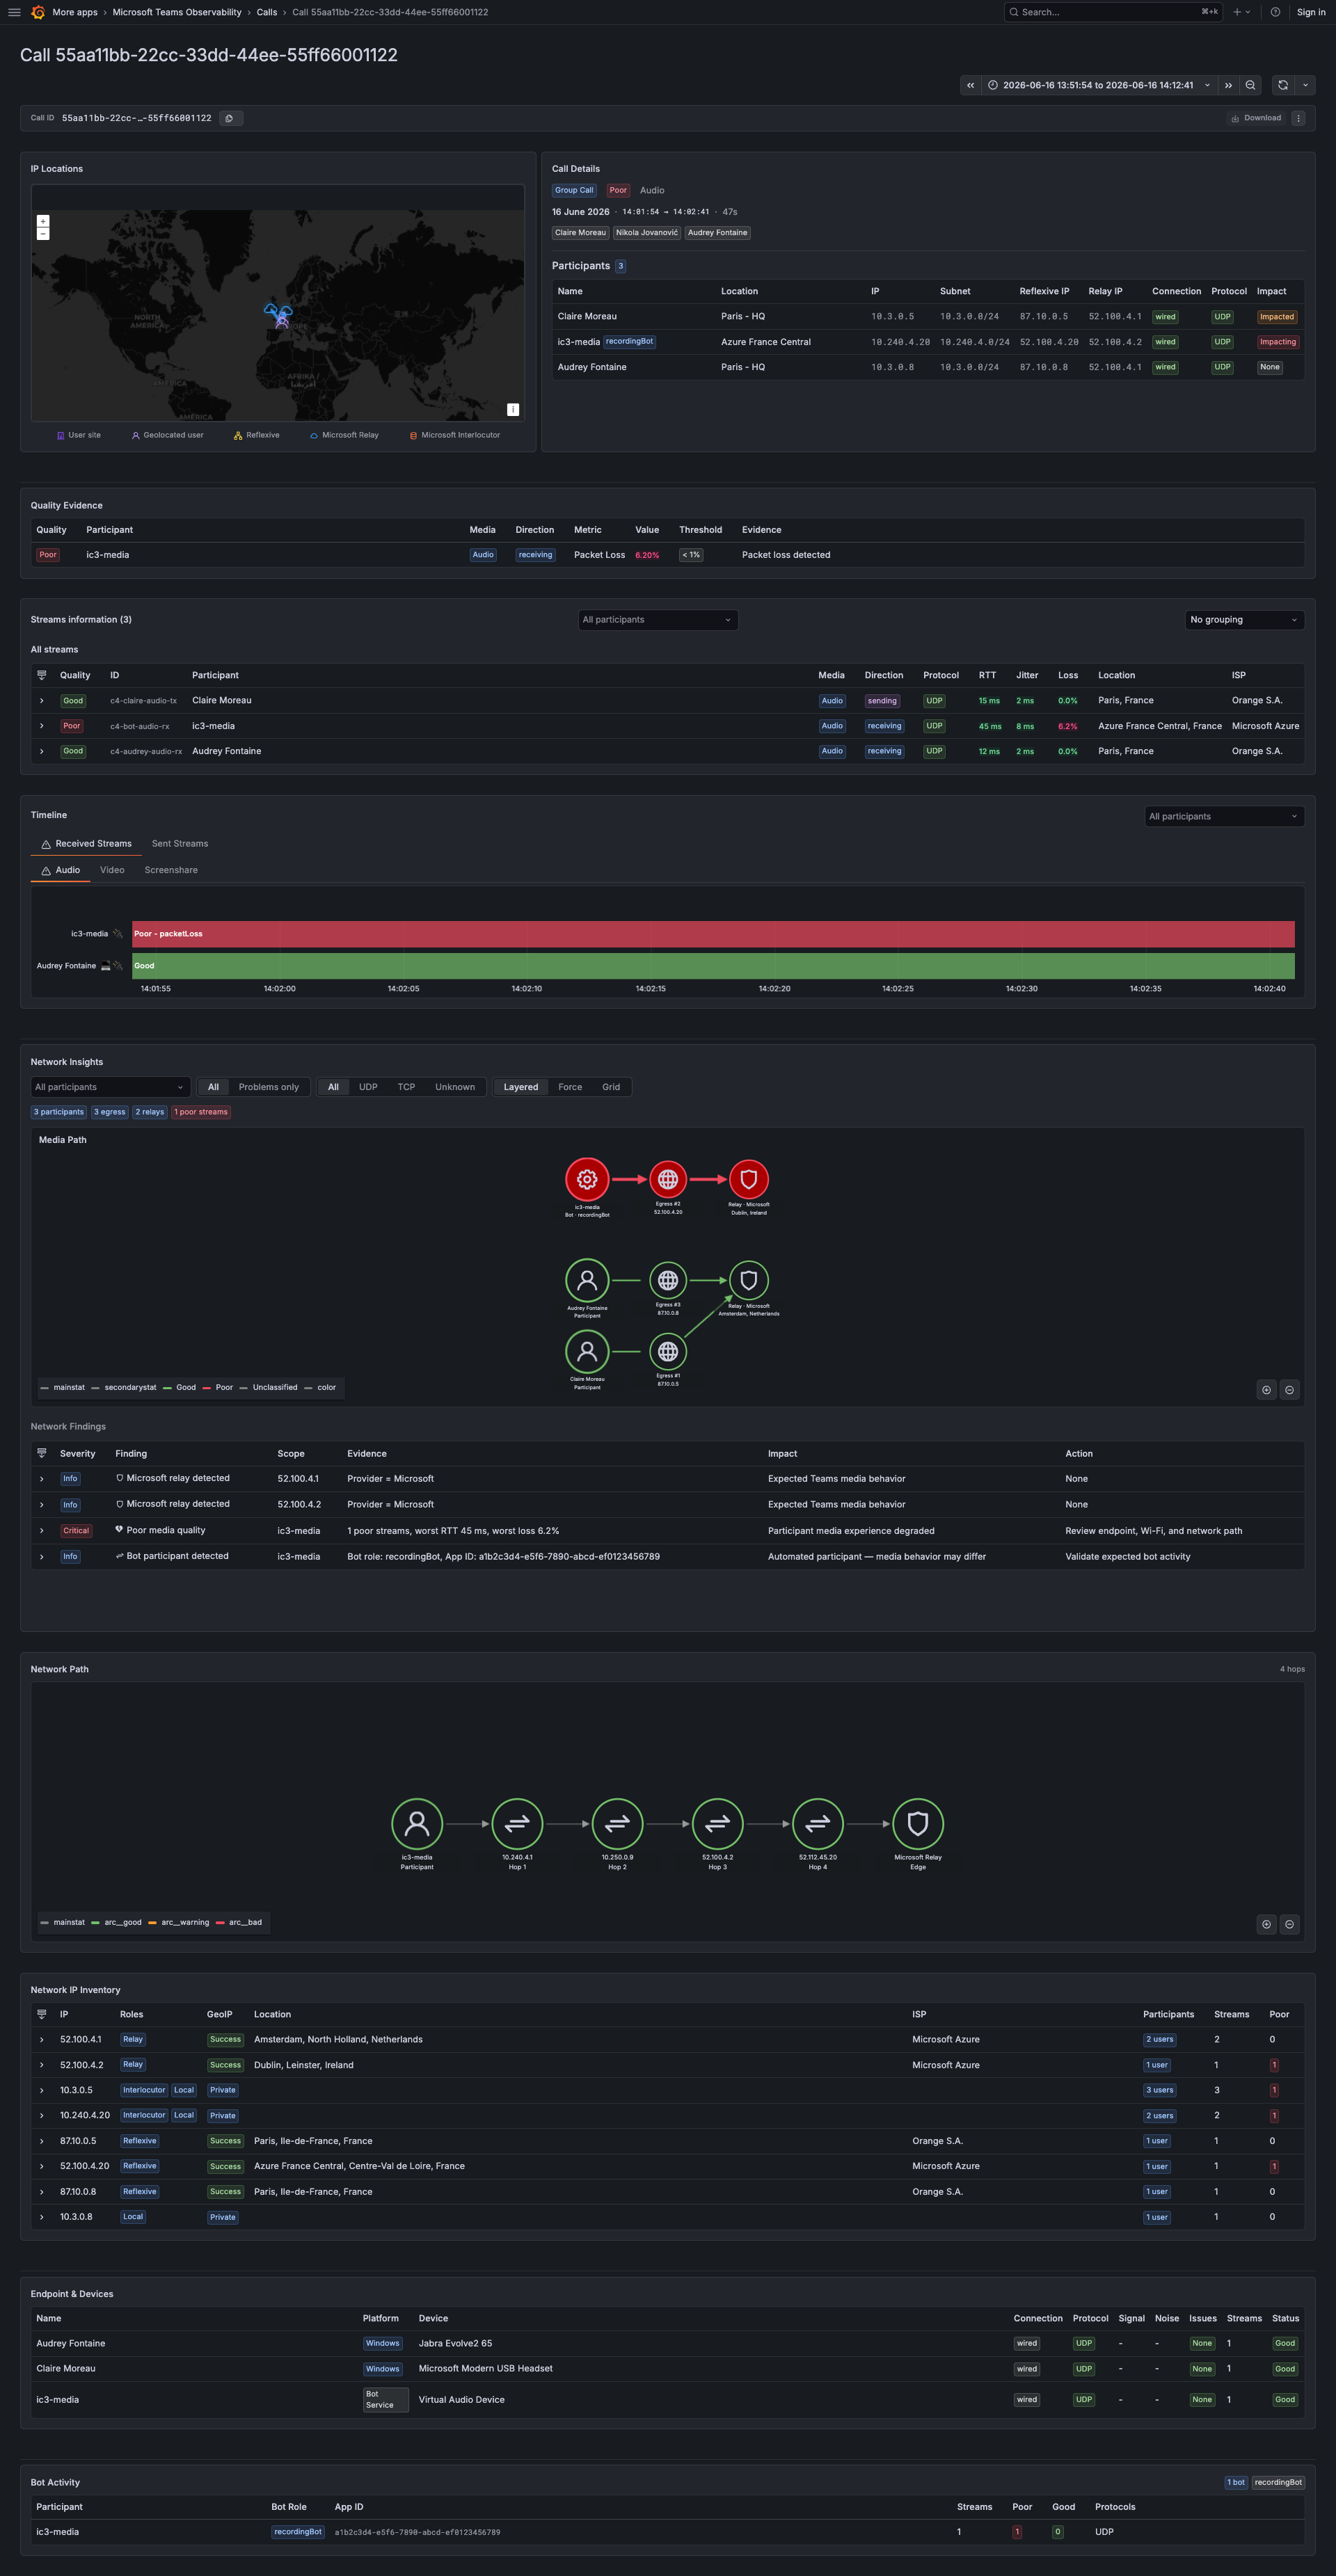
Call Overview
Detailed analysis of a single Microsoft Teams call, organized as an investigation flow:
- Call Verdict — overall quality assessment, poor stream count, worst RTT / jitter / packet loss, transport protocol, and primary root cause
- Quality Evidence — stream-level evidence with severity, metric thresholds, and participant-level impact
- Participants — per-participant health matrix with connection type, protocol, egress ASN, relay region, stream count, and endpoint signals
- Streams — stream details table sortable by quality, RTT, jitter, and packet loss, with optional filter for degraded or poor streams
- Network Evidence — transport distribution, relay usage, public egress and ASN, shared IP and NAT patterns, IP geolocation map
- Endpoint & Devices — per-participant platform, client version, connection type, audio device signals, and CPU status
- Advanced — network IP inventory (role, ASN, ISP, geo, participants), raw stream records, and raw call metadata
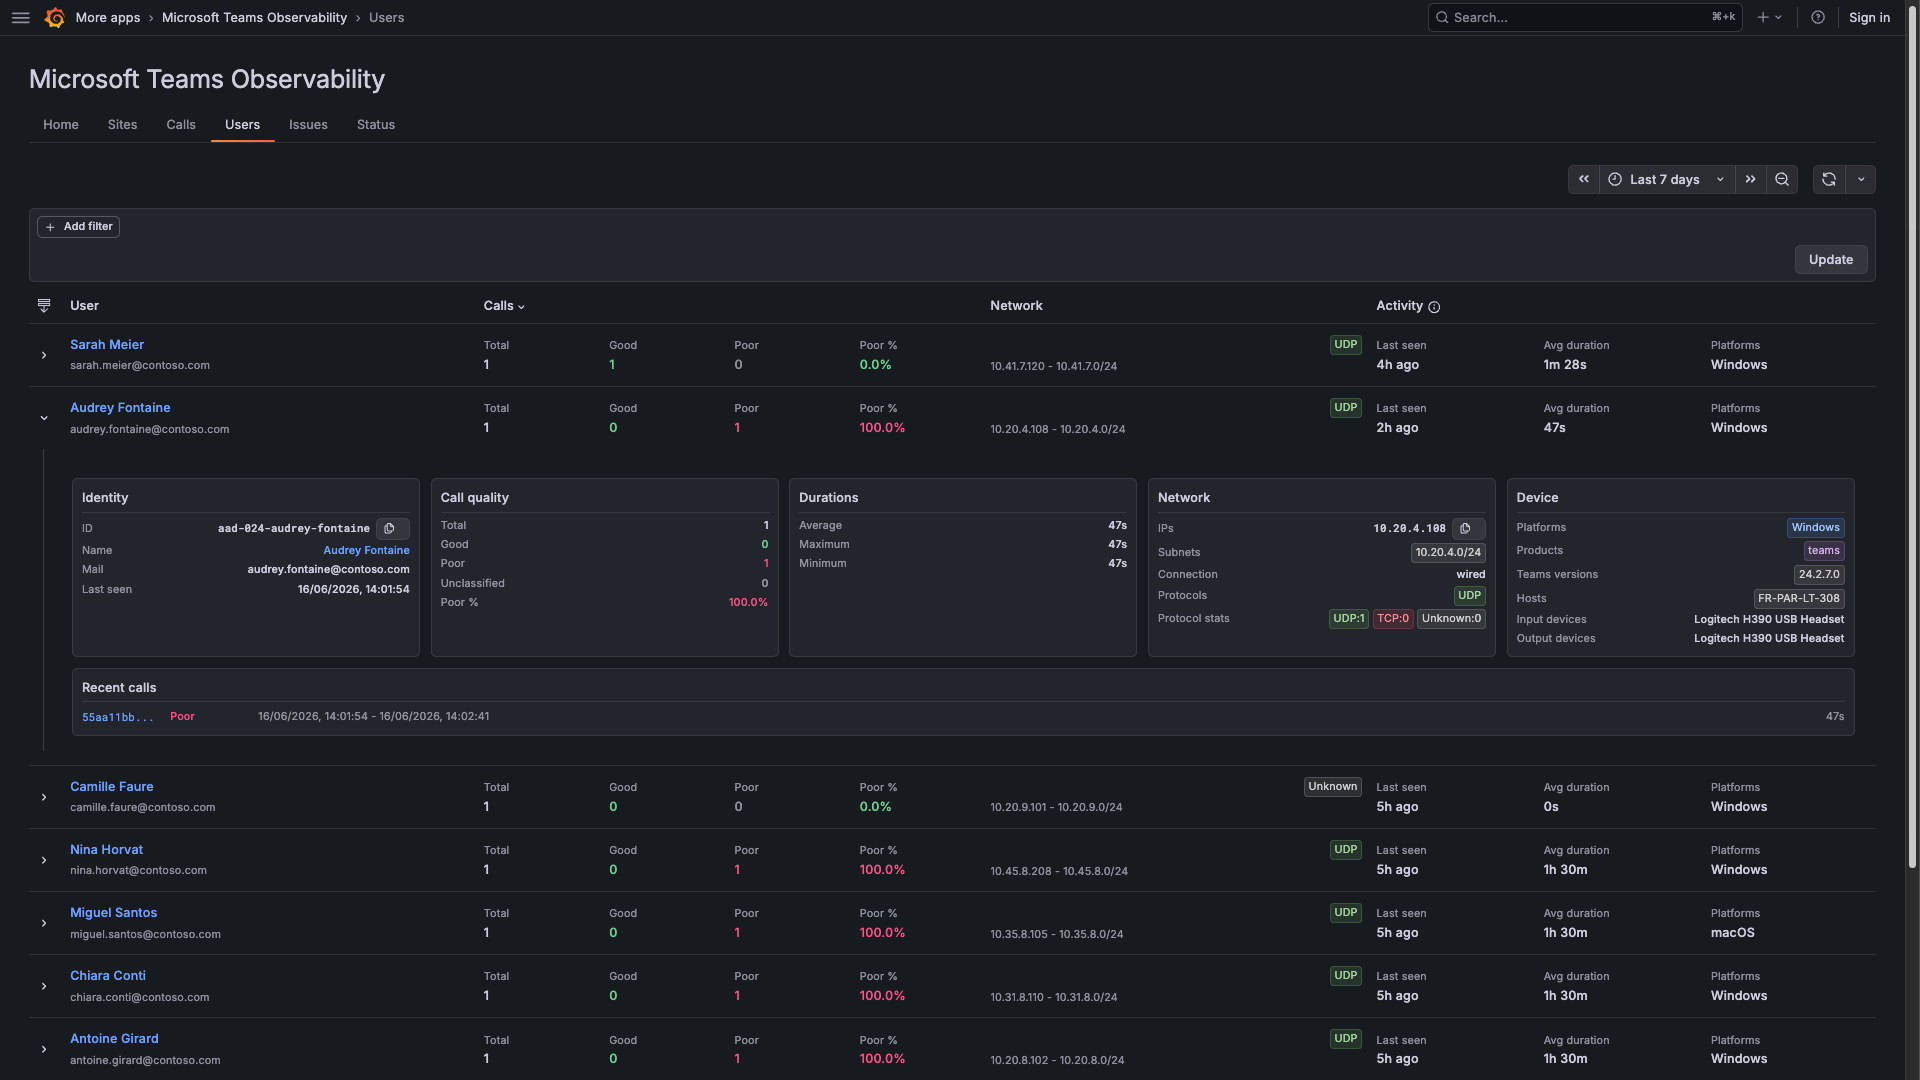
Users
Per-user analytics across the Microsoft Teams environment, including identity, email, IP addresses, protocols, call statistics (total, good, poor, unclassified), average duration, platform breakdown, and last seen timestamp. Each row can be expanded to show recent calls and per-protocol quality breakdown.
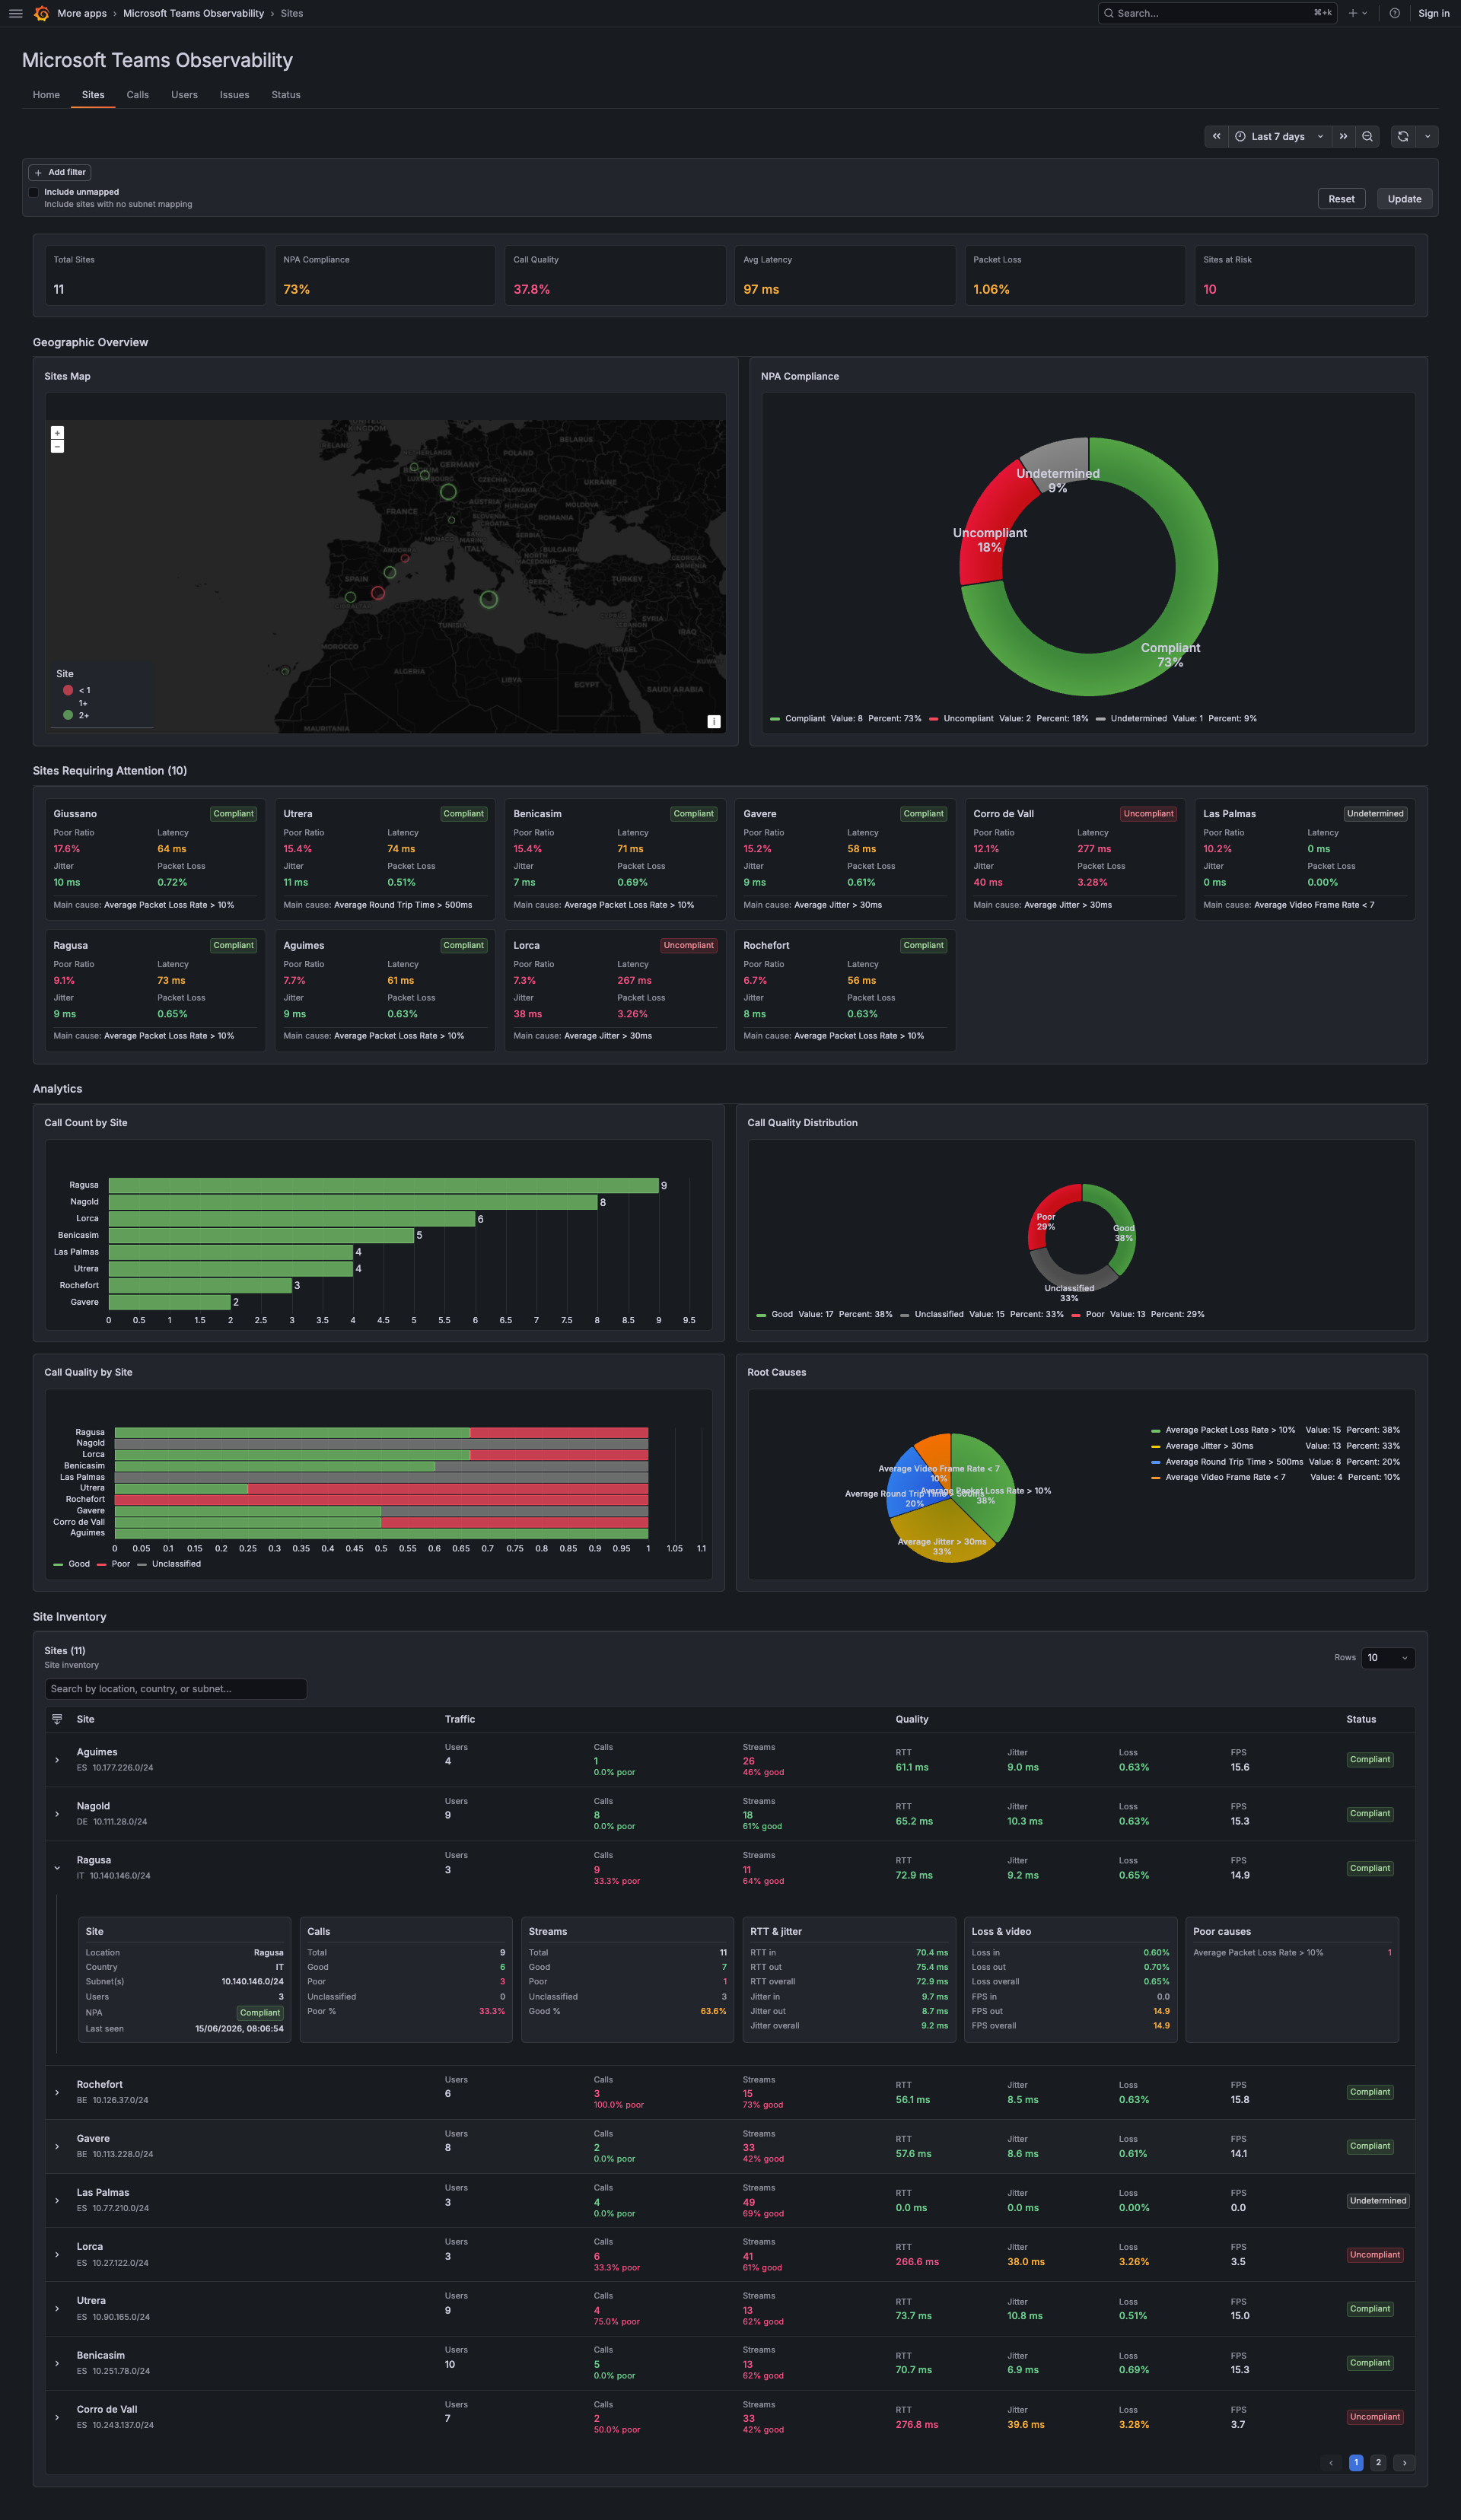
Sites
Aggregated analysis of call quality and network performance by geographic location and subnet, with:
- KPI summary (total sites, NPA compliance, call quality, average latency, packet loss, sites at risk)
- Geographic map with site-level markers
- NPA compliance breakdown (compliant / non-compliant / undetermined)
- Sites requiring attention table with poor ratio, latency, jitter, packet loss, and main cause
- Call count by site and call quality distribution charts
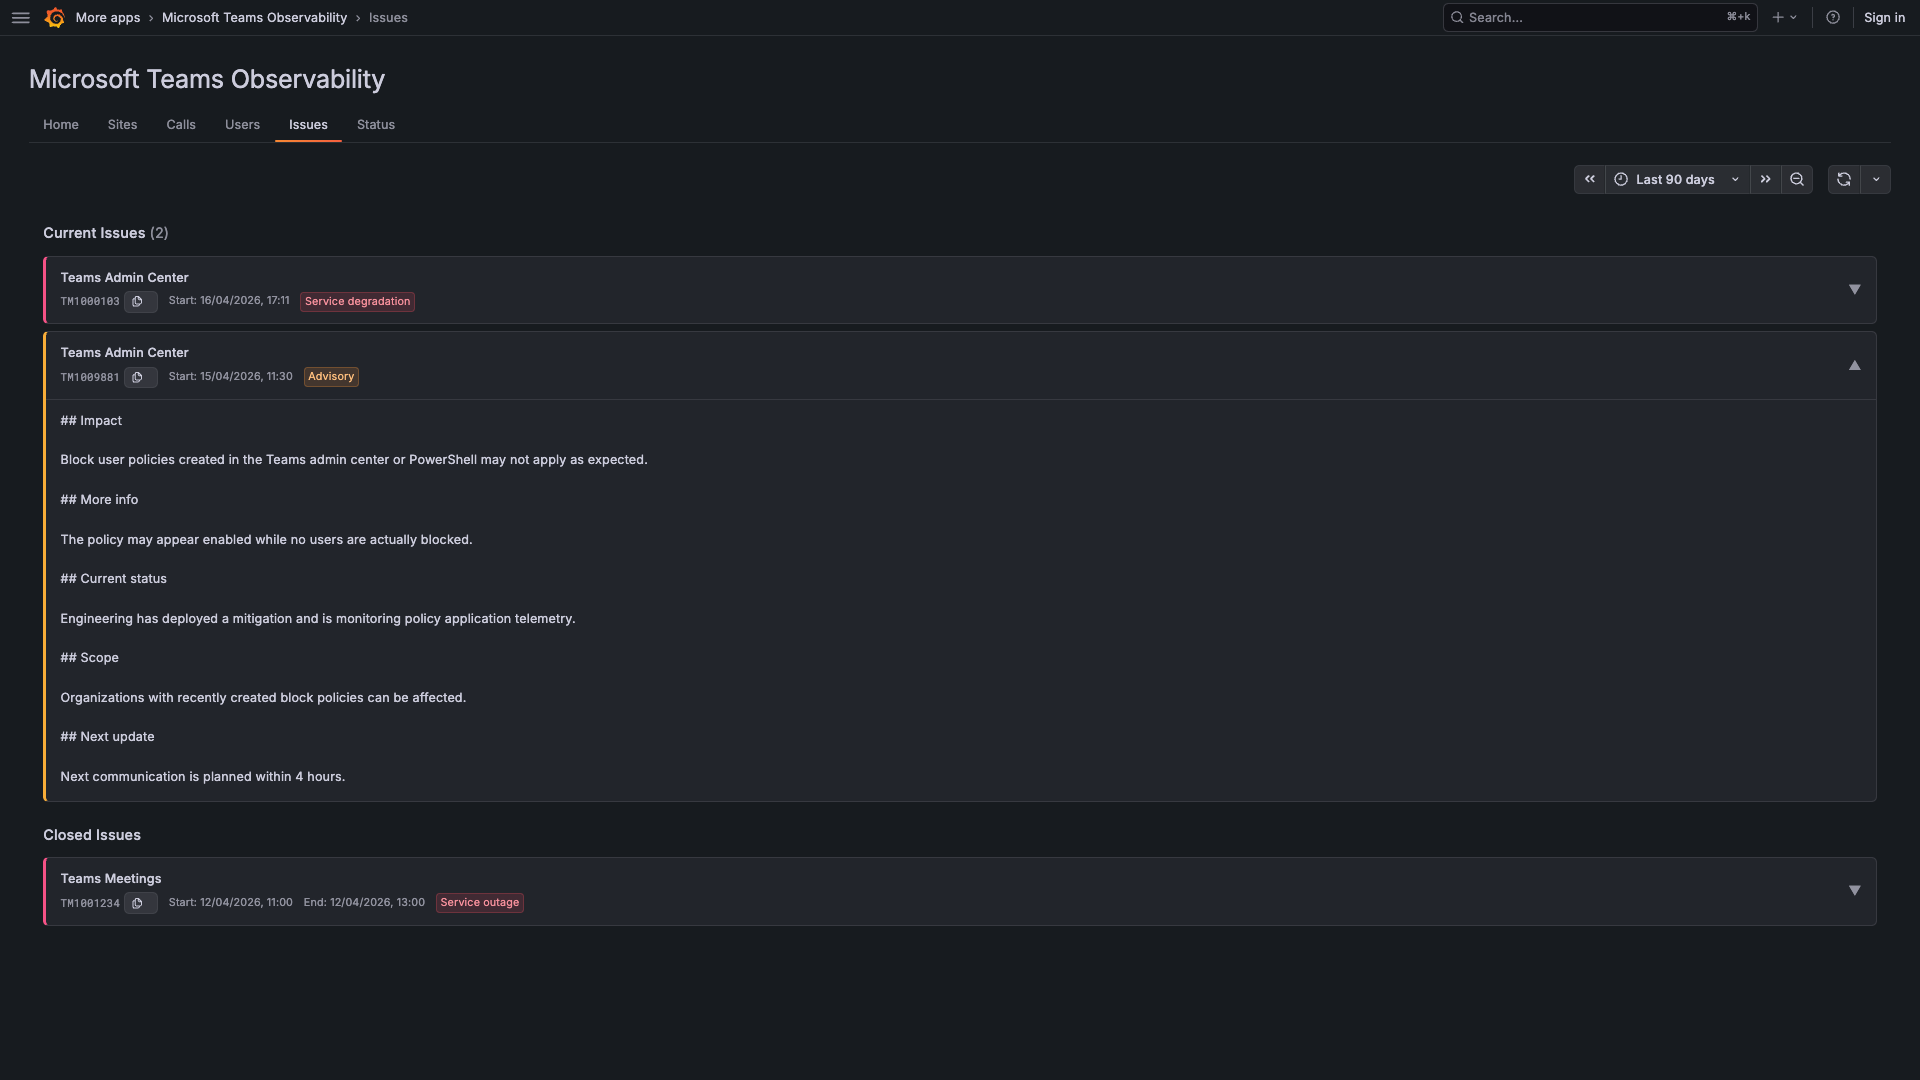
Issues
Displays Microsoft 365 service health incidents affecting the tenant, including active and recently resolved issues with severity, start time, title, and copyable issue ID, helping correlate degradations with known Microsoft outages.
Configuration
Central configuration area for the application, including:
- License management
- Demo mode toggle
- Loki datasource selection and connection test
- Microsoft Graph integration test
- Domain allow / block filters
- Subnet mappings upload (CSV)
- Application permissions and access control
Operating Modes
The application supports two operating modes:
- Demo Mode — uses built-in sample data with multiple realistic scenarios (peer-to-peer, group calls, good / poor / unclassified quality, bot detection, mobile switching) and can be used immediately after installation
- Live Mode — uses real tenant data sent by the collector and stored in the configured Loki datasource
This makes it possible to evaluate the UI and workflows before switching to production data.
Related Components
Teams Observability Agent
Collector project used to send Microsoft Teams observability data to Loki:
Support
Issues and feature requests can be submitted by opening a GitHub Issue on the plugin repository or by contacting Phenisys directly (contact@phenisys.com).
Grafana Cloud Free
- Free tier: Limited to 3 users
- Paid plans: $55 / user / month above included usage
- Access to all Enterprise Plugins
- Fully managed service (not available to self-manage)
Self-hosted Grafana Enterprise
- Access to all Enterprise plugins
- All Grafana Enterprise features
- Self-manage on your own infrastructure
Install on Grafana Cloud
Plugins can be installed directly from within your Grafana instance or automated using the Cloud API or Terraform.
Learn more about plugin installationMarketplace plugins
This is a paid plugin developed by a marketplace partner. To purchase an entitlement, sign in first, then fill out the contact form.
Get this plugin
This is a paid for plugin developed by a marketplace partner. To purchase entitlement please fill out the contact us form.
What to expect:
- Grafana Labs will reach out to discuss your needs
- Payment will be taken by Grafana Labs
- Once purchased the plugin will be available for you to install (cloud) or a signed version will be provided (on-premise)
Thank you! We will be in touch.
For more information, visit the docs on plugin installation.
Installing on a local Grafana:
For local instances, plugins are installed and updated via a simple CLI command. Plugins are not updated automatically, however you will be notified when updates are available right within your Grafana.
1. Install the Application
Use the grafana-cli tool to install Microsoft Teams Observability from the commandline:
grafana-cli plugins install The plugin will be installed into your grafana plugins directory; the default is /var/lib/grafana/plugins. More information on the cli tool.
Alternatively, you can manually download the .zip file for your architecture below and unpack it into your grafana plugins directory.
Alternatively, you can manually download the .zip file and unpack it into your grafana plugins directory.
2. Enable it
Next, log into your Grafana instance. Navigate to the Plugins section, found in your Grafana main menu.
Click the Apps tabs in the Plugins section and select the newly installed app.
To enable the app, click the Config tab. Follow the instructions provided with the application and click Enable. The app and any new UI pages are now accessible from within the main menu, as designed by the app creator.
If dashboards have been included with the application, they will attempt to be automatically installed. To view the dashboards, re-import or delete individual dashboards, click the Dashboards tab within the app page.
Changelog
1.2.1 (2026-07-15)
Bug fixes:
- Fix packaging: the 1.2.0 archive only shipped
darwin_arm64andlinux_arm64backend binaries. The plugin now ships backend binaries for all 6 supported platforms (linux/amd64, linux/arm64, linux/arm, darwin/amd64, darwin/arm64, windows/amd64), for both the app backend and the nested Teams datasource backend, restoring compatibility with Grafana Cloud (amd64).
1.2.0 (2026-06-16)
⚠️ Breaking changes / migration:
- Plugin ID renamed
phenisyslab-msteamsobservability-app→phenisys-msteamsobservability-app. Grafana treats the new ID as a separate plugin, so v1.0.x installations are not auto-upgraded — see "Upgrading from v1.0.x" in the README for migration steps.
Security & privacy:
- GeoIP enrichment (Call Map) now has an explicit enable/disable toggle in Configuration, and the third-party data egress to ip-api.com is documented in the README and on the Configuration page.
- Bump Go toolchain to 1.26.4 to pick up standard-library security fixes (CVE-2026-27145, CVE-2026-42504, CVE-2026-42507).
- Stop logging the tenant-identifying Microsoft Graph token-endpoint URL on connectivity-test failures.
Features:
- Add QoE Call Overview layout: Verdict → Evidence → Participants → Streams → Network → Endpoint → Advanced
- Add Network Evidence section (transport distribution, relay usage, public egress and ASN, shared IP patterns)
- Add per-participant health matrix with connection type, protocol, egress ASN, relay region, stream count, and endpoint signals
- Enhance Sites page with KPI summary (total sites, NPA compliance, call quality, latency, packet loss, sites at risk), NPA compliance breakdown, and call quality distribution charts
Bug fixes:
- Fix call overview links from Users page — time range (from/to) now preserved when navigating from recent calls
- Fix filter links from Users page to Calls page — time range preserved
- Fix SubnetMappings state indicator — "Unsaved changes" no longer shown after CSV upload
Documentation:
- Add Datasource configuration table in README (Loki URL, tenant, auth, service_name, timeout)
1.0.1 (2026-06-12)
Bug fixes:
- Fix datasource logo path in Grafana plugin catalog (teams.svg referenced with correct relative path)
1.0.0 (2026-04-28)
Initial release on Grafana Plugin Catalog.