Plugins 〉Nominal


Nominal
Nominal
Bring Nominal time-series data into Grafana dashboards and Explore, with template-variable support for asset, data scope, and channel selectors. Use it to search Nominal assets, pick data scopes and channels, and visualize numeric, string, and log channels alongside the rest of your Grafana telemetry.
Requirements
- Grafana 12.1 or later.
- A Nominal API key.
- Access to a Nominal API endpoint, such as
https://api.gov.nominal.io/api.
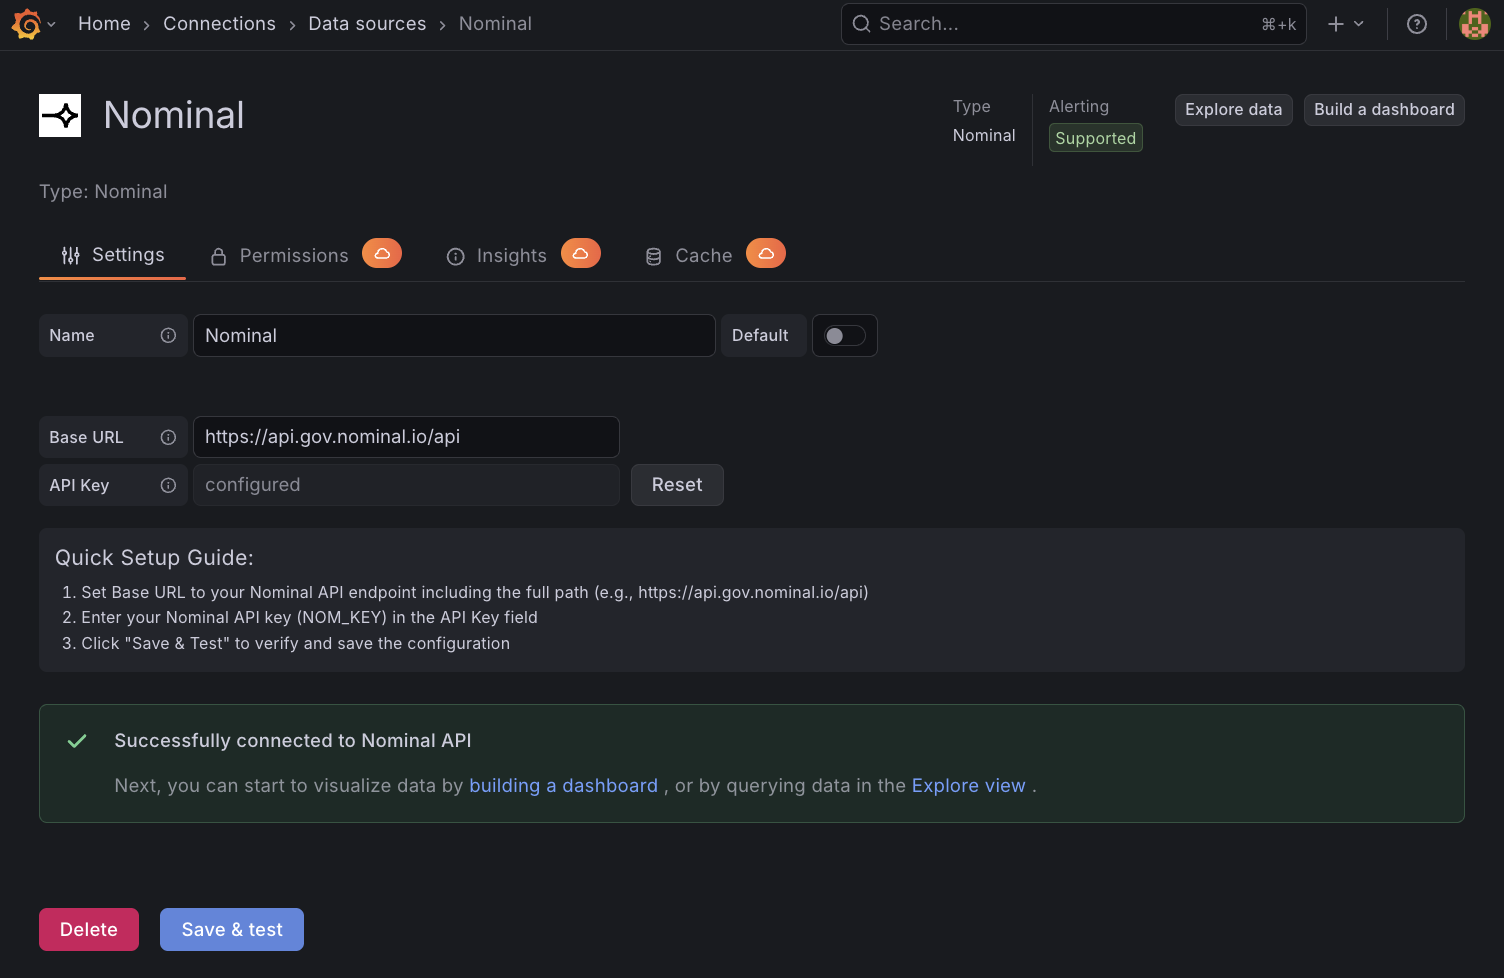
Install and configure
- In Grafana, go to Connections > Data sources.
- Add the Nominal data source.
- Set Base URL to your Nominal API endpoint, including the
/apipath. - Enter your Nominal API key in API Key.
- Select Save & test.
Grafana stores the API key as an encrypted secret and uses it only from the backend plugin, so it's never exposed to the browser. The health check verifies that Grafana can reach Nominal and authenticate with the configured key.
Query basics
The query editor follows a three-step pattern:
- Search for an asset by name, or paste a Nominal resource identifier (RID).
- Pick a data scope from the asset.
- Pick a channel from the data scope.
Queries can be used in any Grafana panel or in Explore.
Channel types
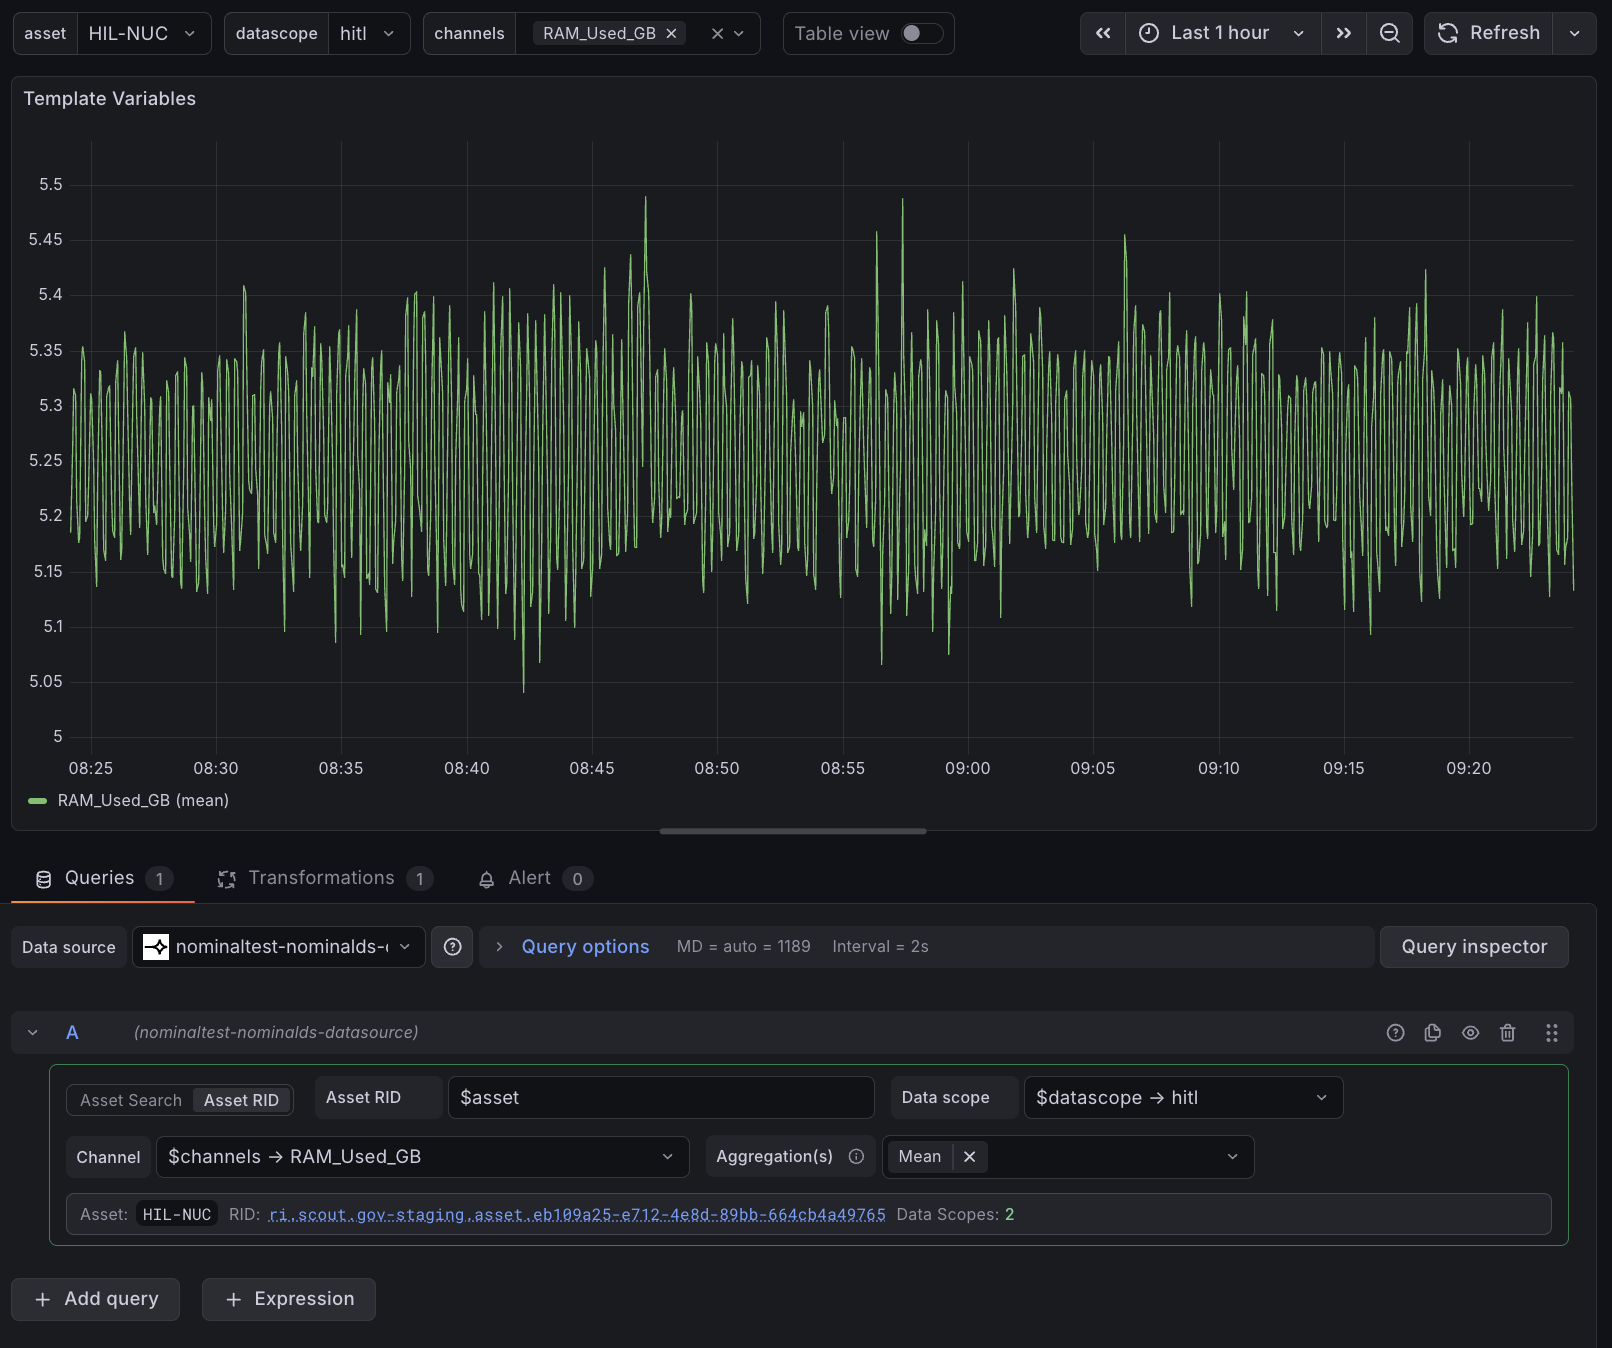
Numeric
Most physical telemetry: temperatures, pressures, currents, vibration amplitudes.
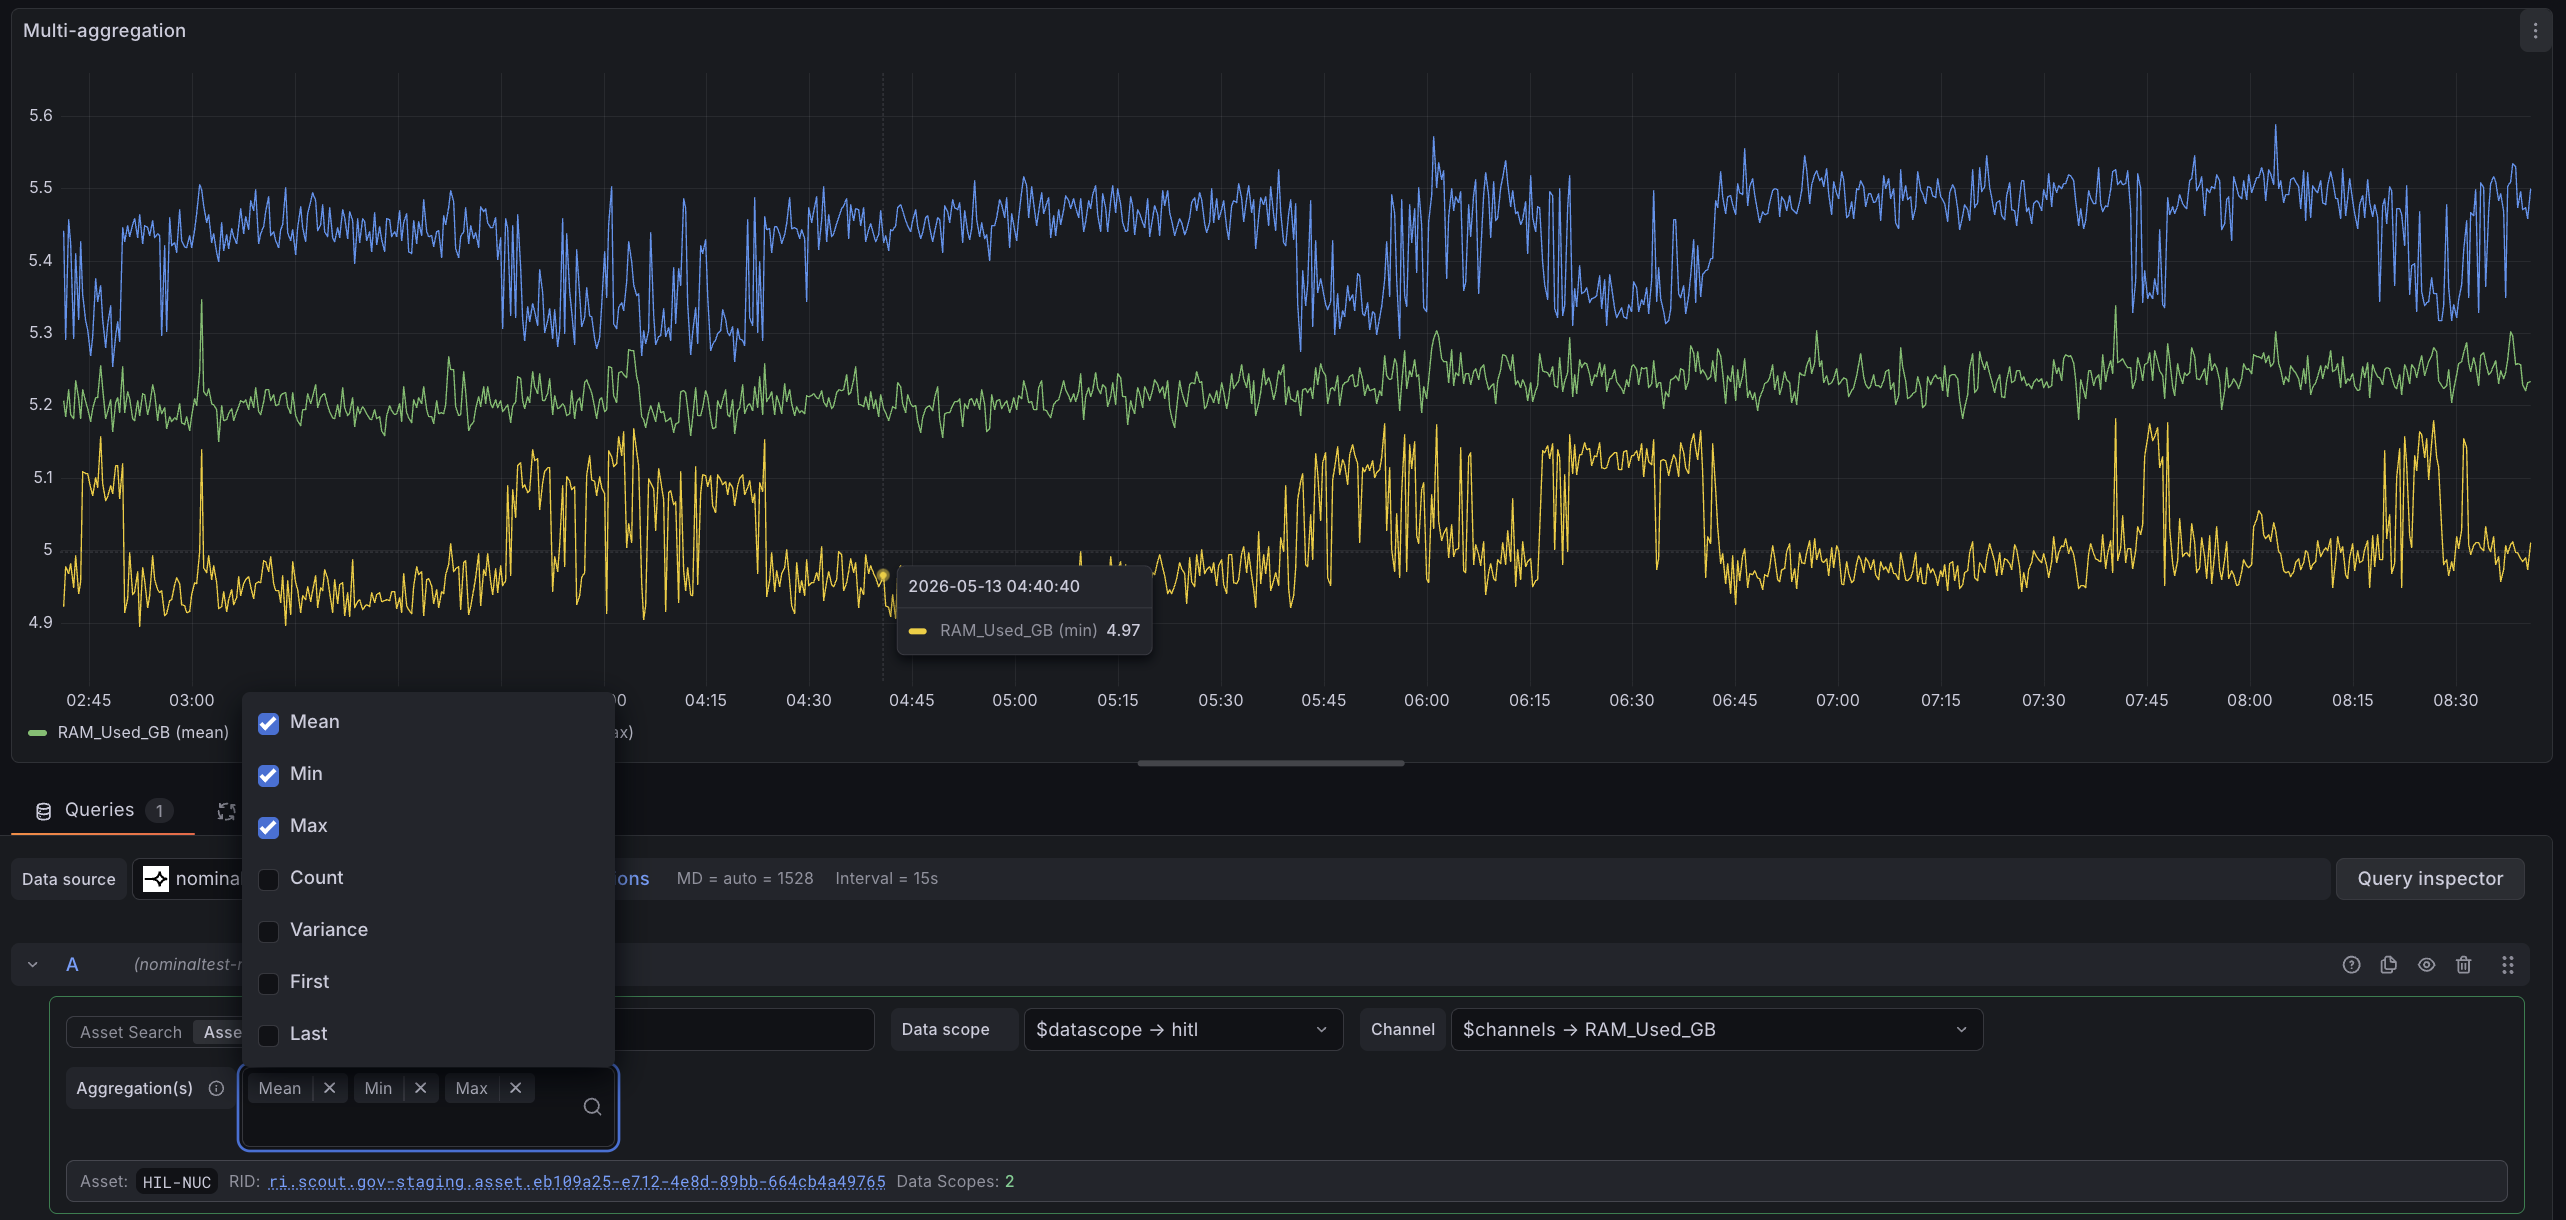
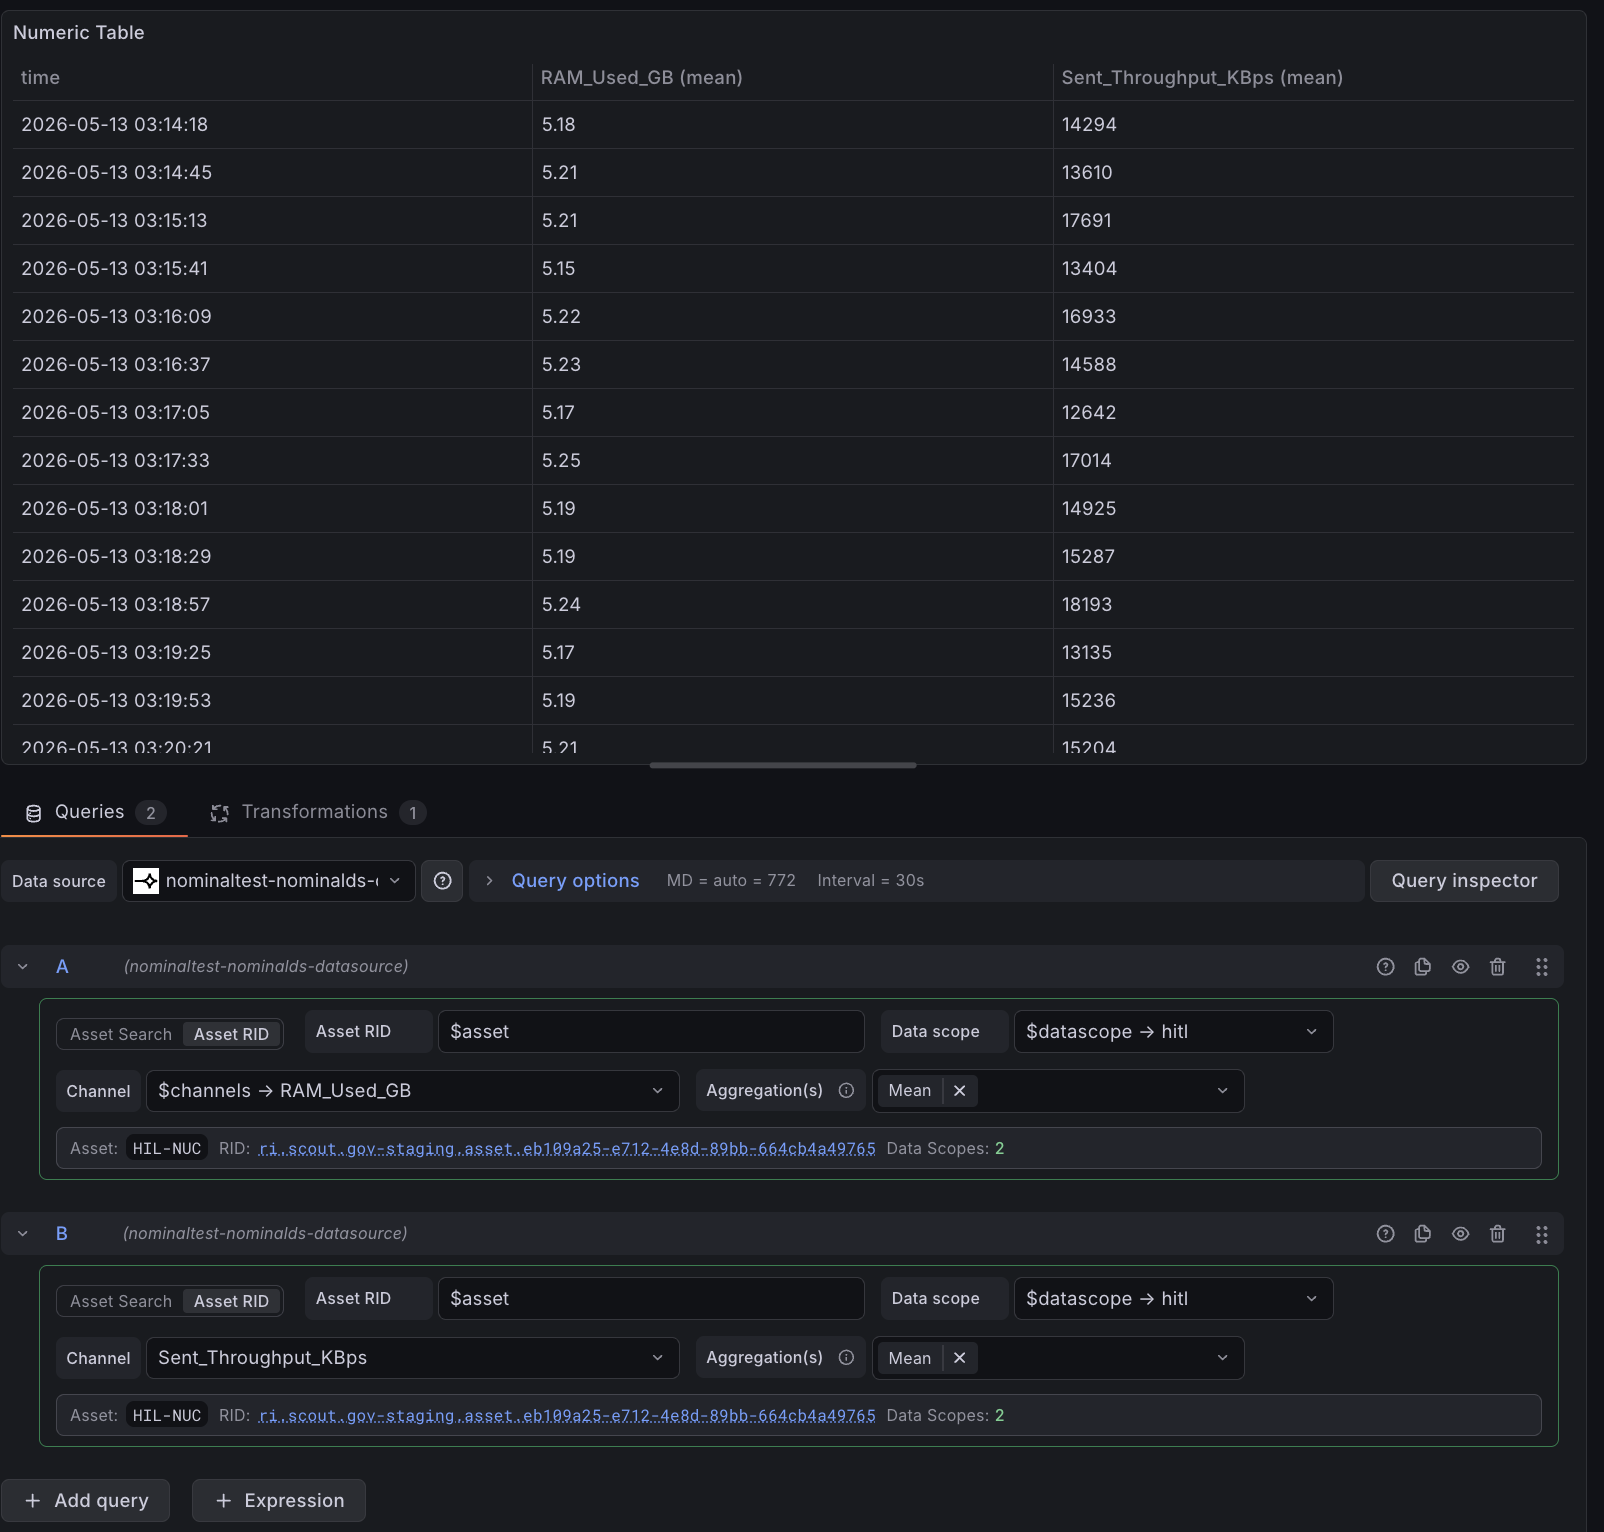
Numeric channels expose an Aggregation(s) picker. Each selected aggregation is computed per time bucket and returned as its own series:
- Mean — overall shape and trend. The default, and what most line charts want.
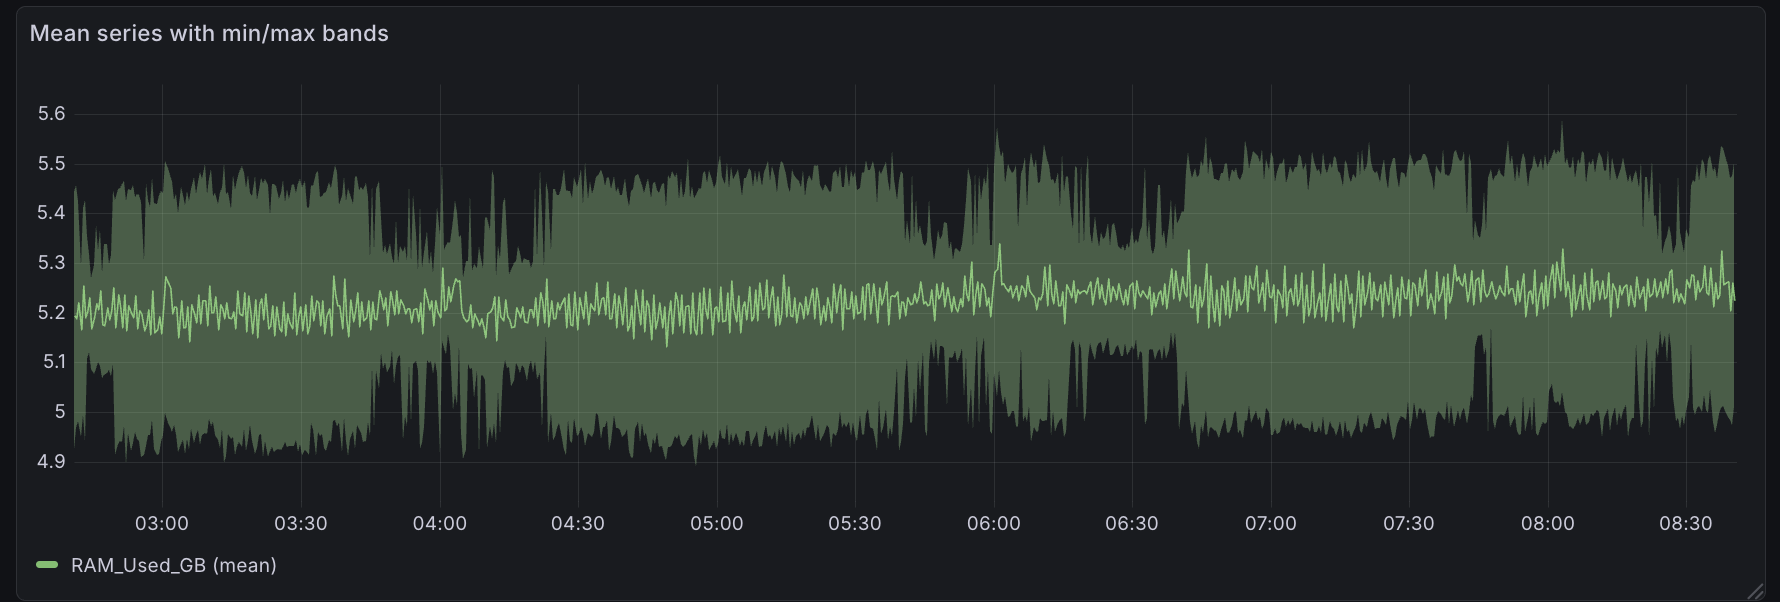
- Min / Max — catch extrema that a mean smooths away. Pair with Mean to render a banded series (min/max envelope around the mean).
- First / Last — the actual first or last sample value (and its real timestamp) inside each bucket, not a derived statistic. Use when you need a true
(value, time)pair for sparse signals, or to correlate precisely with external events. - Count — number of samples per bucket. Useful for sanity-checking decimation, spotting gaps, or detecting changes in sample rate.
- Variance — within-bucket spread. Flags noisy or unstable intervals without leaving the panel.
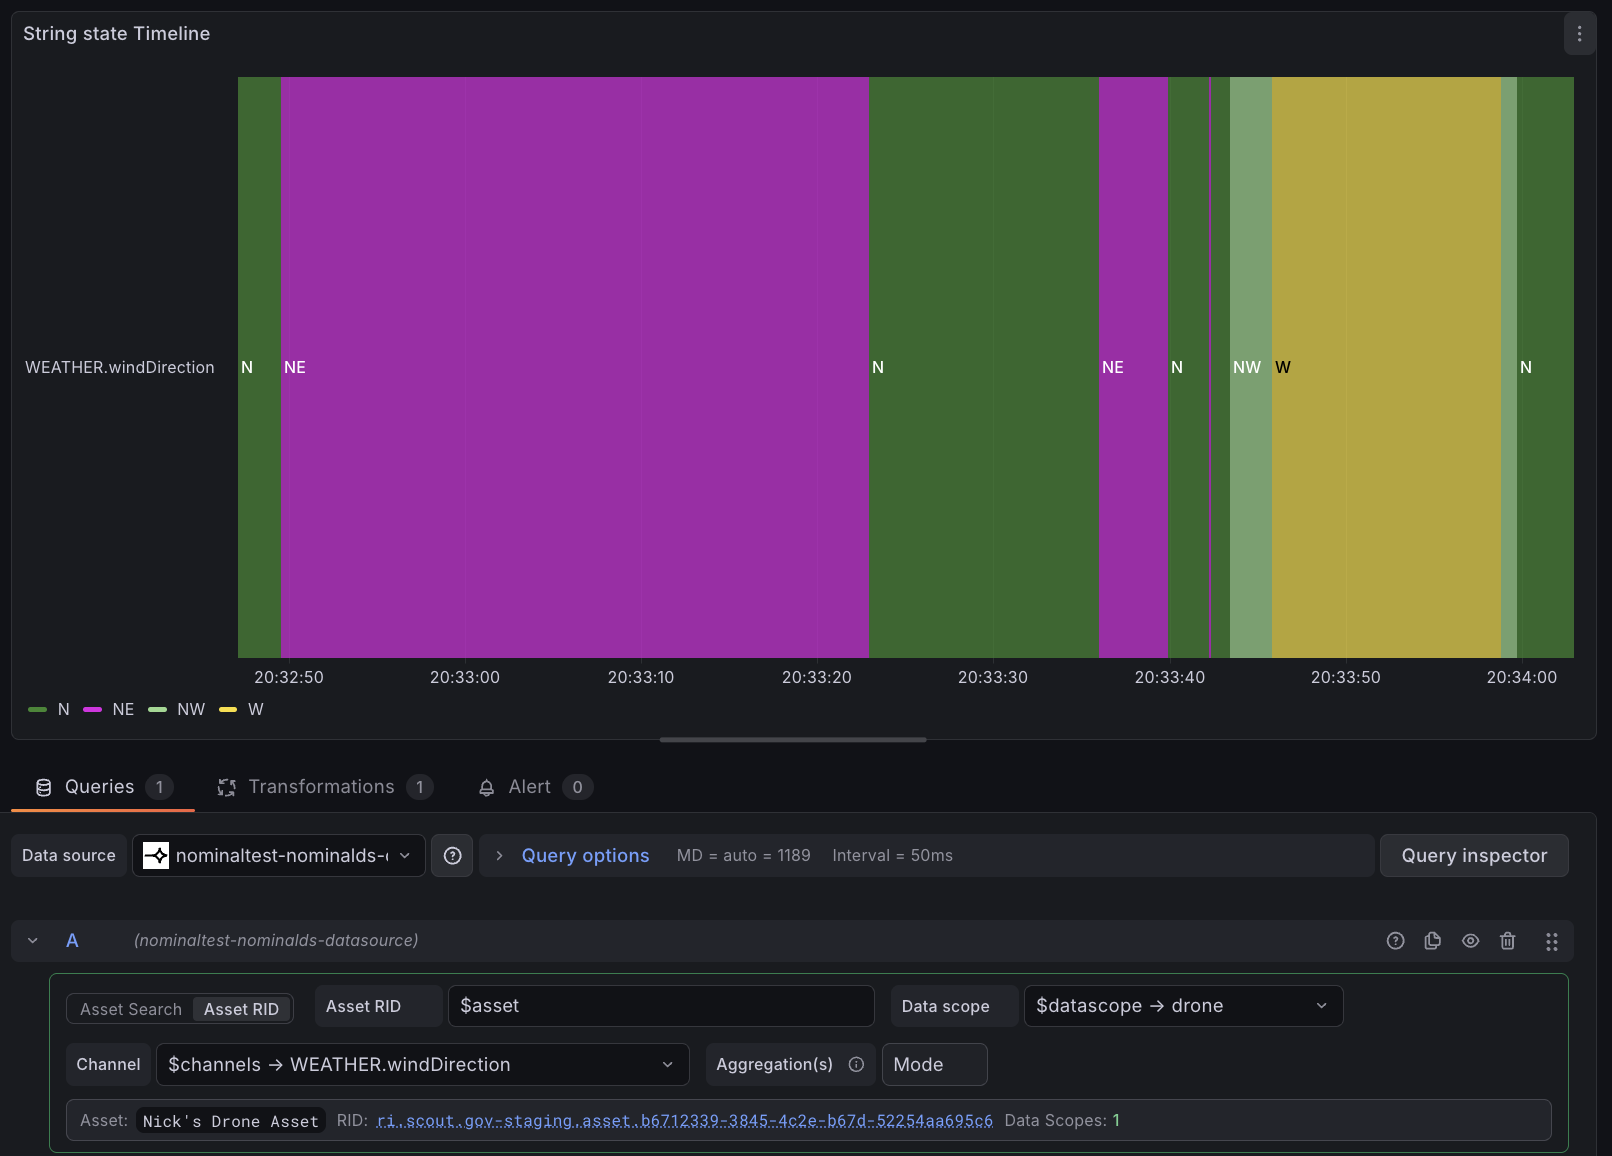
String channels always aggregate by Mode (the most-frequent value in each bucket); the aggregation picker doesn't apply. Log channels return raw entries without aggregation.
Selecting multiple aggregations at once returns each as its own series, so a single Time series panel can render min, max, and mean as three lines. To turn the same selection into a shaded min/max envelope around the mean, add a Grafana Fill below to field override on the min series (filling to max), which produces a banded view without changing the query. For exact values, spot-checks, or embedding numbers inside summary dashboards, swap the visualization to a Table panel.
Numeric channels carry their unit from Nominal, so axes and tooltips render with the correct symbol and scaling (for example, °C, psi, m/s). Symbols outside Grafana's built-in unit registry are appended verbatim as a suffix.
String
Categorical telemetry: states, modes, fault codes.
A State Timeline panel colors each segment by string value over time, making state transitions visible at a glance. It's the right default for any signal that spends meaningful time in each state. For infrequent transitions or audit-style readouts, a Table panel reads more cleanly, with one row per value change and its timestamp.
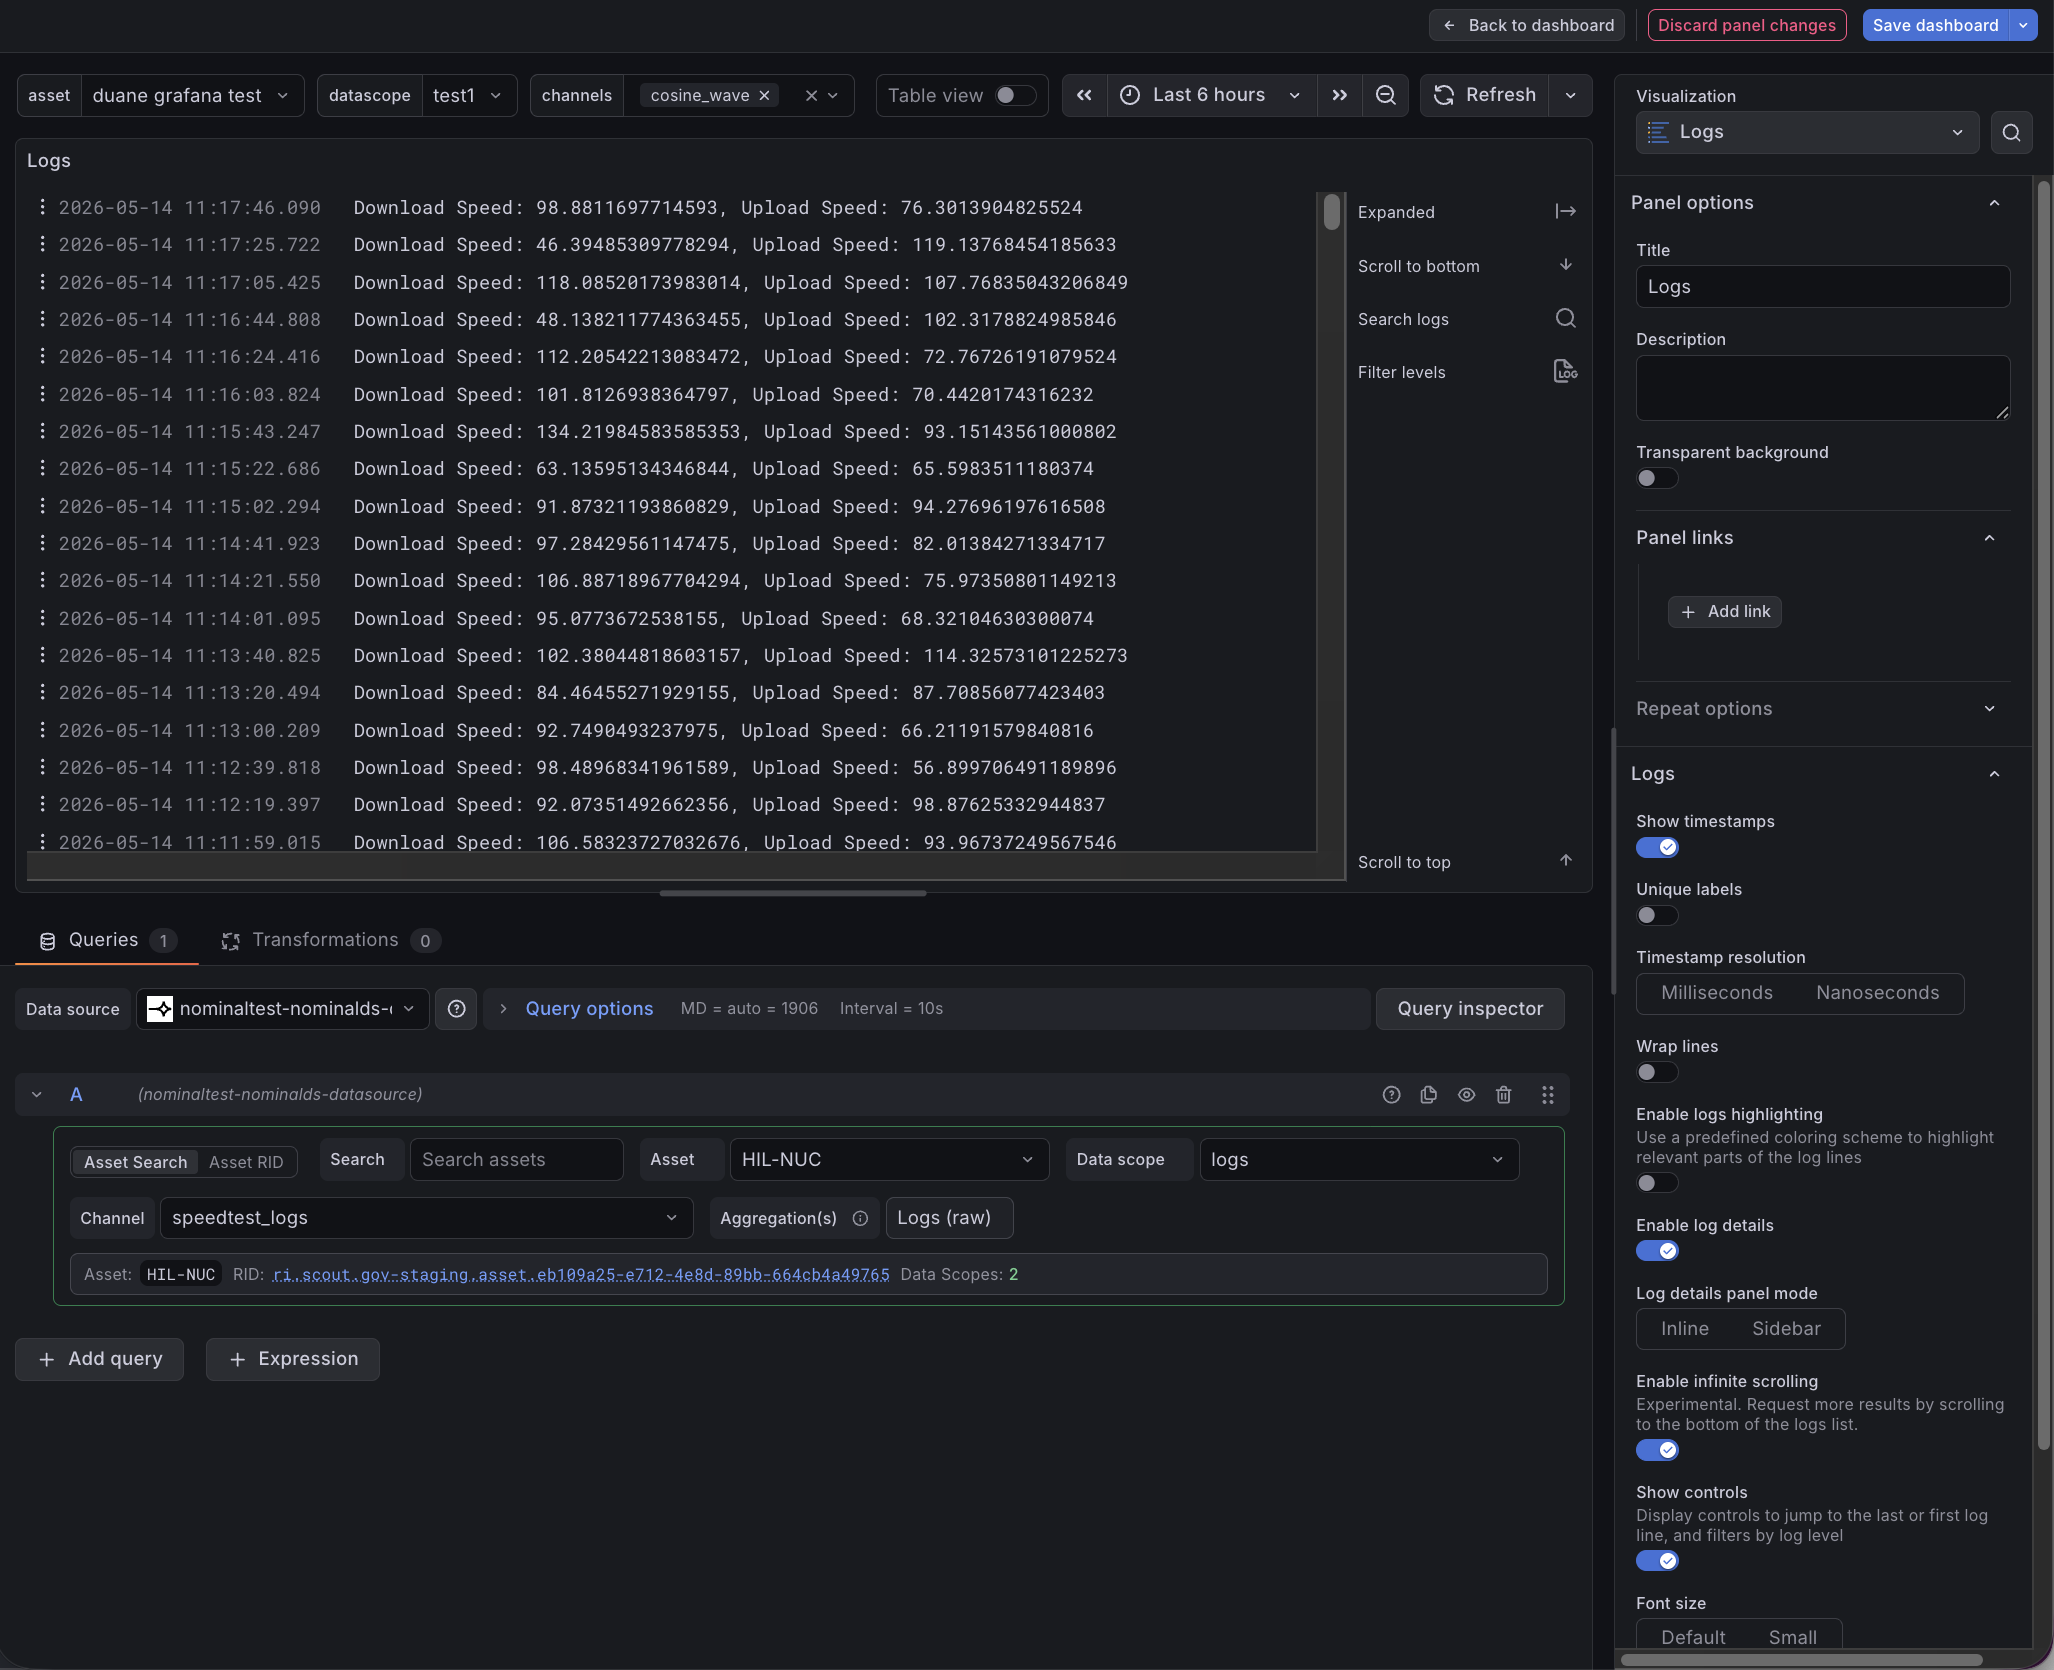
Log
Event-style records with a message field. Grafana's Logs panel renders Nominal log records inline with other telemetry from the same dashboard; pair it with a numeric or string panel for an at-a-glance correlation between signals and logs.
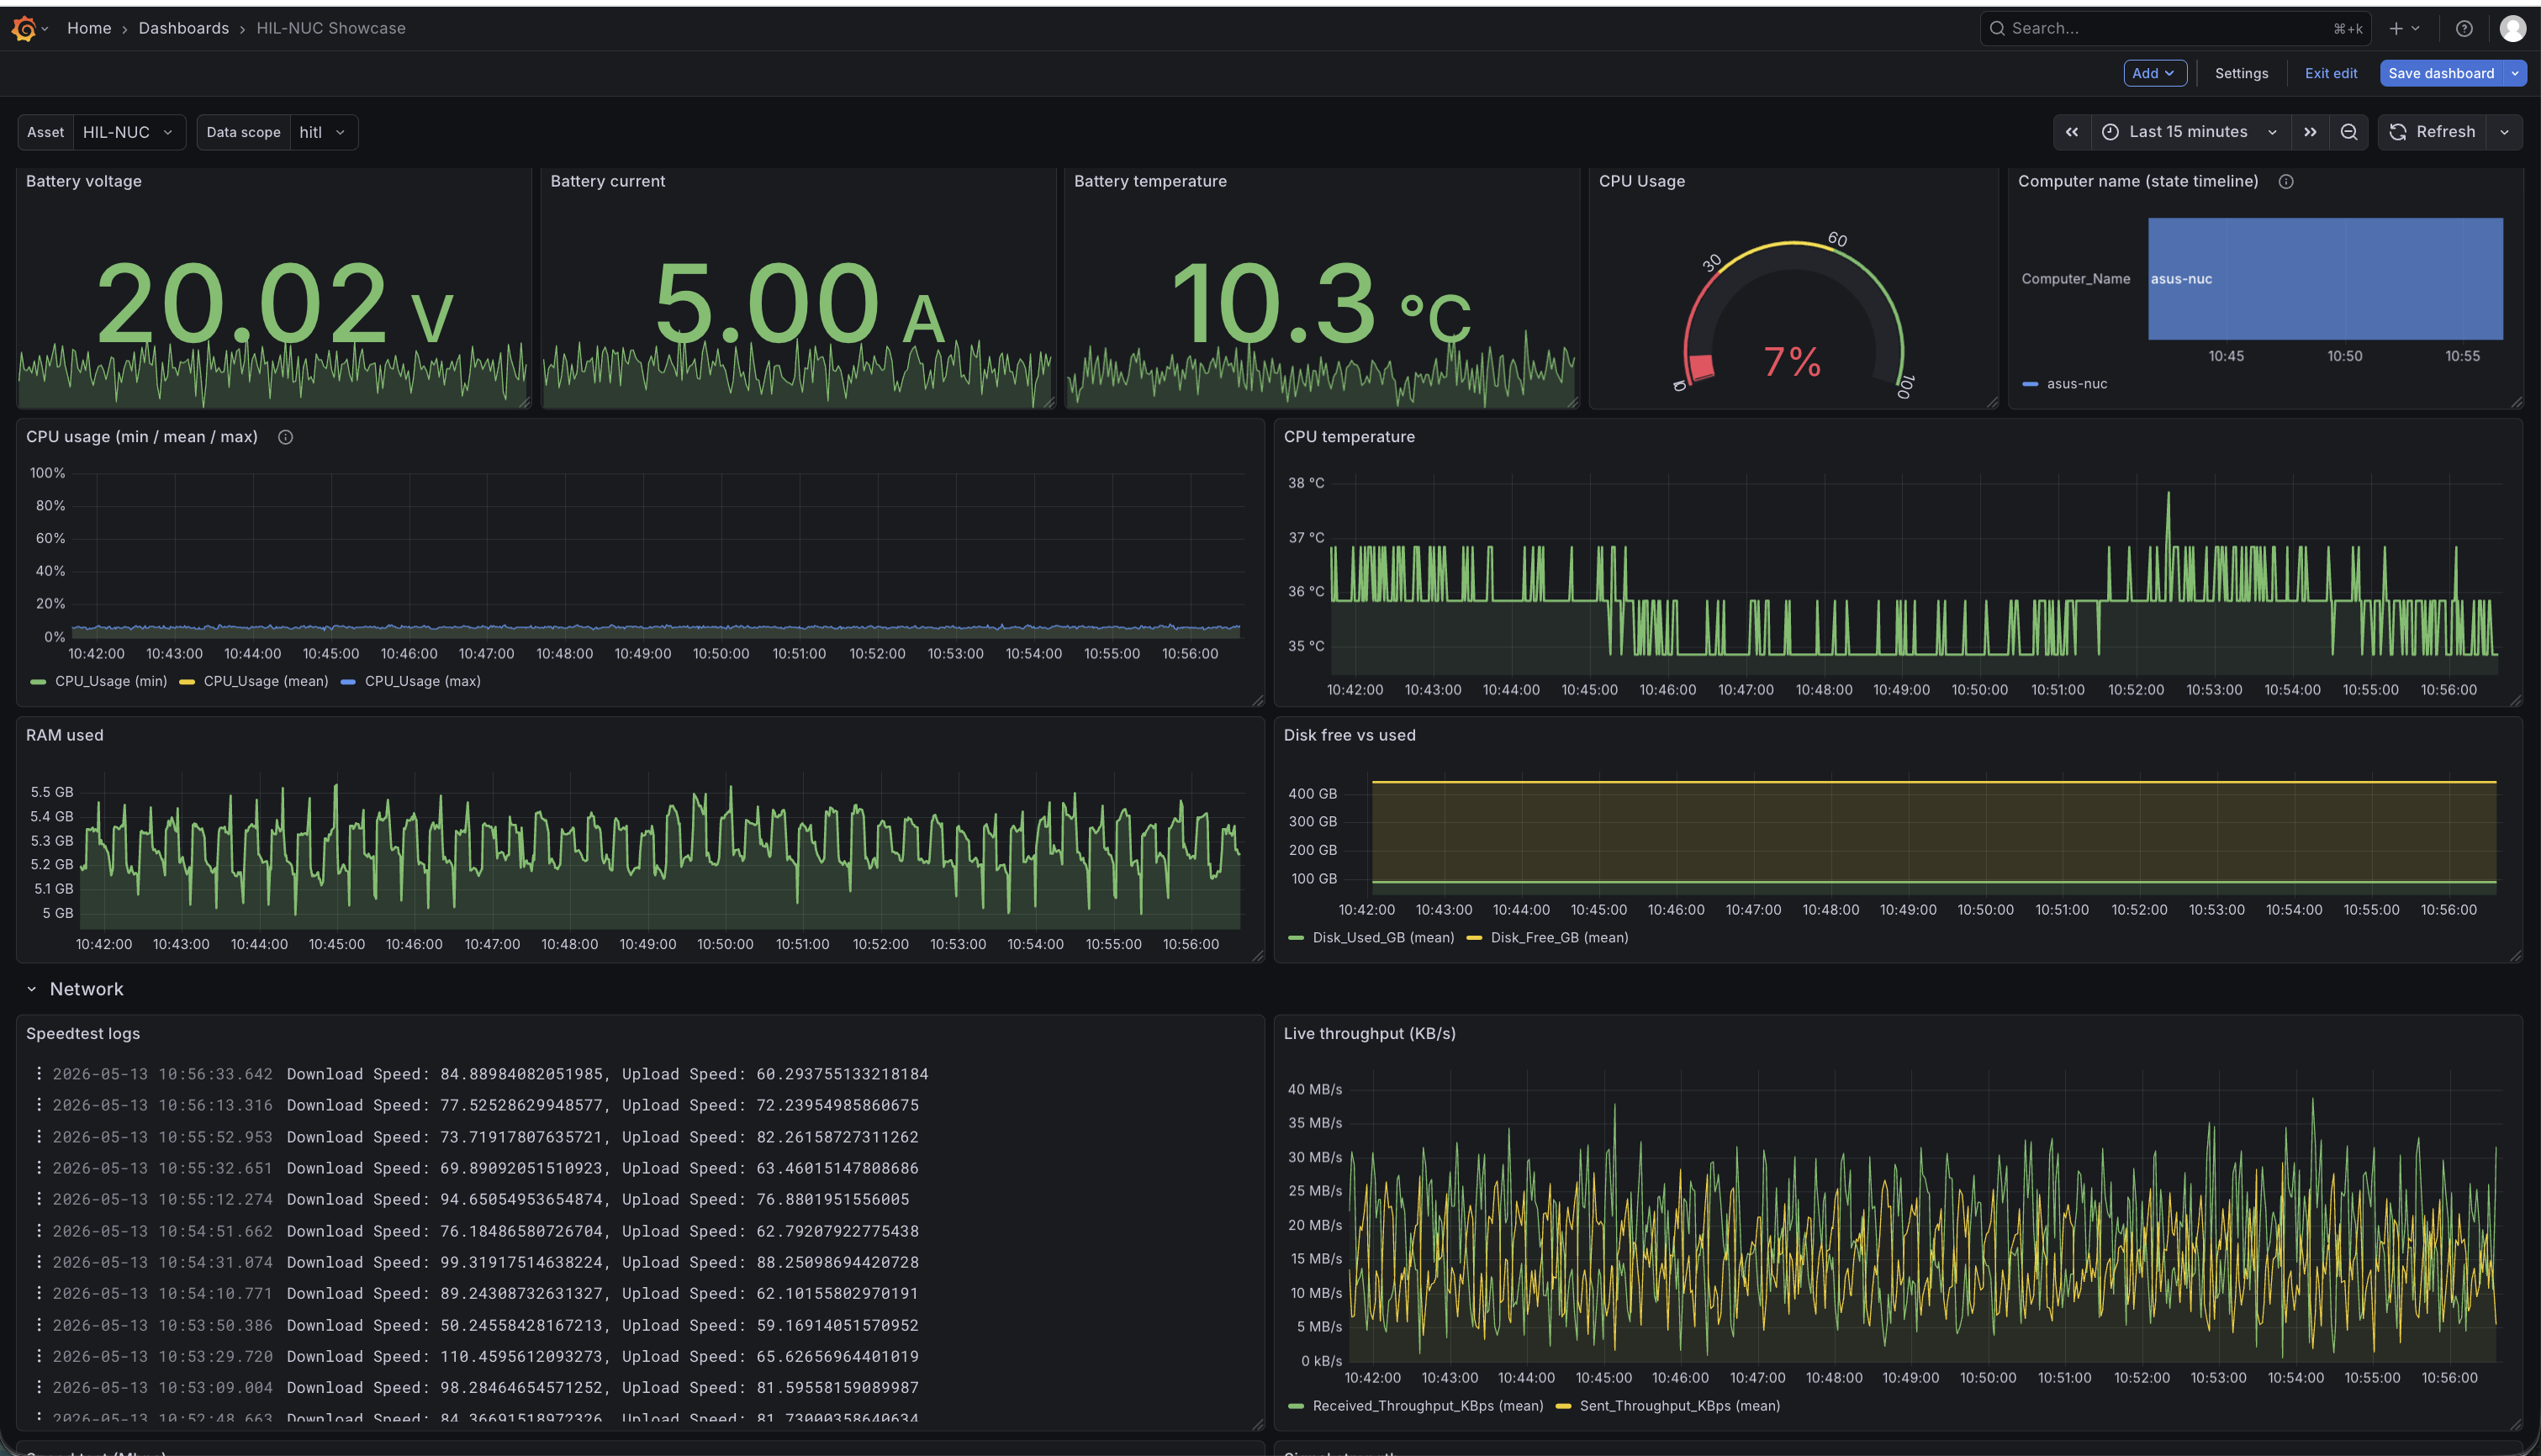
Dashboards and template variables
Nominal supports Grafana dashboard variables for assets, data scopes, and channels, so dashboards can be re-pointed at a different asset, data scope, or channel without editing every panel individually.
Where to define variable queries
- Open your dashboard and click the gear icon, then Variables.
- Select New variable.
- Set Type to Query.
- Set Data source to your Nominal data source.
- In the Query field, enter one of the strings below (for example,
assets). - Click Run query to preview, then Apply.
Chain variables by referencing earlier ones with ${var}. For example, define asset first, then a datascope variable whose query is datascopes(${asset}). Grafana re-runs the child query whenever the parent changes.
Variable queries
assetsreturns every asset in the workspace. Use it as the top variable in an asset-driven dashboard built from scratch.assets(engine)returns assets matching the search textengine. Matching is case-insensitive, tolerates minor typos, and looks at the asset's name, description, labels, and properties — soengine,engines, andenigneall findEngine 1. Use this to scope a dashboard to a fleet or family when your assets share a naming pattern —assets(turbine),assets(pack),assets(vehicle).datascopes(${asset})returns every data scope on the selected asset. Chain it directly under anassetsvariable so the data scope dropdown refreshes when the user picks a different asset.channels(${asset})returns the union of channel names across all data scopes on the selected asset, deduplicated by name. Most useful when your asset has a single primary data scope, or when your fleet uses a consistent scope name that you can pin as a literal in each panel's data scope field. If channels with the same name exist in multiple scopes, the variable shows the name once — the actual data returned depends on which scope is set in each panel.channels(${asset}, ${datascope})returns channels filtered to the selected asset and data scope. This is the canonical pattern for production dashboards: pick an asset, pick its data scope, then pick a channel scoped to that pair.
Common patterns
Single-asset multi-channel monitoring. One named asset, several panels, no template variables. Each panel shows one or more channels from the asset's data scopes. This is the most common layout for a dedicated operations dashboard like "Test stand monitoring", "Motor qualification", or "Vehicle road test".
Single-asset deep-dive. Three chained variables (assets, datascopes(${asset}), channels(${asset}, ${datascope})) drive every panel. Switching the asset cascades through scopes and channels automatically. Use this when you want one reusable dashboard that works for any asset with the same data scope and channel schema.
Fleet view. One filtered asset variable (e.g. assets(engine)) set to multi-value, plus channels(${asset}) for a flat channel picker. Each panel shows the same channel as multiple series, one per selected asset. This pattern assumes every asset in the fleet exposes the same channel under the same data scope name; pin that scope as a literal in each panel's Data scope field rather than parameterizing it.
Per-channel panel repeat. A multi-value channel variable (channels(${asset}, ${datascope}) set to multi-value) combined with Grafana's panel Repeat options clones one panel per selected channel. The dashboard grows or shrinks based on the number of channels selected. The same repeat trick works on a multi-value asset variable when you want one panel per asset instead of one panel with multiple series.
Troubleshooting
- If Save & test fails, confirm that the Base URL includes the
/apipath and that the API key is valid. - If asset or channel search fails, confirm that the data source can reach Nominal and that the API key has access to the requested data.
Known limitations
- Annotations are not yet supported.
Links
- Nominal: https://www.nominal.io/
- Documentation: https://docs.nominal.io/
- Source repository: https://github.com/nominal-io/grafana-plugin-public
Grafana Cloud Free
- Free tier: Limited to 3 users
- Paid plans: $55 / user / month above included usage
- Access to all Enterprise Plugins
- Fully managed service (not available to self-manage)
Self-hosted Grafana Enterprise
- Access to all Enterprise plugins
- All Grafana Enterprise features
- Self-manage on your own infrastructure
Install on Grafana Cloud
Plugins can be installed directly from within your Grafana instance or automated using the Cloud API or Terraform.
Learn more about plugin installationMarketplace plugins
This is a paid plugin developed by a marketplace partner. To purchase an entitlement, sign in first, then fill out the contact form.
Get this plugin
This is a paid for plugin developed by a marketplace partner. To purchase entitlement please fill out the contact us form.
What to expect:
- Grafana Labs will reach out to discuss your needs
- Payment will be taken by Grafana Labs
- Once purchased the plugin will be available for you to install (cloud) or a signed version will be provided (on-premise)
Thank you! We will be in touch.
For more information, visit the docs on plugin installation.
Installing on a local Grafana:
For local instances, plugins are installed and updated via a simple CLI command. Plugins are not updated automatically, however you will be notified when updates are available right within your Grafana.
1. Install the Data Source
Use the grafana-cli tool to install Nominal from the commandline:
grafana-cli plugins install The plugin will be installed into your grafana plugins directory; the default is /var/lib/grafana/plugins. More information on the cli tool.
Alternatively, you can manually download the .zip file for your architecture below and unpack it into your grafana plugins directory.
Alternatively, you can manually download the .zip file and unpack it into your grafana plugins directory.
2. Configure the Data Source
Accessed from the Grafana main menu, newly installed data sources can be added immediately within the Data Sources section.
Next, click the Add data source button in the upper right. The data source will be available for selection in the Type select box.
To see a list of installed data sources, click the Plugins item in the main menu. Both core data sources and installed data sources will appear.
Changelog
0.13.0 (2026-07-07)
Features
Bug Fixes
Chores
- add plugin provenance attestation (#90) (b0859fa)
- deps: patch vulnerable transitive dependencies (#92) (ff10382)
- update Go toolchain to 1.26.4 (#102) (71f1849)
- update grafana go sdk (#94) (b321bb5)
0.12.2 (2026-05-22)
Bug Fixes
Chores
0.12.1 (2026-05-21)
Chores
0.12.0 (2026-05-21)
Features
Bug Fixes
Chores
- refresh plugin catalog README and screenshots (#69) (a5672dd)
- User-Agent identification and improved error tracing (#72) (d32bc34)
0.11.3 (2026-05-04)
Bug Fixes
0.11.2 (2026-05-04)
Bug Fixes
0.11.1 (2026-05-01)
Bug Fixes
0.11.0 (2026-04-30)
Features
Bug Fixes
0.10.0 (2026-04-22)
Features
Bug Fixes
0.9.2 (2026-04-11)
Bug Fixes
- replace hardcoded styles with Grafana useTheme2() design tokens (#48) (82fa1a2)
- sanitize error responses and remove fallback HTTP client (#49) (d7ca9cf)
0.9.1 (2026-04-09)
Bug Fixes
0.9.0 (2026-04-02)
Features
Bug Fixes
- pin flatted to >= 3.4.2 to resolve CVE-2026-33228 (#39) (8131185)
- scope QueryEditor animation styles and switch direct backend HTTP calls to the SDK client (#32) (4ebfa0e)
- stop leaking caller headers through proxy (#31) (a9f8827)
0.8.0 (2026-03-19)
Features
Bug Fixes
- cache asset and channel lookups in inferMissingChannelDataType (backend) (#34) (beae629)
- CVE-2026-32141 (#30) (a813b82)
- infer string channel types for templated queries (#27) (76aea57)
- use grafana's maxDataPoints to improve query performance (#33) (dd2c1e1)
Chores
0.7.0 (2026-03-10)
Features
0.6.0 (2026-02-28)
Features
- add string/enum channel support (#17) (e74505d)
- add template variable support for assets, data scopes, and channels; drop RID from series name (#8) (0039a1e)
Bug Fixes
- deps: update github.com/nominal-io/nominal-api-go digest to 89e4ad6 (#11) (52e17d2)
- update compute API imports from scout/compute/api to scout/compute/api1 (#19) (5bb74df)
0.5.1 (2026-02-26)
Bug Fixes
- change renovate config (dd8c0e6)
- fetch channel options dynamically on search input instead of loading static paginated list on asset selection (#15) (515824e)
- force minimatch ^10.2.4 for CVE (#16) (557f881)