Plugins 〉Grafana Yamcs JAOPS


Grafana Yamcs JAOPS
Grafana Plugin for the Yamcs Mission Control Software
A Grafana plugin to directly connect to the Yamcs server, display telemetry, send commands, and more!
This plugin is engineered for high reliability to be used in Mission Control Centers and anywhere Yamcs is used. The current version has already been tested in real-world deployments but active development continues and community feedback and contributions are very welcome.
Development led by JAOPS: providing Mission Control software, tools and training for spacecraft in orbit and rovers on the Moon!
Features
Multiplexed Endpoint Support – Designed to handle complex setups with multiple Yamcs endpoints through a robust multiplexer system. Supports scaling to many Grafana clients efficiently by multiplexing the connections to Yamcs: the same data is only requested once.
Modular and Scalable Architecture – Clean separation of concerns and a solid backend structure built for reliability and flexibility.
Image Panel – Visualize real-time images from Yamcs or overlay data on static images (e.g. spacecraft layouts, maps).
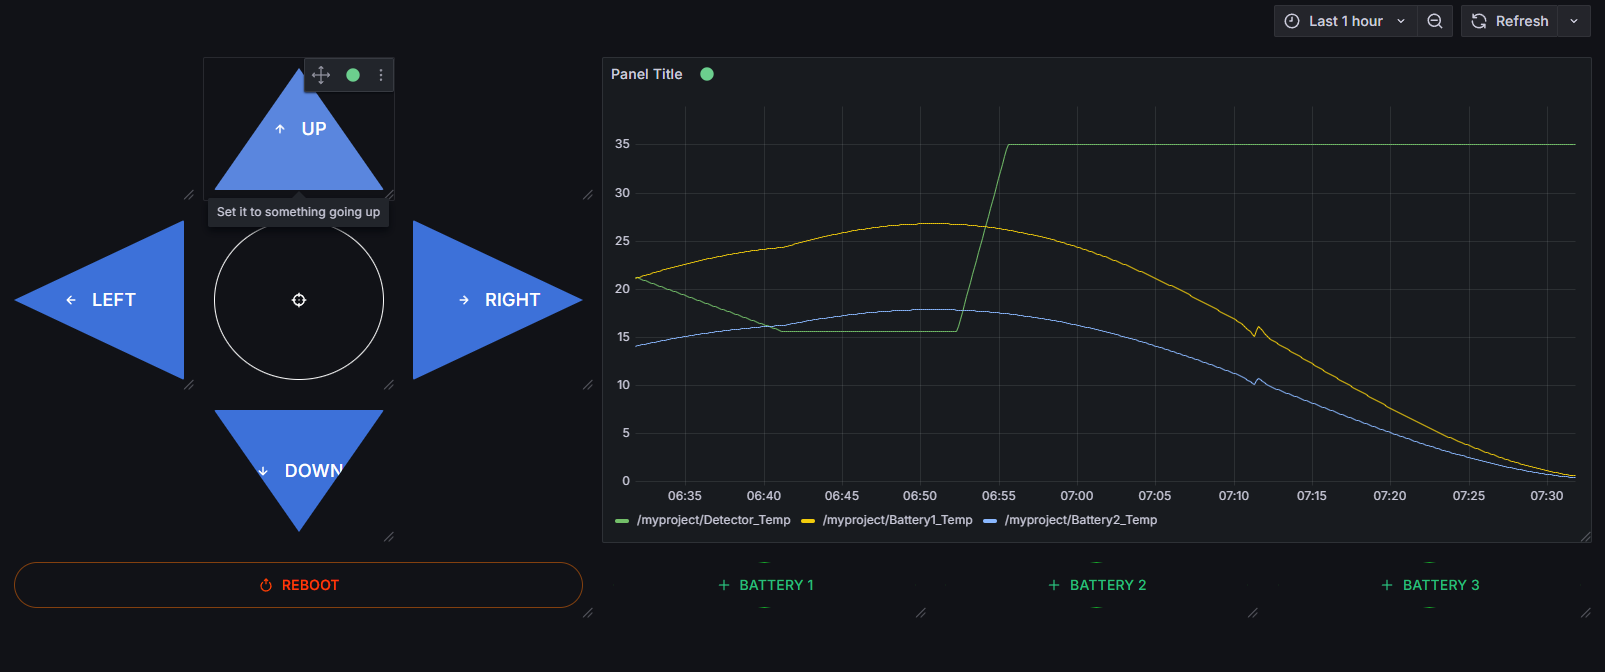
Commanding Panel – Issue commands via Grafana panels with fully customizable buttons, supporting arguments, comments, and endpoint targeting. Use the Command History Panel to keep track of commands sent, arguments and acknowledgements.
Intuitive UI/UX – Clean and simple user interface designed to be easy to use, even for non-experts. Displays endpoint availability and WebSocket status in real-time, ensuring quick diagnostics. Every aspect of the plugin is configurable through Grafana's settings.

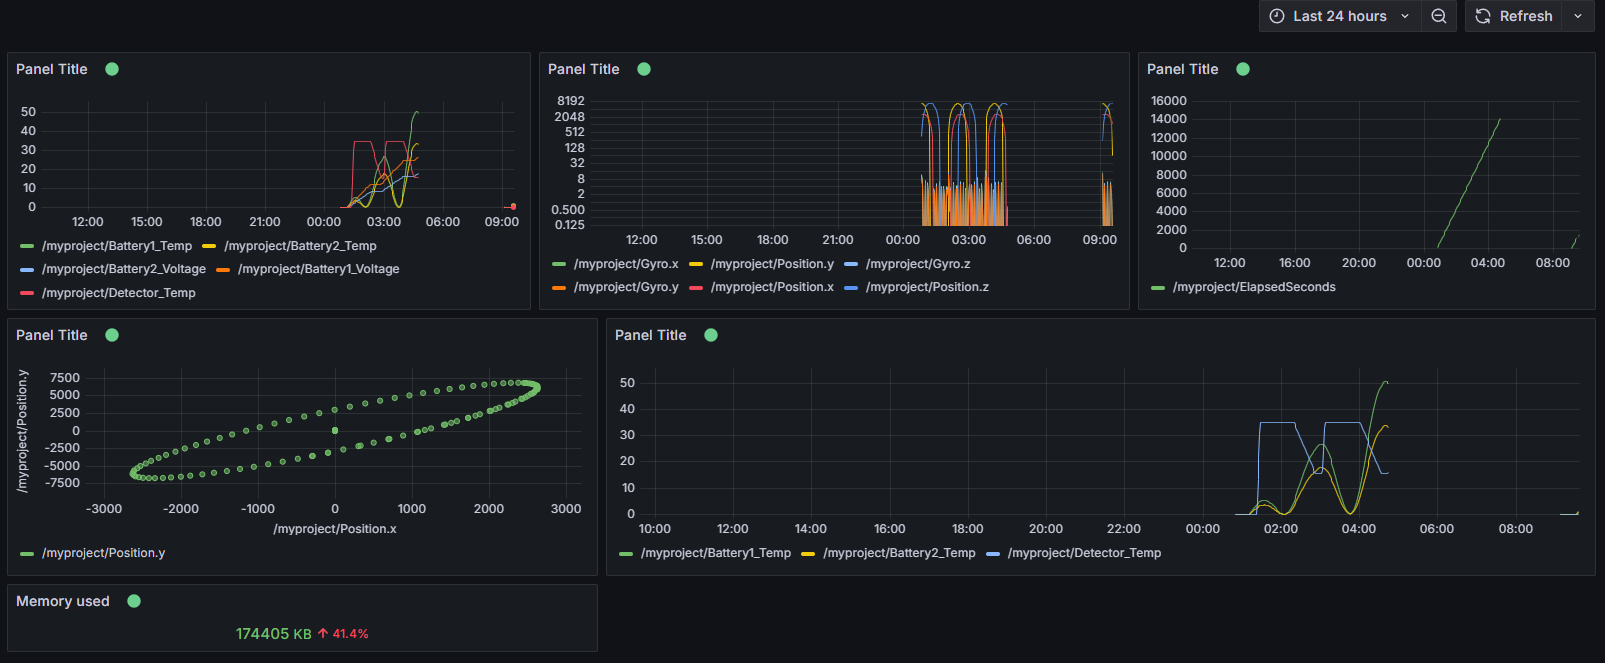
Example Grafana Dashboard Connected to Yamcs
Demo Dashboards are provisioned in provisioning/dashboards, they showcase the main capabilities of the plugin connected to the Yamcs quickstart server configuration.
To get started, clone the yamcs-quickstart repository and run in three separate terminals:
git clone https://github.com/jaops-space/yamcs-quickstart.git
cd yamcs-quickstart
./mvn yamcs:run
python simulator.sh
pip install -r simulator/images/requirements.txt
python simulator/images/generate_images.py
Then launch grafana, configure the datasource for Yamcs and open the Demo Dashboard:


The plugin itself includes helpful tutorials for each panel. Access them via the main navigation menu (on the left side)
Documentation and Contributing
Check out the open-source GitHub repository for the latest features and documentation. Community feedback and contributions are very welcome!
Grafana Cloud Free
- Free tier: Limited to 3 users
- Paid plans: $55 / user / month above included usage
- Access to all Enterprise Plugins
- Fully managed service (not available to self-manage)
Self-hosted Grafana Enterprise
- Access to all Enterprise plugins
- All Grafana Enterprise features
- Self-manage on your own infrastructure
Install on Grafana Cloud
Plugins can be installed directly from within your Grafana instance or automated using the Cloud API or Terraform.
Learn more about plugin installationMarketplace plugins
This is a paid plugin developed by a marketplace partner. To purchase an entitlement, sign in first, then fill out the contact form.
Get this plugin
This is a paid for plugin developed by a marketplace partner. To purchase entitlement please fill out the contact us form.
What to expect:
- Grafana Labs will reach out to discuss your needs
- Payment will be taken by Grafana Labs
- Once purchased the plugin will be available for you to install (cloud) or a signed version will be provided (on-premise)
Thank you! We will be in touch.
For more information, visit the docs on plugin installation.
Installing on a local Grafana:
For local instances, plugins are installed and updated via a simple CLI command. Plugins are not updated automatically, however you will be notified when updates are available right within your Grafana.
1. Install the Application
Use the grafana-cli tool to install Grafana Yamcs JAOPS from the commandline:
grafana-cli plugins install The plugin will be installed into your grafana plugins directory; the default is /var/lib/grafana/plugins. More information on the cli tool.
Alternatively, you can manually download the .zip file for your architecture below and unpack it into your grafana plugins directory.
Alternatively, you can manually download the .zip file and unpack it into your grafana plugins directory.
2. Enable it
Next, log into your Grafana instance. Navigate to the Plugins section, found in your Grafana main menu.
Click the Apps tabs in the Plugins section and select the newly installed app.
To enable the app, click the Config tab. Follow the instructions provided with the application and click Enable. The app and any new UI pages are now accessible from within the main menu, as designed by the app creator.
If dashboards have been included with the application, they will attempt to be automatically installed. To view the dashboards, re-import or delete individual dashboards, click the Dashboards tab within the app page.
Changelog
1.0.0 (Unreleased)
Initial release.