Plugins 〉Zscaler ZPA


Zscaler ZPA


Zscaler ZPA Data Source Plugin for Grafana
Description
The Zscaler ZPA Data Source Plugin is a Grafana backend datasource plugin that enables querying and visualization of Zscaler Private Access (ZPA) infrastructure health and security policy data directly in Grafana panels.
Zscaler Private Access is a cloud-native zero trust network access solution. The plugin connects to the Zscaler ZPA API to retrieve app connectors, service edges, cloud connector groups, access policy rules, application segments, server groups, and connector groups.
Features
- Query and visualize Zscaler ZPA data directly within Grafana
- Support for multiple resource types:
- App Connectors: Operational status, channel health, version, and location
- Service Edges: ZPA Private Service Edge status and version details
- Cloud Connector Groups: Group metadata and connector counts
- Access Policy Rules: Policy rules across multiple policy types (Access, Timeout, Client Forwarding, Inspection, Isolation, Credential)
- Application Segments: Segment configuration with domain names and port ranges
- Server Groups: Server group membership and discovery settings
- Connector Groups: App Connector Group configuration and upgrade schedules
- Point-in-time snapshot queries — all records for the selected resource are returned on each query
- OAuth2 authentication via Zscaler ZIdentity OneAPI with automatic token management
- Built-in retry logic with exponential backoff for transient failures (up to 3 attempts)
- Two pre-built dashboards for infrastructure health and security policy audit
Compatibility
| Component | Version / Detail |
|---|---|
| Grafana | >= 12.3.0 |
| Zscaler ZPA API | ZIdentity OneAPI (OAuth2) |
| Authentication | OAuth2 Client Credentials |
| Cloud Environments | PRODUCTION, BETA, GOV, GOVUS |
Visuals
Onboarding

Query Examples

Added Dashboards
Installation
Requirements
- Grafana >= 12.3.0
- A Zscaler Private Access (ZPA) tenant with API access enabled
- A Zscaler ZIdentity OneAPI OAuth2 client (Client ID and Client Secret)
- The Customer ID for your ZPA tenant
- Network connectivity from the Grafana server to your Zscaler cloud endpoint
Obtain OAuth2 Credentials
- Log in to the Zscaler ZPA portal.
- Navigate to Administration > API Key Management.
- Click Add API Key and select ZPA API as the service type.
- Copy the generated Client ID and Client Secret.
- Your Customer ID is shown in the ZPA portal under Administration > Company.
- Your Vanity Domain follows the pattern
<tenantname>.zscaler.net,<tenantname>.zscalerone.net, etc., depending on your cloud.
Install the Plugin
Grafana Cloud
Install from the Grafana plugin catalog: search for Zscaler ZPA in the Plugins section of your Grafana Cloud instance.
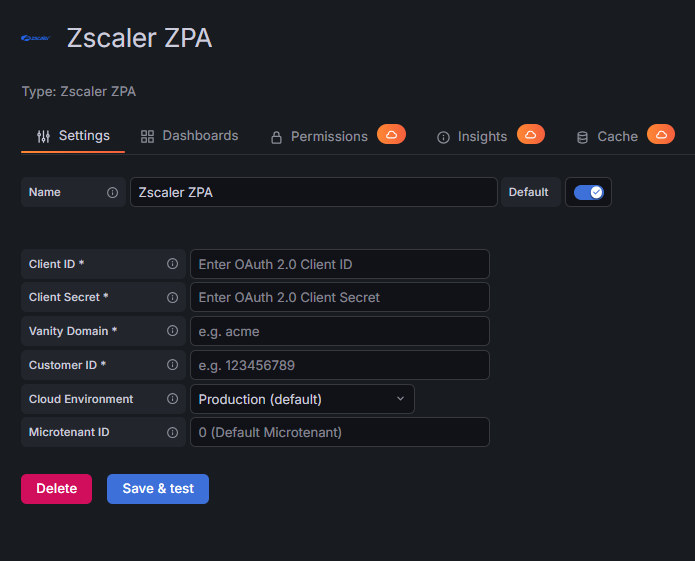
Configure the Data Source
- In Grafana, navigate to Connections > Add new connection.
- Search for Zscaler ZPA and select it.
- Fill in the required configuration fields:
| Field | Required | Description |
|---|---|---|
| Client ID | Yes | OAuth2 client ID from Zscaler ZIdentity OneAPI |
| Client Secret | Yes | OAuth2 client secret (stored encrypted) |
| Vanity Domain | Yes | Your Zscaler tenant vanity domain, e.g. acme.zscaler.net |
| Customer ID | Yes | Numeric Customer ID for your ZPA tenant (found under Administration > Company) |
| Cloud Environment | No | Zscaler cloud: PRODUCTION (default), BETA, GOV, or GOVUS |
| Microtenant ID | No | Microtenant identifier; leave as 0 for the default tenant |
- Click Save & Test. A successful result shows "Successfully connected to Zscaler ZPA".
Usage
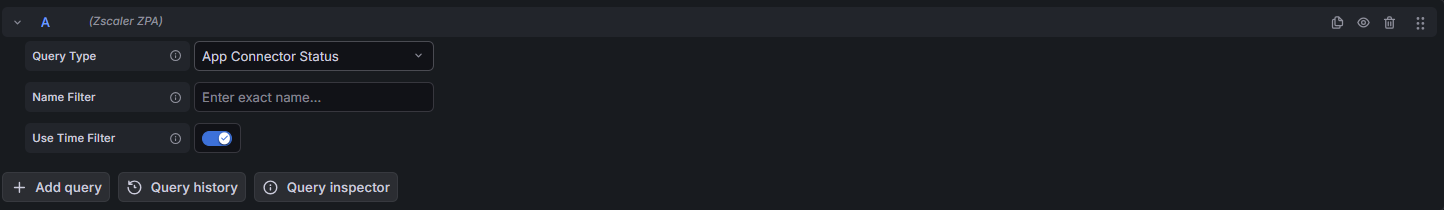
Query Editor
Once the data source is configured, you can create panels using the query editor. Each query returns a table frame with point-in-time snapshot data. There is no time-range filtering — all records for the selected resource type are returned on each query.
Available Query Types
app_connectors
Returns all App Connectors in the tenant.
Key columns: name, enabled, control_channel_status, upgrade_status, location, connector_group_name, platform, current_version, public_ip, last_connect_time, modified_time
Use the control_channel_status field to distinguish healthy (ZPN_STATUS_AUTHENTICATED) from disconnected (ZPN_STATUS_DISCONNECTED) connectors.
service_edges
Returns all Service Edges (ZPA Private Service Edges) in the tenant.
Key columns: name, enabled, control_channel_status, upgrade_status, location, service_edge_group_name, current_version, last_connect_time
cloud_connector_groups
Returns all Cloud Connector Groups.
Key columns: name, description, enabled, cloud_connectors_count, zias_count, modified_time
access_policy_rules
Returns policy rules for a selected policy type. Use the Policy Type dropdown in the Query Editor to select one of:
| Policy Type | Description |
|---|---|
Access Policy | Standard ZPA access policies (default) |
Timeout Policy | Session timeout rules |
Client Forwarding Policy | Client forwarding rules |
AppProtection Policy | App inspection rules |
Isolation Policy | Browser isolation rules |
Credential Policy | Credential-based access rules |
Key columns: name, description, action, enabled, rule_order, policy_type, operator, conditions_count, app_operands_count, modified_time
application_segments
Returns all Application Segments configured in the tenant.
Key columns: name, description, enabled, health_reporting, bypass_type, config_space, domain_names, tcp_port_ranges, udp_port_ranges, server_groups_count, modified_time
server_groups
Returns all Server Groups.
Key columns: name, description, enabled, dynamic_discovery, config_space, servers_count, applications_count, app_connector_groups_count, modified_time
connector_groups
Returns all App Connector Groups.
Key columns: name, description, enabled, city_country, country_code, location, upgrade_day, version_profile_name, dns_query_type, connectors_count, modified_time
Resources Reference
| Resource | Description | Supports Filter | Supports Time Range |
|---|---|---|---|
| App Connectors | Operational status, channel health, version, and location | No | No |
| Service Edges | ZPA Private Service Edge status and version details | No | No |
| Cloud Connector Groups | Group metadata and connector counts | No | No |
| Access Policy Rules | Policy rules across multiple policy types | No (policy type selector) | No |
| Application Segments | Segment configuration with domain names and port ranges | No | No |
| Server Groups | Server group membership and discovery settings | No | No |
| Connector Groups | App Connector Group configuration and upgrade schedules | No | No |
Included Dashboards
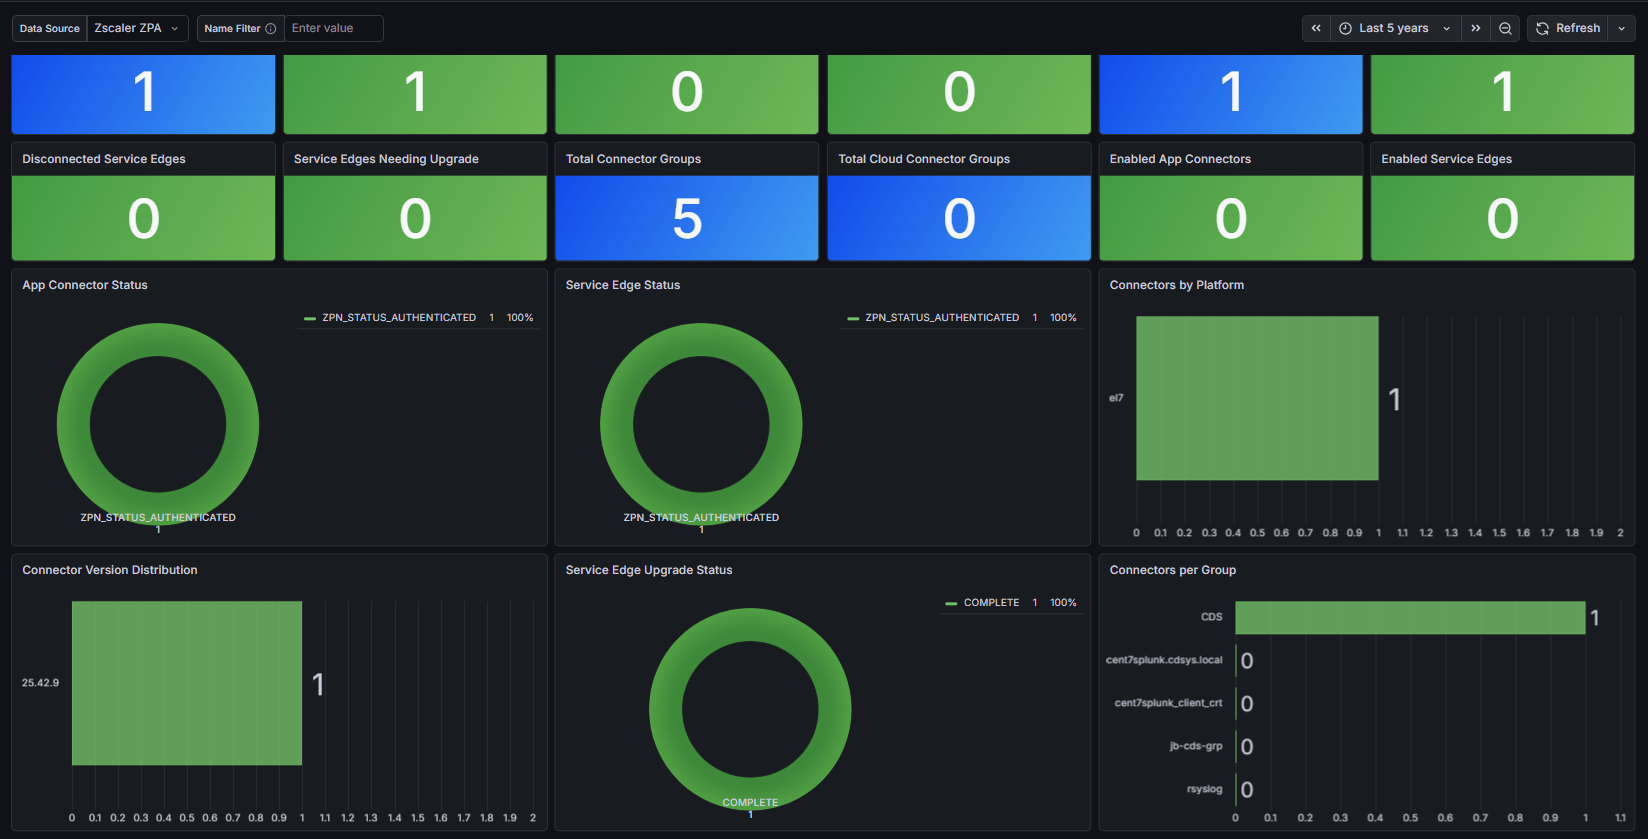
ZPA Infrastructure Health
Provides an operational view of your ZPA infrastructure:
- Stat panels: Total App Connectors, Healthy App Connectors, Disconnected App Connectors, Total Service Edges
- Pie charts: App Connectors by Control Channel Status, Service Edge Status
- Tables: App Connector Details, Service Edge Details, Cloud Connector Groups
- Bar chart: Upgrade Status Overview
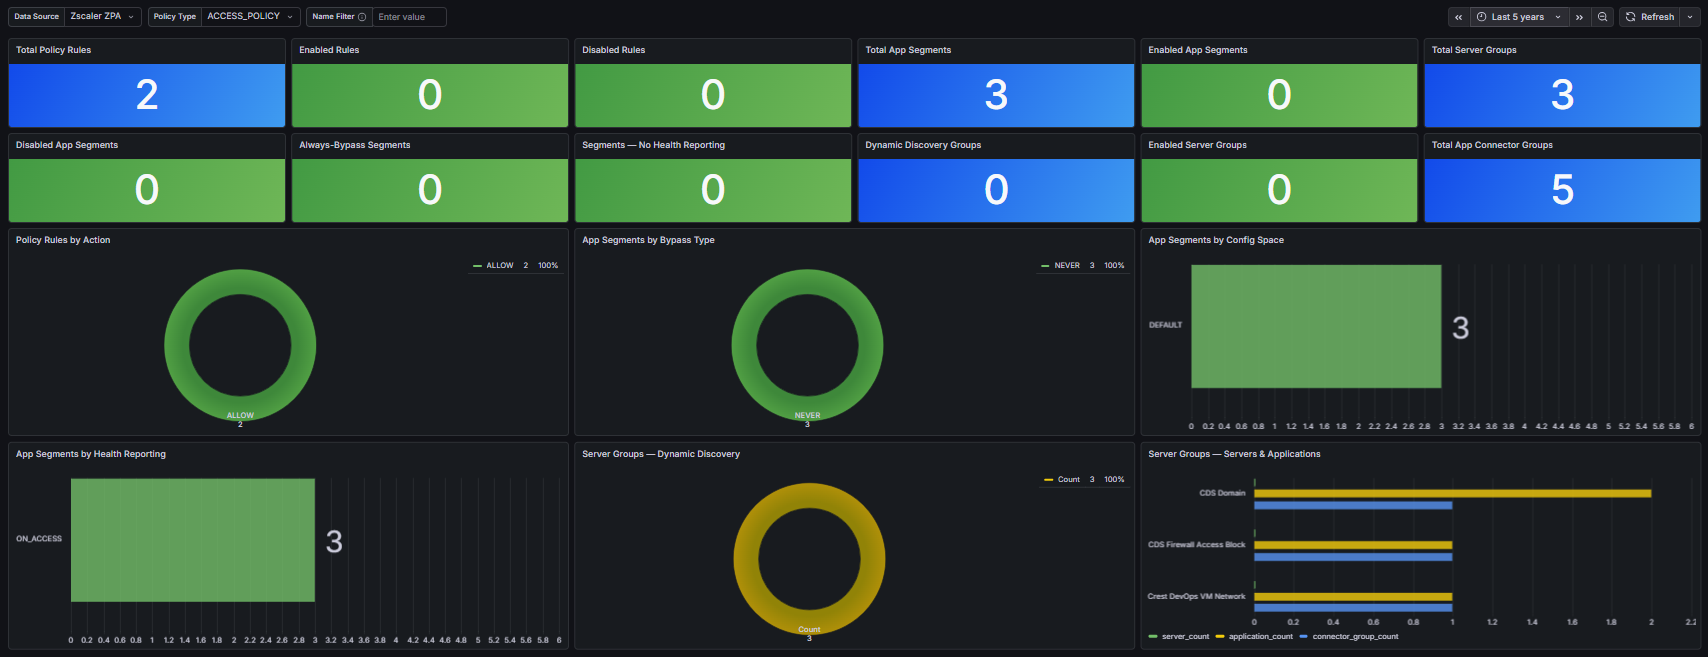
ZPA Security Policy Audit
Provides a security governance view:
- Stat panels: Total Access Policy Rules, Enabled Rules, Total Application Segments, Total Server Groups, Total Connector Groups
- Pie charts: Access Policy Rules by Action, Application Segments by Bypass Type
- Tables: Access Policy Rules (ACCESS_POLICY, TIMEOUT_POLICY, CLIENT_FORWARDING_POLICY), Application Segments, Server Groups, App Connector Groups
Limitations and Recommendations
API Considerations:
- All queries return point-in-time snapshots; there is no time-range filtering support
- Personal Access Tokens expire or may be revoked; regenerate credentials in the ZPA portal if authentication fails
Support
For issues, questions, or feature requests, please open an issue in this repository.
Contributing
Contributions are welcome! To get started with development:
cd crestdata-zscalerzpa-datasource
Frontend
npm install
npm run dev        # development mode with watch
npm run build      # production build
Backend
mage buildAll      # build backend binaries
Tests
npm run test:ci    # frontend tests (CI mode)
mage test          # backend tests
Local Grafana instance (Docker)
npm run server
Before submitting a pull request:
- Run the linter and ensure all tests pass.
- Validate the plugin using the Grafana Plugin Validator.
- Ensure any changes to
plugin.jsonare intentional — a Grafana server restart is required after such changes.
Authors and Acknowledgment
Developed by Crest Data.
License
This plugin is distributed under the Crest Data End User License Agreement (EULA). See the LICENSE file for details.
References
Grafana Cloud Free
- Free tier: Limited to 3 users
- Paid plans: $55 / user / month above included usage
- Access to all Enterprise Plugins
- Fully managed service (not available to self-manage)
Self-hosted Grafana Enterprise
- Access to all Enterprise plugins
- All Grafana Enterprise features
- Self-manage on your own infrastructure
Install on Grafana Cloud
Plugins can be installed directly from within your Grafana instance or automated using the Cloud API or Terraform.
Learn more about plugin installationMarketplace plugins
This is a paid plugin developed by a marketplace partner. To purchase an entitlement, sign in first, then fill out the contact form.
Get this plugin
This is a paid for plugin developed by a marketplace partner. To purchase entitlement please fill out the contact us form.
What to expect:
- Grafana Labs will reach out to discuss your needs
- Payment will be taken by Grafana Labs
- Once purchased the plugin will be available for you to install (cloud) or a signed version will be provided (on-premise)
Thank you! We will be in touch.
For more information, visit the docs on plugin installation.
Installing on a local Grafana:
For local instances, plugins are installed and updated via a simple CLI command. Plugins are not updated automatically, however you will be notified when updates are available right within your Grafana.
1. Install the Data Source
Use the grafana-cli tool to install Zscaler ZPA from the commandline:
grafana-cli plugins install The plugin will be installed into your grafana plugins directory; the default is /var/lib/grafana/plugins. More information on the cli tool.
Alternatively, you can manually download the .zip file for your architecture below and unpack it into your grafana plugins directory.
Alternatively, you can manually download the .zip file and unpack it into your grafana plugins directory.
2. Configure the Data Source
Accessed from the Grafana main menu, newly installed data sources can be added immediately within the Data Sources section.
Next, click the Add data source button in the upper right. The data source will be available for selection in the Type select box.
To see a list of installed data sources, click the Plugins item in the main menu. Both core data sources and installed data sources will appear.
Changelog
1.0.0
Sign the plugin.
1.0.0
Initial release of the Zscaler ZPA Grafana data source plugin.