Plugins 〉Zscaler ZIA


Zscaler ZIA

Zscaler ZIA Data Source Plugin for Grafana
Description
The Zscaler ZIA DataSource Plugin is a Grafana backend datasource plugin that enables on-demand querying and visualization of Zscaler Internet Access (ZIA) security posture data inside Grafana panels.
Zscaler Internet Access (ZIA) is a cloud-native security service edge (SSE) platform that enforces internet access policies, inspects traffic, and protects users from threats regardless of location. The plugin connects to the ZIA API via the official Zscaler Go SDK to retrieve organization health, firewall filtering rules, SSL inspection policies, URL filtering rules, data loss prevention (DLP) rules, location infrastructure, user management data, NSS server health, and sandbox detonation quota.
Features
- Query and visualize Zscaler ZIA security posture data directly within Grafana
- Support for multiple data categories:
- Organization Health: Organization metadata including org ID, cloud name, domain count, HQ location, industry, employee count, and ZPA tenant information
- Location Infrastructure: Full location details including bandwidth, SSL scan state, firewall settings, VPN status, IPS control, and IPv6 support
- Firewall Rules: Filtering rules with order, rank, action, state, source/destination IP counts, locations, and departments
- SSL Inspection: Inspection rules with TLS version constraints, HTTP/2 support, URL category and cloud app counts
- URL Filtering: URL filtering policies with categories, protocols, block override, time and size quotas
- DLP Rules: Web DLP rules with severity, OCR, download scan, ZCC notification, and audit email fields
- User Management: User records with department, group count, admin status, and account type
- NSS Server Health: NSS log stream server status and health state, filterable by server type
- Sandbox Quota: Sandbox detonation quota usage, limit, remaining quota, and utilization percentage
- Server-side and client-side filtering for granular data retrieval
- Time range filtering using the Grafana dashboard time picker for rules and sandbox quota
- Lookup by ID or exact name for rules and locations
- OAuth 2.0 authentication via the Zscaler ZIdentity portal
- Automatic rate-limit retry (up to 3 retries via the Zscaler SDK)
Compatibility
| Component | Version / Detail |
|---|---|
| Grafana | >= 12.3.0 |
| Zscaler SDK | zscaler-sdk-go v3 (latest) |
| Authentication | OAuth 2.0 (Client ID + Secret) |
Visuals
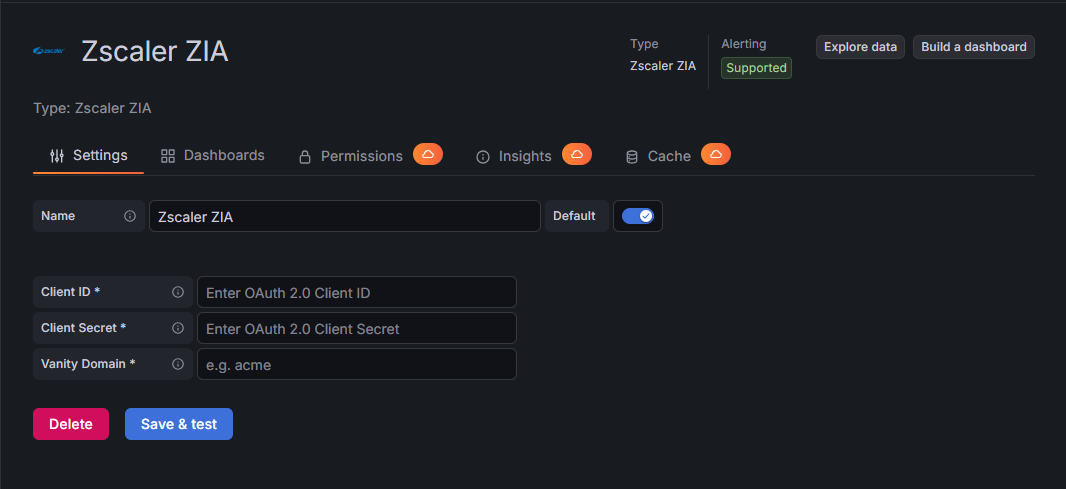
Configuration Editor

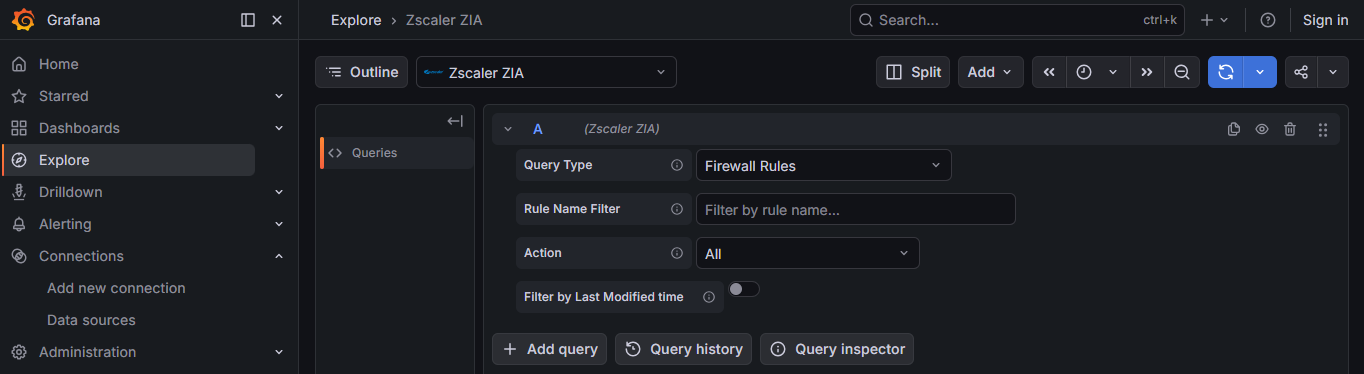
Query Editor
Installation
Requirements
- Grafana >= 12.3.0
- A Zscaler ZIA tenant with API access enabled
- OAuth 2.0 credentials (Client ID and Client Secret) from the Zscaler ZIdentity portal
- Network connectivity to the Zscaler cloud API
Obtain ZIA API Credentials
- Log in to your Zscaler ZIdentity portal.
- Navigate to Administration > OAuth 2.0 Clients (or the equivalent in your tenant).
- Create a new OAuth 2.0 client and note the Client ID and Client Secret.
- Assign the required Functional Scopes for the data categories you intend to query:
zia.organization— Organization Healthzia.locations— Location Infrastructure, Locations Litezia.firewall— Firewall Ruleszia.sslinspect— SSL Inspectionzia.urlfiltering— URL Filteringzia.dlp— DLP Ruleszia.users— User Managementzia.nss— NSS Server Healthzia.sandbox— Sandbox Quota
- Note your organization vanity domain prefix (e.g.,
acmefromacme-admin.zslogin.net).
Install the Plugin
Install the plugin from the Grafana Plugin Catalog or using the Grafana CLI:
grafana cli plugins install crestdata-zscalerzia-datasource
After installation, restart the Grafana server for the plugin to be loaded.
Configure the Data Source
- In Grafana, navigate to Connections > Data Sources > Add data source.
- Search for Zscaler ZIA and select it.
- Fill in the required configuration fields:
| Name | Type | Required | Description |
|---|---|---|---|
| Client ID | String | Yes | OAuth 2.0 Client ID from the Zscaler ZIdentity portal |
| Client Secret | Secure String | Yes | OAuth 2.0 Client Secret from the Zscaler ZIdentity portal |
| Vanity Domain | String | Yes | Your organization vanity domain prefix (e.g., acme from acme-admin.zslogin.net) |
| Cloud | String | No | Zscaler cloud environment (default: zscaler.net). Options: zscaler.net, zscalertwo.net, zscalerthree.net |
- Click Save & Test. The health check will authenticate against the Zscaler API and return the connected organization name.
Usage
Query Editor
Once the data source is configured, you can create panels using the query editor with the following parameters:
| Parameter | Type | Options / Notes | Default | Description |
|---|---|---|---|---|
| Query Type | Dropdown | Organization Health, Location Infrastructure, Firewall Rules, SSL Inspection, URL Filtering, DLP Rules, User Management, NSS Server Health, Sandbox Quota | Organization Health | Select the ZIA data category to query |
| Rule ID | Number | Integer rule ID | — | Fetch a single rule by ID (SSL Inspection, URL Filtering, DLP Rules only). Takes priority over Rule Name. |
| Rule Name / Object Filter | String | Exact name or partial match depending on query type | — | Filter by name. Behavior varies per query type (see below). |
| Location ID | Number | Integer location ID | — | Fetch a single location by ID (Location Infrastructure only). Takes priority over Location Name. |
| Action | Dropdown | All, Allow, Block Drop, Block Reset, Block ICMP, Evaluate Network App | All | Filter firewall rules by action type (Firewall Rules only). |
| Rule Order | Number | Integer order position | — | Filter firewall rules by rule order (Firewall Rules only). |
| Location | Dropdown | Populated from your ZIA tenant | All | Filter firewall rules by assigned location (Firewall Rules only). |
| Department | Dropdown | Populated from your ZIA tenant | All | Filter firewall rules or users by department (Firewall Rules, User Management). |
| Server Type | Dropdown | All, NSS for Web, NSS for Firewall, VZEN, VZEN SME, VZEN SMLB, Pinned NSS, ADP, ZIRSVR, NSS for ZPA | All | Filter NSS servers by log stream type (NSS Server Health only). |
| Use Time Filter | Toggle | On / Off | Off | When enabled, restricts results to items whose last_modified timestamp (rules) or start_time (Sandbox Quota) falls within the dashboard time range. Available for Firewall Rules, SSL Inspection, URL Filtering, DLP Rules, and Sandbox Quota. Has no effect when filtering by Rule ID or Rule Name. |
| SSL Scan Enabled | Boolean | true / false | false | Filter locations where SSL scanning is enabled (Locations Lite only). |
| Include Sub-Locations | Boolean | true / false | false | Include sub-locations in results (Locations Lite only). |
| Include Parent Locations | Boolean | true / false | false | Include parent locations in results (Locations Lite only). |
| Enable IoT | Boolean | true / false | false | Include IoT discovery fields in results (Locations Lite only). |
Available Query Types
Organization Health
Returns a single row with organization metadata retrieved from the ZIA organization details API.
Fields returned: org_id, org_name, cloud_name, domain_count, hq_location, country, city, timezone, language, industry, employee_count, zpa_tenant_id, zpa_tenant_cloud
Location Infrastructure
Returns detailed location records from the ZIA location management API.
- Fetch all locations by leaving filters empty
- Fetch a single location by Location ID (takes priority) or exact Location Name
Fields returned: location_id, name, parent_id, country, state, timezone, ip_count, bandwidth_up_mbps, bandwidth_down_mbps, bandwidth_total_mbps, ssl_scan_enabled, firewall_enabled, auth_required, vpn_enabled, ips_control, aup_enabled, xff_forward_enabled, ofw_enabled, ipv6_enabled, profile, description, child_count
Locations Lite
Returns a lightweight subset of location data optimized for security flag review. Supports server-side filtering by SSL scan state, sub-location/parent inclusion, and IoT.
Fields returned: location_id, name, parent_id, timezone, xff_forward_enabled, aup_enabled, caution_enabled, aup_block_internet, aup_force_ssl_inspection, surrogate_ip, surrogate_ip_known_browsers, firewall_enabled, ips_control, zapp_ssl_scan_enabled, ipv6_enabled
Firewall Rules
Returns ZIA firewall filtering rules. Supports server-side filtering by rule name and action, and client-side filtering by location, department, and rule order. Enable Use Time Filter to restrict results to rules whose last_modified timestamp falls within the dashboard time range.
Fields returned: rule_id, name, order, rank, state, action, full_logging, predefined, default_rule, description, last_modified, src_ip_count, dest_ip_count, locations, departments
SSL Inspection
Returns ZIA SSL inspection rules.
- Fetch all rules by leaving filters empty
- Fetch a single rule by Rule ID (takes priority) or exact Rule Name
- Enable Use Time Filter to restrict results (when fetching all rules) to those whose
last_modifiedtimestamp falls within the dashboard time range
Fields returned: rule_id, name, state, action, order, rank, default_rule, predefined, min_client_tls, min_server_tls, http2_enabled, url_category_count, cloud_app_count, last_modified
URL Filtering
Returns ZIA URL filtering policy rules.
- Fetch all rules by leaving filters empty
- Fetch a single rule by Rule ID (takes priority) or exact Rule Name
- Enable Use Time Filter to restrict results (when fetching all rules) to those whose
last_modifiedtimestamp falls within the dashboard time range
Fields returned: rule_id, name, state, action, order, url_categories, protocols, block_override, time_quota_min, size_quota_kb, time_validity, last_modified, description
DLP Rules
Returns ZIA web DLP rules.
- Fetch all rules by leaving filters empty
- Fetch a single rule by Rule ID (takes priority) or exact Rule Name
- Enable Use Time Filter to restrict results (when fetching all rules) to those whose
last_modifiedtimestamp falls within the dashboard time range
Fields returned: rule_id, name, state, action, severity, order, rank, match_only, ocr_enabled, download_scan, no_content_inspect, zcc_notify, auditor_email, engine_count, location_count, department_count, last_modified
User Management
Returns ZIA user records. Supports filtering by name/email (partial match) and department (prefix match via API).
Fields returned: user_id, name, email, is_admin, user_type, deleted, dept_id, dept_name, group_count, comments
NSS Server Health
Returns ZIA NSS (Nanolog Streaming Service) server records. Supports filtering by server type.
Fields returned: server_id, name, status, health_state, server_type, icap_server_id
Sandbox Quota
Returns the ZIA sandbox detonation quota for the current billing period. Enable Use Time Filter (labelled "Filter by Start Time") to restrict results to quota entries whose start_time falls within the dashboard time range.
Fields returned: quota_allowed, quota_used, quota_unused, scale, period_start, quota_pct
Name vs. ID Lookup Behavior
| Query Type | ID Filter | Name / Object Filter |
|---|---|---|
| Location Infrastructure | Location ID — exact lookup via GetLocation API | Location Name — exact lookup via GetLocationByName API |
| SSL Inspection | Rule ID — exact lookup | Rule Name — exact lookup via GetByName API |
| URL Filtering | Rule ID — exact lookup | Rule Name — exact lookup via GetByName API |
| DLP Rules | Rule ID — exact lookup | Rule Name — exact lookup via GetByName API |
| Firewall Rules | — | Rule Name — case-insensitive substring match via API |
| User Management | — | Email / Name — partial match via API |
| Locations Lite | — | Search — substring match via API |
Error Handling and Retry Strategy
Retries are performed automatically by the Zscaler SDK for transient failures:
- HTTP 429 (rate limited) — retried with backoff
- Network/connection-level errors
Max retry attempts: 3 (configured via WithRateLimitMaxRetries).
Non-retryable errors are returned immediately with a descriptive message:
| Status Code | Message |
|---|---|
| 401 | Unauthorized — session invalid, expired, or wrong Client ID/Secret |
| 403 | Access denied — API client is missing the required Functional Scopes |
| 429 | Rate limit exceeded |
Resources Reference
| Resource | Description | Supported Filters |
|---|---|---|
| Organization Health | Organization metadata: ID, cloud, domains, HQ, industry, employee count, ZPA tenant | None |
| Location Infrastructure | Full location details: bandwidth, SSL, firewall, VPN, IPS, AUP, IPv6 | Location ID, Location Name |
| Firewall Rules | Filtering rules with order, rank, state, action, source/destination IP counts, locations, departments | Rule Name, Action, Time Range (last_modified) |
| SSL Inspection | Inspection rules with TLS version constraints, HTTP/2, URL categories, cloud apps | Rule ID, Rule Name, Time Range (last_modified) |
| URL Filtering | URL filtering policies with categories, protocols, time and size quotas | Rule ID, Rule Name, Time Range (last_modified) |
| DLP Rules | Web DLP rules with severity, OCR, download scan, ZCC notification, audit email | Rule ID, Rule Name, Time Range (last_modified) |
| User Management | User records with department, group count, admin flag, account type | Name, Department |
| NSS Server Health | NSS log stream server status and health state | Server Type |
| Sandbox Quota | Sandbox detonation quota: allowed, used, unused, utilization percentage | Time Range (start_time) |
Limitations and Recommendations
API Considerations:
- The plugin uses OAuth 2.0 via the Zscaler ZIdentity portal. Ensure the OAuth client has the correct Functional Scopes for each query type you intend to use. Missing scopes result in HTTP 403 errors.
Performance Tips:
- Use Rule ID or exact name lookups instead of fetching all rules when querying a specific policy in large tenants.
- Use Department and Location filters on Firewall Rules queries to reduce result set size in environments with many rules.
- Use Locations Lite instead of Location Infrastructure when only security flag data is needed — it is faster and returns a smaller payload.
Support
For issues, questions, or feature requests, please open an issue in this repository.
Roadmap
See the open issues for a list of proposed features and known issues.
Contributing
Contributions are welcome! To get started with development:
cd crestdata-zscalerzia-datasource
Frontend
npm install
npm run dev        # development mode with watch
npm run build      # production build
Backend
mage -v            # build backend binaries
Tests
npm run test       # frontend tests (Jest)
npm run test:ci    # CI mode
go test ./…      # backend tests
Linting
npm run lint
npm run lint:fix
Local Grafana instance (Docker)
npm run server
E2E tests (Playwright)
npm run e2e
Before submitting a pull request:
- Run the linter and ensure all tests pass.
- Validate the plugin using the Grafana Plugin Validator.
- Ensure any changes to
plugin.jsonare intentional — a Grafana server restart is required after such changes.
Authors and Acknowledgment
Developed by Crest Data.
License
This plugin is distributed under the EULA License. See the LICENSE file for details.
References
Grafana Cloud Free
- Free tier: Limited to 3 users
- Paid plans: $55 / user / month above included usage
- Access to all Enterprise Plugins
- Fully managed service (not available to self-manage)
Self-hosted Grafana Enterprise
- Access to all Enterprise plugins
- All Grafana Enterprise features
- Self-manage on your own infrastructure
Install on Grafana Cloud
Plugins can be installed directly from within your Grafana instance or automated using the Cloud API or Terraform.
Learn more about plugin installationMarketplace plugins
This is a paid plugin developed by a marketplace partner. To purchase an entitlement, sign in first, then fill out the contact form.
Get this plugin
This is a paid for plugin developed by a marketplace partner. To purchase entitlement please fill out the contact us form.
What to expect:
- Grafana Labs will reach out to discuss your needs
- Payment will be taken by Grafana Labs
- Once purchased the plugin will be available for you to install (cloud) or a signed version will be provided (on-premise)
Thank you! We will be in touch.
For more information, visit the docs on plugin installation.
Installing on a local Grafana:
For local instances, plugins are installed and updated via a simple CLI command. Plugins are not updated automatically, however you will be notified when updates are available right within your Grafana.
1. Install the Data Source
Use the grafana-cli tool to install Zscaler ZIA from the commandline:
grafana-cli plugins install The plugin will be installed into your grafana plugins directory; the default is /var/lib/grafana/plugins. More information on the cli tool.
Alternatively, you can manually download the .zip file for your architecture below and unpack it into your grafana plugins directory.
Alternatively, you can manually download the .zip file and unpack it into your grafana plugins directory.
2. Configure the Data Source
Accessed from the Grafana main menu, newly installed data sources can be added immediately within the Data Sources section.
Next, click the Add data source button in the upper right. The data source will be available for selection in the Type select box.
To see a list of installed data sources, click the Plugins item in the main menu. Both core data sources and installed data sources will appear.
Changelog
1.0.3
- Resolved the osv-scanner vulnerabilities.
1.0.2
- Sign a plugin.
1.0.1
- Updated README.
1.0.0
- Initial release.