Plugins 〉Tableau


Tableau

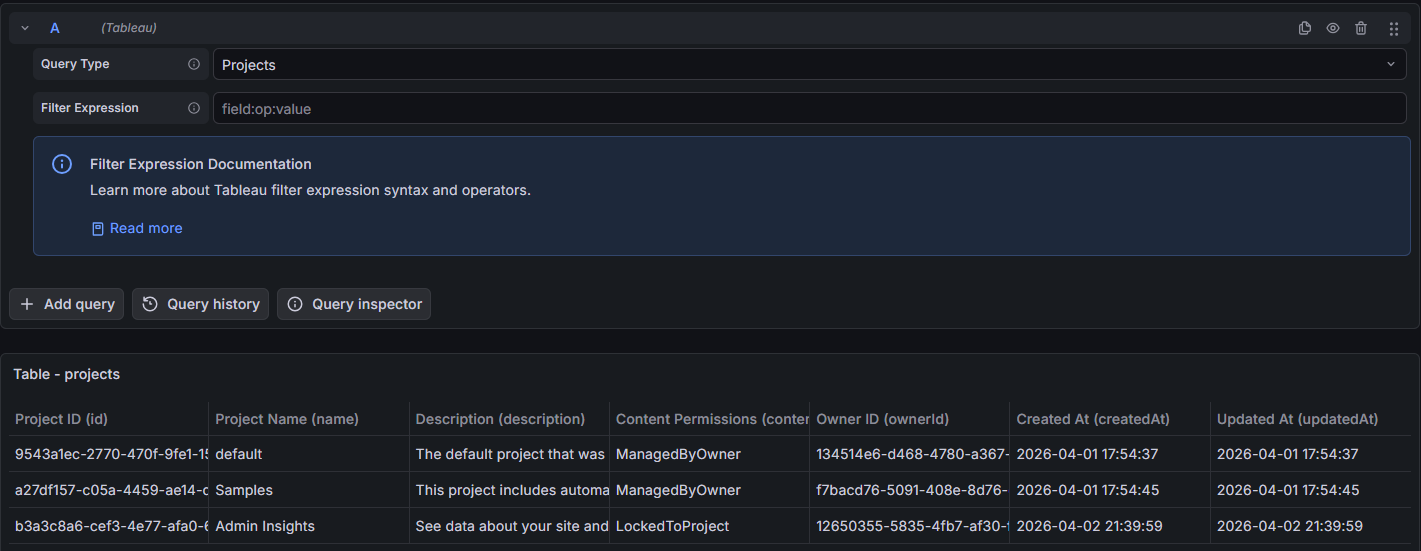
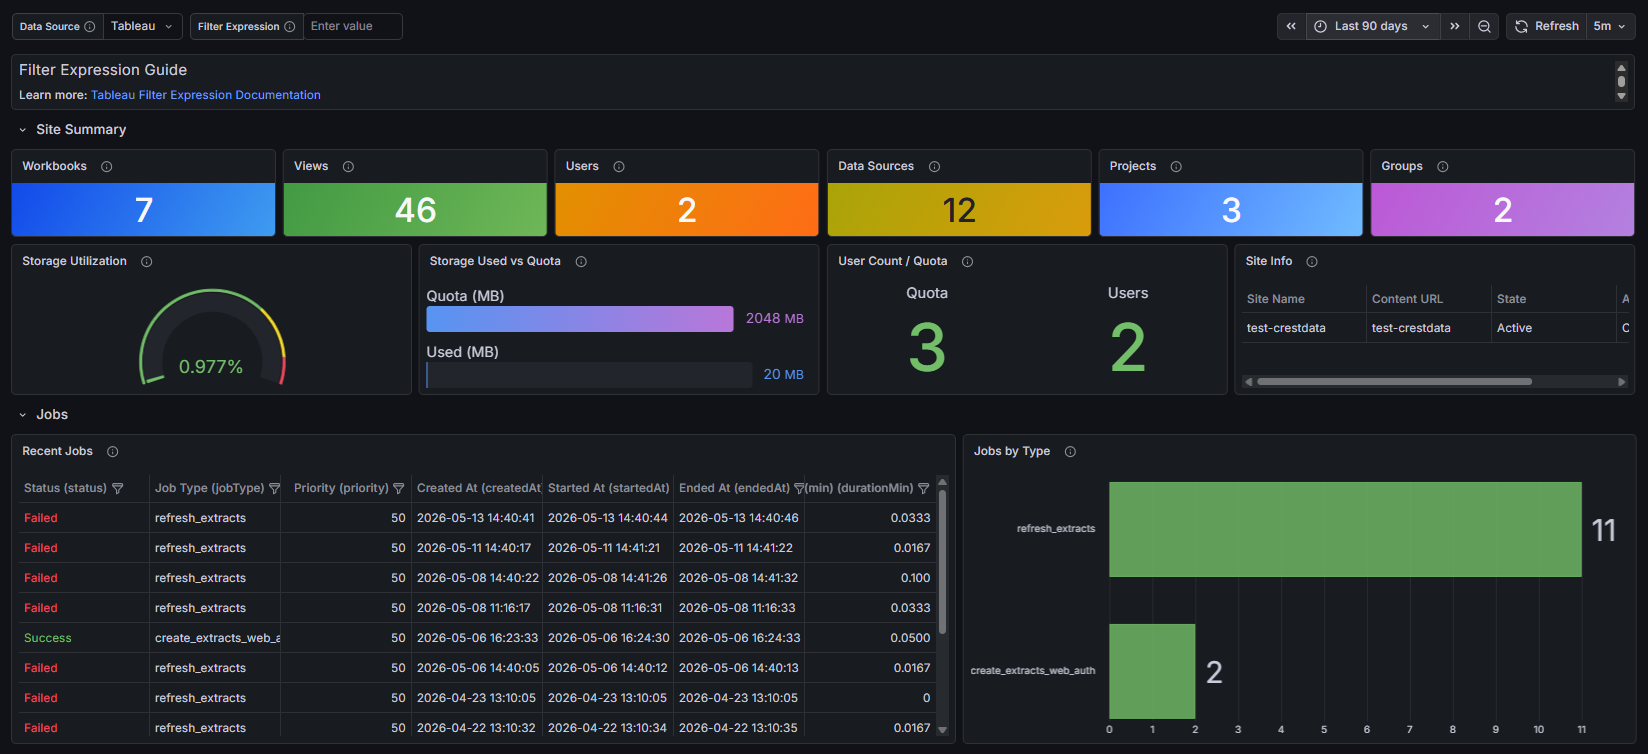
Tableau Data Source Plugin for Grafana
Description
The Tableau DataSource Plugin is a Grafana backend datasource plugin that enables on-demand querying and visualization of Tableau Server and Tableau Cloud content and operational data inside Grafana panels.
Tableau is a leading business intelligence and analytics platform. The plugin connects to the Tableau REST API to retrieve site information, projects, workbooks, views, published data sources, users, groups, background jobs, and extract refresh tasks.
Features
- Query and visualize Tableau Server / Tableau Cloud data directly within Grafana
- Support for multiple data categories:
- Site Info: Site metadata, storage quota, user quota, and usage counts
- Projects: Project inventory with owner and content permissions
- Workbooks: Published workbooks with owner, project, size, and tags
- Views: Views across the site with optional usage hit counts
- Data Sources: Published data sources with certification status and connection type
- Users: Site users with role, authentication setting, and last login
- Groups: Site groups with domain information
- Jobs: Background job history with duration calculation
- Extract Tasks: Scheduled extract refresh tasks with consecutive failure counts
- Filter expression support using Tableau REST API filter syntax
- Grafana time range picker integration —
fromis pushed to the Tableau API as a server-side filter,tois enforced as a post-filter in the backend - Automatic pagination — all pages are fetched and merged transparently
- Built-in retry logic with exponential backoff for transient failures
- Personal Access Token (PAT) authentication with automatic session management and refresh
Compatibility
| Component | Version / Detail |
|---|---|
| Grafana | >= 12.0.0 |
| Tableau Server | v2019.3+ |
| REST API | 3.28 |
| Authentication | Personal Access Token |
Visuals
Onboarding
Query Examples

Added Dashboards

Installation
Requirements
- Grafana >= 12.0.0
- Tableau Server v2019.3+ or Tableau Cloud
- A Personal Access Token (PAT) with appropriate site permissions
- Network connectivity to the Tableau Server or Tableau Cloud endpoint
Obtain a Personal Access Token
- Sign in to Tableau Server or Tableau Cloud.
- Navigate to My Account Settings → Personal Access Tokens.
- Click Create new token, provide a name, and copy both the token name and the secret — the secret is shown only once.
Install the Plugin
Install the plugin from the Grafana Plugin Catalog or using the Grafana CLI:
grafana cli plugins install crestdata-tableau-datasource
After installation, restart the Grafana server for the plugin to be loaded.
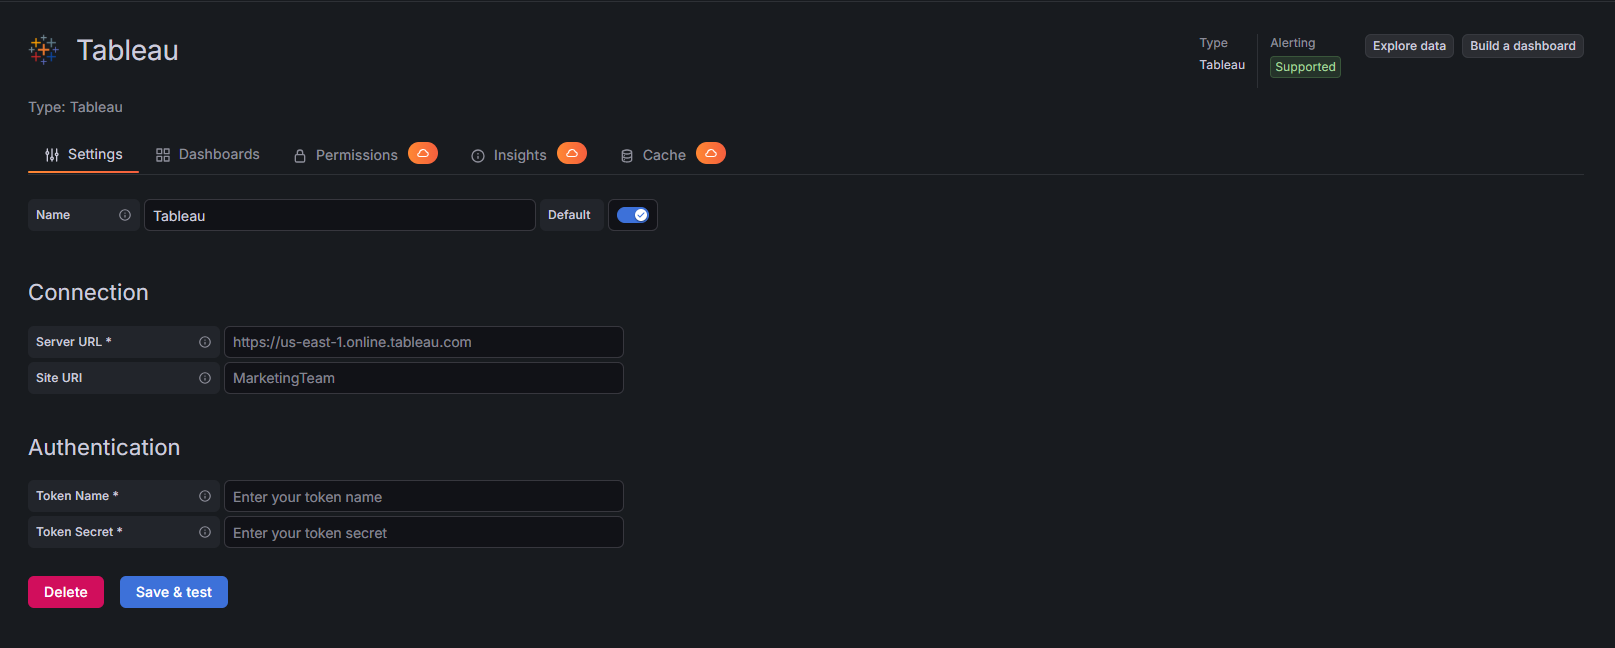
Configure the Data Source
- In Grafana, navigate to Connections > Data Sources > Add data source.
- Search for Tableau and select it.
- Fill in the required configuration fields:
| Name | Type | Required | Description |
|---|---|---|---|
| Server Endpoint | String | Yes | The Tableau Server or Cloud URL (e.g., https://use-east-1.online.tableau.com) |
| Site Name | String | No | The site content URL; leave blank for the default site |
| Token Name | String | Yes | The Personal Access Token name |
| Token Secret | Secure String | Yes | The Personal Access Token secret (encrypted at rest) |
- Click Save & Test. The health check will sign in and verify connectivity, returning the Tableau Server version and REST API version on success.
Usage
Query Editor
Once the data source is configured, you can create panels using the query editor with the following parameters:
| Parameter | Type | Options | Default | Description |
|---|---|---|---|---|
| Query Type | Dropdown | Site Info, Projects, Workbooks, Views, Data Sources, Users, Groups, Jobs, Extract Tasks | Site Info | Select the data category to query |
| Filter Expression | String | Tableau filter syntax (field:op:value, comma-separated) | — | Filter applied to Projects, Workbooks, Views, Data Sources, Users, and Jobs |
Available Query Types
Site Info
Returns a single-row frame with site metadata: ID, name, content URL, admin mode, state, storage quota, user quota, number of users in use, storage in use, user usage percentage, and storage usage percentage.
Projects
Returns all projects on the site with ID, name, description, content permissions, owner ID, owner name, created at, and updated at. Supports filter expressions. The Grafana time range filters by updatedAt.
Workbooks
Returns published workbooks with ID, name, content URL, show tabs flag, size (MB), created at, updated at, encrypt extracts flag, project ID, project name, owner ID, owner name, and comma-separated tags. Supports filter expressions. The Grafana time range filters by updatedAt.
Views
Returns views across the site with ID, name, content URL, view URL name, workbook ID, workbook name, project ID, project name, owner ID, owner name, total view count, created at, and updated at. Supports filter expressions. The Grafana time range filters by updatedAt.
Data Sources
Returns published data sources with ID, name, content URL, connection type, certified flag, has extracts flag, size (MB), created at, updated at, project ID, project name, owner ID, owner name, and comma-separated tags. Supports filter expressions. The Grafana time range filters by updatedAt.
Users
Returns site users with ID, username, full name, email, site role, authentication setting, and last login. Supports filter expressions.
Groups
Returns site groups with ID, name, and domain name.
Jobs
Returns background job history with ID, status, job type, priority, finish code, created at, started at, ended at, and computed duration in minutes (nullable — null when start or end time is missing). Supports filter expressions. The Grafana time range filters by createdAt.
Extract Tasks
Returns scheduled extract refresh tasks with ID, task type, priority, consecutive failed count, schedule frequency, next run at, workbook ID, workbook name, data source ID, and data source name.
Filter Expressions
Filter expressions use Tableau REST API filter syntax: field:operator:value. Multiple filters are comma-separated. The input is automatically normalized on blur — leading/trailing commas are stripped and spaces around commas are removed.
Examples:
name:eq:Sales— exact name matchprojectName:eq:Finance— filter by project nameisCertified:eq:true— certified data sources onlystatus:eq:Failed— failed jobs only
Filters are supported on: Projects, Workbooks, Views, Data Sources, Users, and Jobs.
Time Range
The Grafana time range picker is integrated for all query types that have a time field. The from bound is sent to the Tableau API as a server-side gte filter to minimize data transfer. The to bound is enforced as a post-filter in the backend after the data is received. This split approach is required because Tableau does not support two filters on the same field in a single request.
| Resource | Time field used | from (API filter) | to (post-filter) |
|---|---|---|---|
| Projects | updatedAt | updatedAt:gte: | drop rows after to |
| Workbooks | updatedAt | updatedAt:gte: | drop rows after to |
| Views | updatedAt | updatedAt:gte: | drop rows after to |
| Data Sources | updatedAt | updatedAt:gte: | drop rows after to |
| Jobs | createdAt | createdAt:gte: | drop rows after to |
Query types without a time field (Site Info, Users, Groups, Extract Tasks) are unaffected by the time range picker.
The default time range for the bundled dashboard is last 7 days, which covers a typical Tableau job and content activity window.
Error Handling and Retry Strategy
Retries are performed only for transient failures:
- HTTP 401 (session expired) — session is invalidated and a new one is obtained automatically
- HTTP 429 (rate limited)
- HTTP 5xx responses (500–599)
Max retry attempts: 3, with exponential backoff (base delay: 3 seconds).
Non-retryable: HTTP 400, 403, 404, and 405 errors are returned immediately.
Resources Reference
| Resource | Description | Supports Filter | Supports Time Range |
|---|---|---|---|
| Site Info | Site metadata, storage and user quota, usage counts and percentages | No | No |
| Projects | Project inventory with owner and content permissions | Yes | Yes (updatedAt) |
| Workbooks | Published workbooks with owner, project, size, and tags | Yes | Yes (updatedAt) |
| Views | Views with optional usage hit counts | Yes | Yes (updatedAt) |
| Data Sources | Published data sources with certification and connection type | Yes | Yes (updatedAt) |
| Users | Site users with role, auth setting, and last login | Yes | No |
| Groups | Site groups with domain information | No | No |
| Jobs | Background job history with computed duration | Yes | Yes (createdAt) |
| Extract Tasks | Scheduled extract refresh tasks with failure counts and schedule details | No | No |
Limitations and Recommendations
API Considerations:
- The plugin uses Tableau REST API version
3.28internally; no user configuration is required - Personal Access Tokens expire after 15 days of inactivity or when manually revoked; create a new token if authentication fails
Performance tips:
- Use filter expressions to reduce the volume of data returned for large sites
- Reduce dashboard refresh frequency if rate limit errors occur
Support
For issues, questions, or feature requests, please open an issue in this repository.
Roadmap
See the open issues for a list of proposed features and known issues.
Contributing
Contributions are welcome! To get started with development:
cd crestdata-tableau-datasource
Frontend
npm install
npm run dev        # development mode with watch
npm run build      # production build
Backend
mage -v            # build backend binaries
Tests
npm run test       # frontend tests (Jest)
npm run test:ci    # CI mode
go test ./…      # backend tests
Linting
npm run lint
npm run lint:fix
Local Grafana instance (Docker)
npm run server
E2E tests (Playwright)
npm run e2e
Before submitting a pull request:
- Run the linter and ensure all tests pass.
- Validate the plugin using the Grafana Plugin Validator.
- Ensure any changes to
plugin.jsonare intentional — a Grafana server restart is required after such changes.
Authors and Acknowledgment
Developed by Crest Data.
License
This plugin is distributed under the Crest Data End User License Agreement (EULA). See the LICENSE file for details.
References
Grafana Cloud Free
- Free tier: Limited to 3 users
- Paid plans: $55 / user / month above included usage
- Access to all Enterprise Plugins
- Fully managed service (not available to self-manage)
Self-hosted Grafana Enterprise
- Access to all Enterprise plugins
- All Grafana Enterprise features
- Self-manage on your own infrastructure
Install on Grafana Cloud
Plugins can be installed directly from within your Grafana instance or automated using the Cloud API or Terraform.
Learn more about plugin installationMarketplace plugins
This is a paid plugin developed by a marketplace partner. To purchase an entitlement, sign in first, then fill out the contact form.
Get this plugin
This is a paid for plugin developed by a marketplace partner. To purchase entitlement please fill out the contact us form.
What to expect:
- Grafana Labs will reach out to discuss your needs
- Payment will be taken by Grafana Labs
- Once purchased the plugin will be available for you to install (cloud) or a signed version will be provided (on-premise)
Thank you! We will be in touch.
For more information, visit the docs on plugin installation.
Installing on a local Grafana:
For local instances, plugins are installed and updated via a simple CLI command. Plugins are not updated automatically, however you will be notified when updates are available right within your Grafana.
1. Install the Data Source
Use the grafana-cli tool to install Tableau from the commandline:
grafana-cli plugins install The plugin will be installed into your grafana plugins directory; the default is /var/lib/grafana/plugins. More information on the cli tool.
Alternatively, you can manually download the .zip file for your architecture below and unpack it into your grafana plugins directory.
Alternatively, you can manually download the .zip file and unpack it into your grafana plugins directory.
2. Configure the Data Source
Accessed from the Grafana main menu, newly installed data sources can be added immediately within the Data Sources section.
Next, click the Add data source button in the upper right. The data source will be available for selection in the Type select box.
To see a list of installed data sources, click the Plugins item in the main menu. Both core data sources and installed data sources will appear.
Changelog
1.0.2
- sign the plugin.
1.0.1
- Fixed HTTP response body leak in
doRequestWithRetry
1.0.0
- Initial release of the Tableau datasource plugin for Grafana.
- Personal Access Token authentication with session caching (230 min TTL, automatic re-sign-in on 401).
- REST API query types: Site Info, Projects, Workbooks, Views, Data Sources, Users, Groups, Jobs, Extract Tasks.
- Server-side pagination for all REST list endpoints (pageSize 1000).
- Retry with exponential backoff for HTTP 429 / 5xx; honors
Retry-After. - Bundled "Tableau Site Overview" dashboard.