Proofpoint TAP Data Source Plugin for Grafana
Description
The Proofpoint TAP DataSource Plugin is a Grafana backend datasource plugin that enables on-demand querying and visualization of Proofpoint Targeted Attack Protection (TAP) SIEM events inside Grafana panels.
Proofpoint TAP is a security solution that helps organizations identify, prevent, and respond to sophisticated email-based attacks targeting users. It uses an advanced email security platform to analyze email traffic and provide visibility into potential threats across all email communications.
Features
- Query and visualize Proofpoint TAP SIEM events directly within Grafana
- Support for multiple event categories: Clicks Permitted, Clicks Blocked, Messages Delivered, and Messages Blocked
- Automatic time-range chunking to comply with Proofpoint API constraints
- Built-in retry logic with exponential backoff for transient failures
- Three pre-built dashboards for immediate insight into email threat data
Compatibility
| Component | Version / Detail |
|---|---|
| Grafana | >= 12.3.0 |
| Proofpoint SIEM API | v2 |
| Authentication | Basic Auth (Service Principal + Secret) |
Visuals
Configuration Editor
Query Editor
Installation
Requirements
- Grafana >= 12.3.0
- A Proofpoint TAP account with API access
- A Service Principal and Secret for authentication
Obtaining Service Credentials
- Login to the Proofpoint TAP dashboard.
- Navigate to Settings > Connected Applications.
- Click Create New Credential.
- Name the new credential set and click Generate.
- Copy the Service Principal and Secret.
Install the Plugin
Install the plugin from the Grafana Plugin Catalog or using the Grafana CLI:
grafana cli plugins install crestdata-proofpointtap-datasource
After installation, restart the Grafana server for the plugin to be loaded.
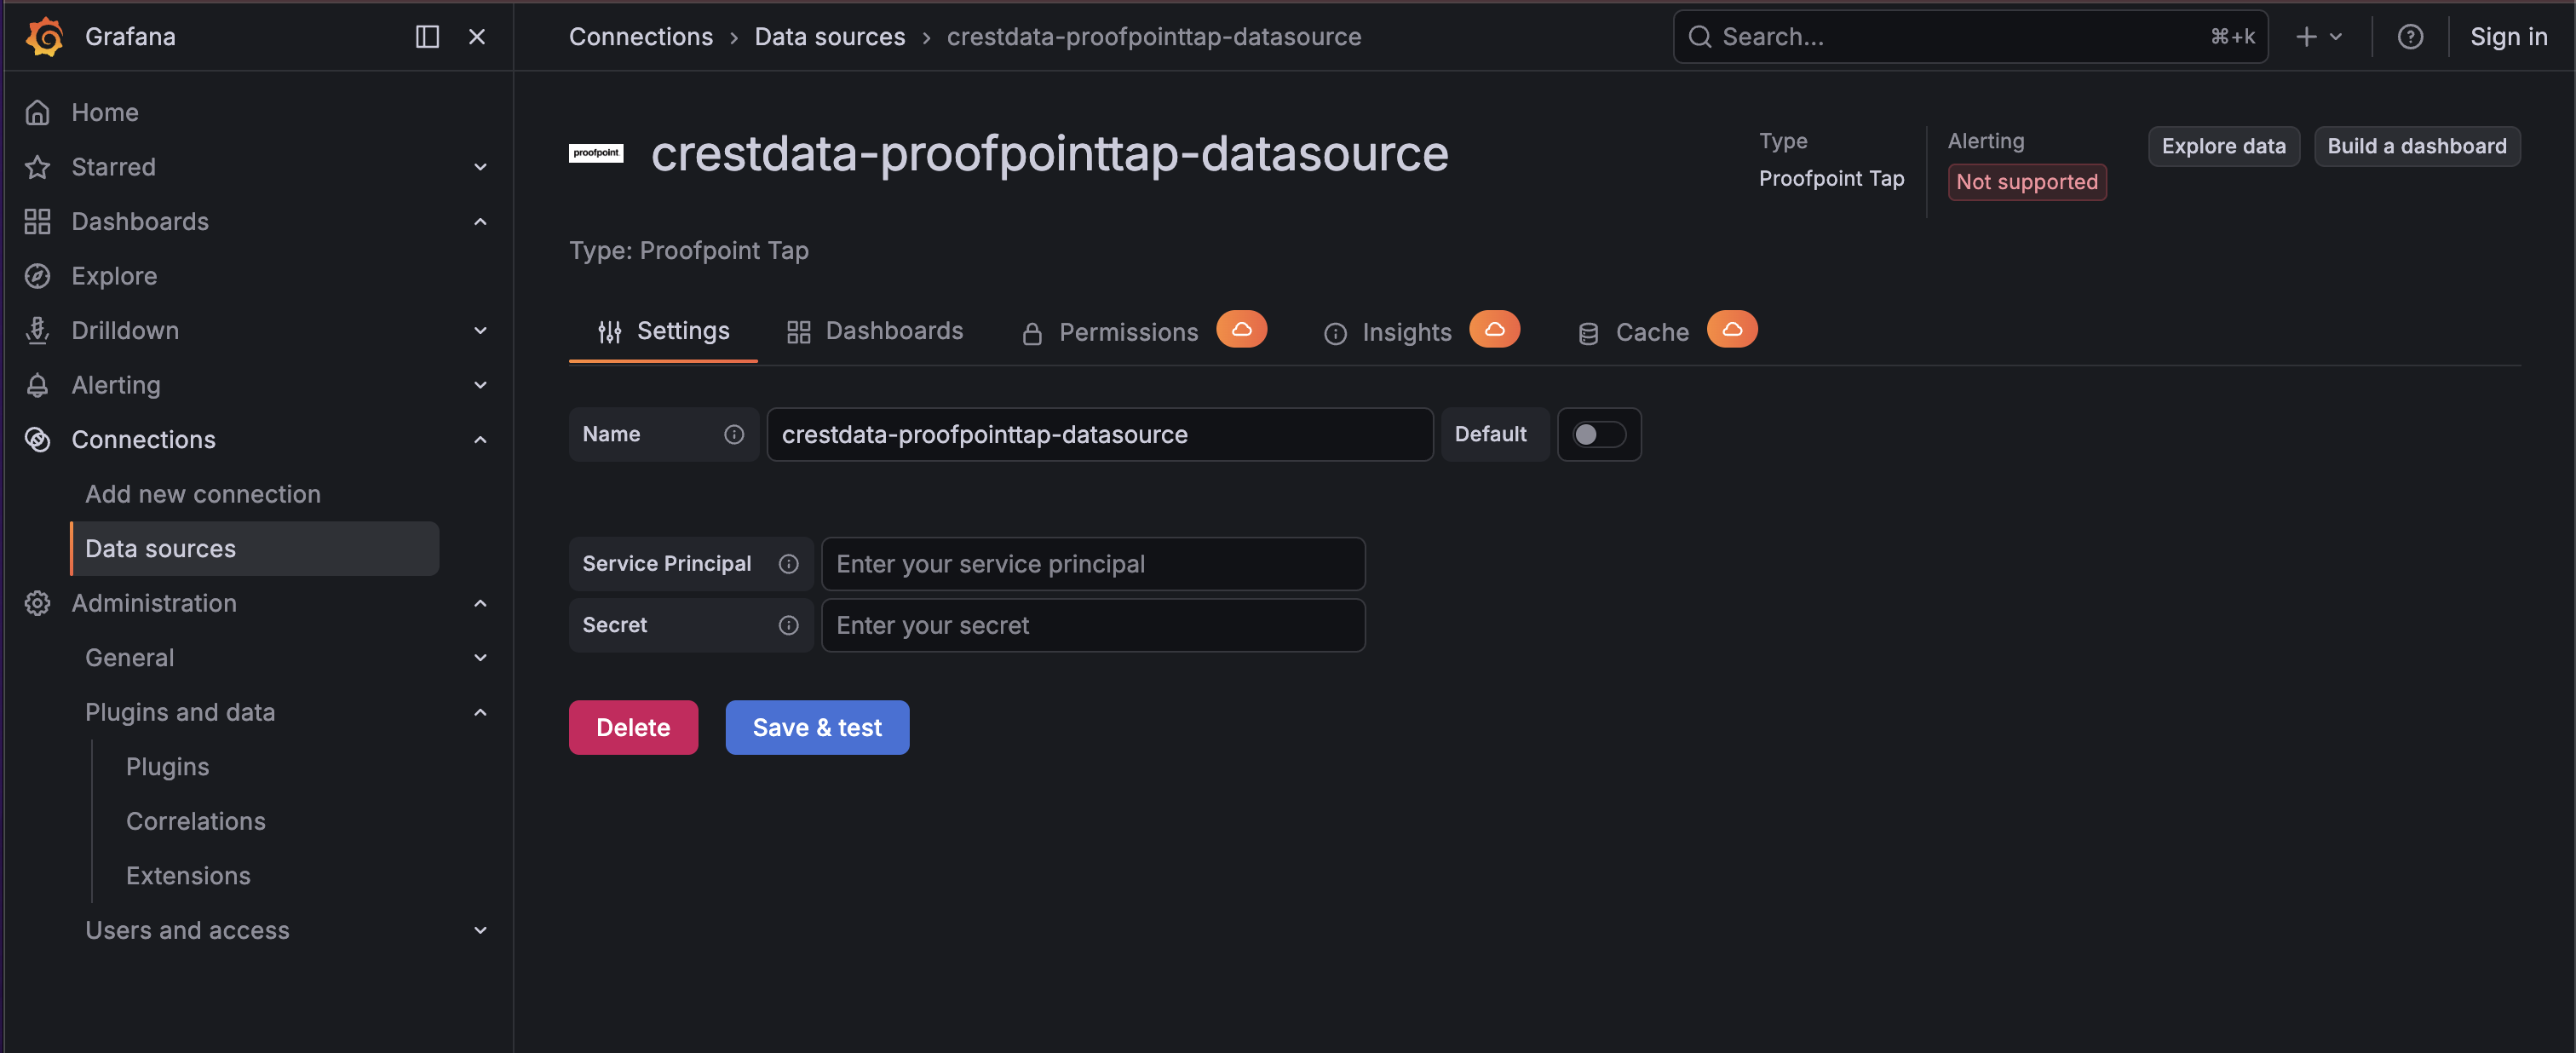
Configure the Data Source
- In Grafana, navigate to Connections > Data Sources > Add data source.
- Search for Proofpoint Tap and select it.
- Fill in the required configuration fields:
| Name | Type | Required | Description |
|---|---|---|---|
| Service Principal | String | Yes | The Service Principal of the Proofpoint TAP account |
| Secret | Secure String | Yes | The Secret of the Proofpoint TAP account |
- Click Save & Test. The health check will validate your credentials against the Proofpoint API.
Usage
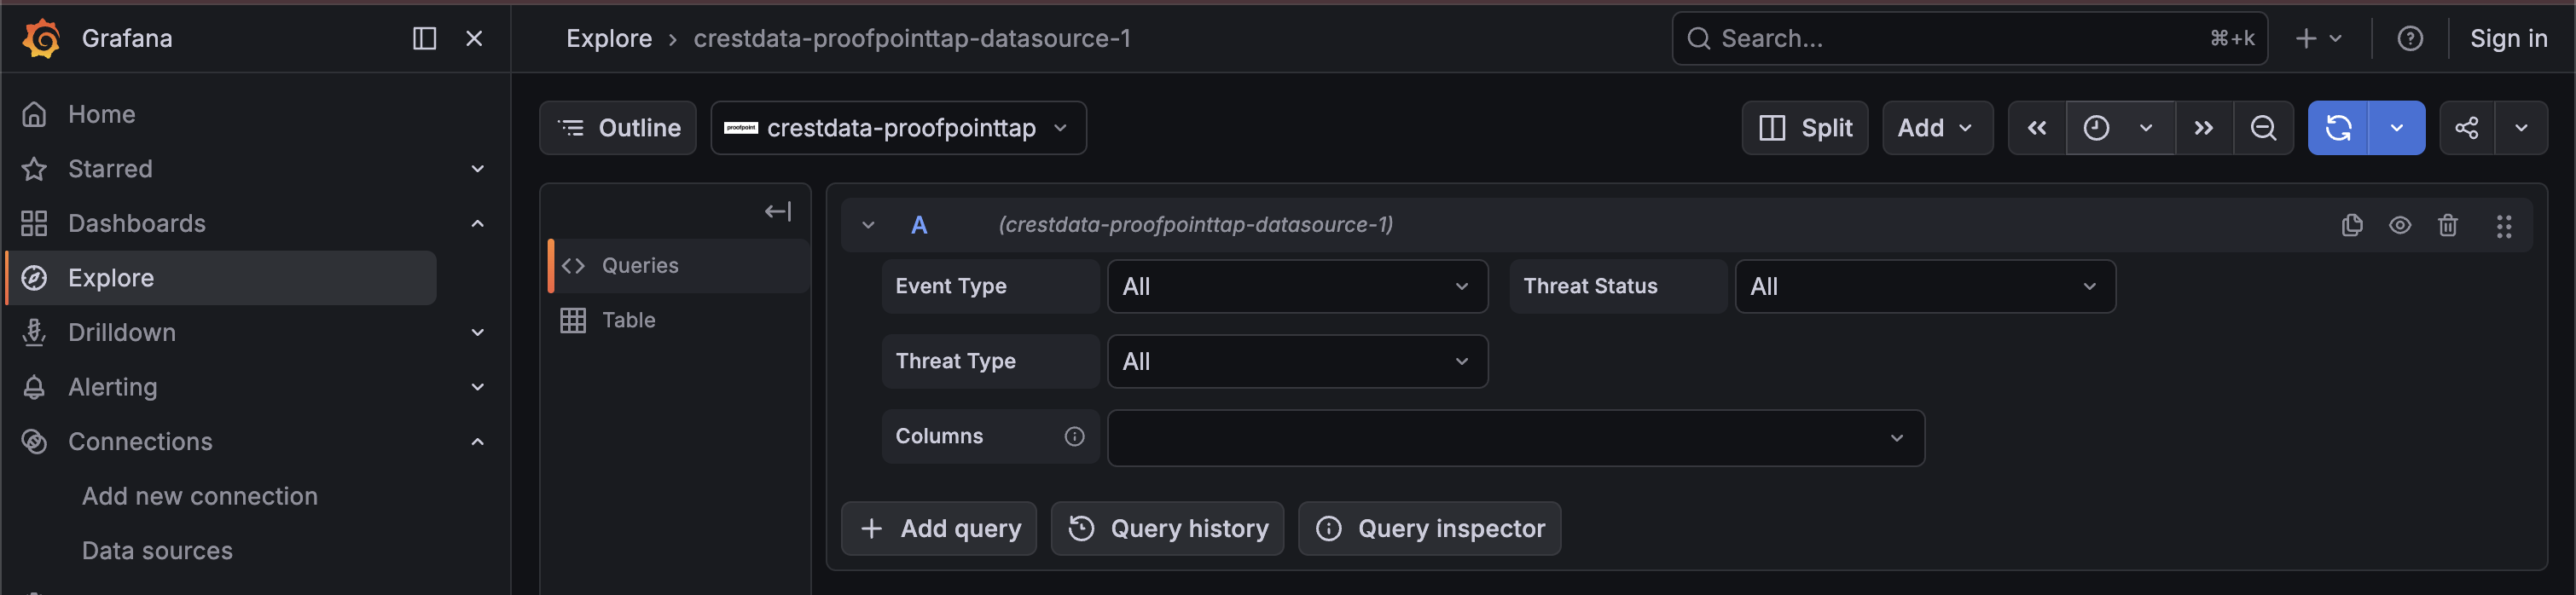
Query Editor
Once the data source is configured, you can create panels using the query editor with the following parameters:
| Parameter | Type | Options | Default | Description |
|---|---|---|---|---|
| Event Types | Dropdown | Clicks Permitted, Clicks Blocked, Messages Delivered, Messages Blocked, All | All | Select the event type to query |
| Threat Status | Dropdown | All, Active, Cleared, FalsePositive | All | Filter events by threat status |
| Threat Type | Dropdown | All, URL, Attachment, MessageText | All | Filter by threat type (for All, Messages Delivered, Messages Blocked) |
| Columns | Multi-select | Depends on event type | Depends on event type | Which fields to return in the DataFrame |
Time Range Handling
The Proofpoint SIEM API enforces:
- Max lookback: 7 days
- Max fetch window: 1 hour per request
The plugin handles this automatically:
(to - from) <= 1 hour→ single API call(to - from) > 1 hour→ split into 1-hour chunks, sequential execution, responses mergedfromolder than 7 days → clear error returned
Error Handling and Retry Strategy
Retries are performed only for transient failures:
- HTTP 429 (rate limited)
- HTTP 5xx responses (500–599)
- Network/connection-level errors
- Errors while reading the response body
Max retry attempts: 3, with exponential backoff (base delay: 3 seconds).
Non-retryable: HTTP 4xx errors (e.g., 401, 403) are returned immediately.
Pre-built Dashboards
The plugin ships three pre-built dashboards. All share these common default settings:
| Setting | Value |
|---|---|
| Default time range | Last 1 hour (now-1h to now) |
| Auto-refresh | Disabled |
| Datasource selection | Template variable (dropdown for selecting the instance) |
1. Proofpoint TAP Overview — High-level summary of all TAP events, including total event count, threat classification and status breakdowns, and top senders.
2. Proofpoint TAP Messages Analysis — Detailed analysis of delivered and blocked email messages, including threat type and status distributions, and average threat scores.
3. Proofpoint TAP Clicks Analysis — Detailed analysis of permitted and blocked URL click events, with breakdowns by classification and threat status.
Limitations and Recommendations
Time range limitations:
- Max lookback: 7 days
- Max interval per request: 1 hour (larger ranges are split into 1-hour chunks)
Recommended Grafana time ranges:
| Use Case | Recommended Range | Auto-refresh |
|---|---|---|
| Live monitoring | Last 1 hour | ON |
| Short investigations | Last 6 hours (up to 12h if low panel count) | ON with caution |
| Historical investigations | > 12 hours up to 7 days | OFF |
Refresh intervals: Due to chunking, total requests scale with panels × chunks × refresh frequency. Prefer Refresh = Off for time ranges > 6 hours or multi-panel dashboards. If auto-refresh is required, use a minimum interval of 1 minute with a time range ≤ 1 hour and a low number of Proofpoint panels.
API rate limits: Each endpoint is limited to 1800 requests per 24 hours.
Support
For issues, questions, or feature requests, please open an issue in this repository.
Roadmap
See the open issues for a list of proposed features and known issues.
Contributing
Contributions are welcome! See the repository README for development setup instructions.
Authors and Acknowledgment
Developed by Crestdata.
License
This plugin is distributed under the LICENSE.
References
Plugin Insights
Quality scores for version 1.0.6
- Status: PassedSecurity
All checks passed
- Status: PassedMaintenance
All checks passed
- Status: PassedDocumentation
All checks passed
- Version
- 1.0.6
- Dependencies
- Grafana >=12.3.0
- Developer
- crestdata
- Last Updated
- May 6, 2026