
Citrix DaaS Data Source for Grafana
The Citrix DaaS data source plugin lets you query and visualize session, application, machine, and site health data from Citrix DaaS (Citrix Cloud, formerly Citrix Virtual Apps and Desktops service) directly in Grafana. It is a backend plugin that connects to two Citrix Cloud API families — the Monitor OData API and the Broker REST API — using a single OAuth2 client-credentials token.
Description
Monitor your entire Citrix DaaS estate from Grafana: ICA/HDX sessions and connections, published applications and their launch activity, VDA machines and delivery groups, site-wide health, and the admin configuration-change audit trail — all read-only, all server-side.
Features
- 16 query types grouped into 5 categories: Site Health, Session Activity, Machines & Capacity, Application Delivery, and Audit Logs.
- Metric Type selectors for the four time-series query types (
session_metrics,app_activity,resource_utilization,machine_metric_summary) — the rest return a fixed set of columns. - Contextual filters (Desktop Group, Machine Name, Application Name, Protocol, Session, Name or ID) shown per query type as applicable. Desktop Group, Machine Name, and Session are multi-select, support multiple simultaneous values, and are populated from live dropdowns via
CallResource(with free-text entry also allowed). - Dual API integration: historical analytics from the Monitor OData API (
/monitorodata/) and live site/catalog/delivery-group/machine state from the Broker REST API (/cvad/manage/). - Automatic Site ID resolution and caching on
Save & Testand at query time, so no manual Site ID lookup is required. - Audit Logs as a time-scoped query: the Configuration Logging API only accepts a look-back window, so the plugin derives it from the dashboard's time range and trims results to the exact range.
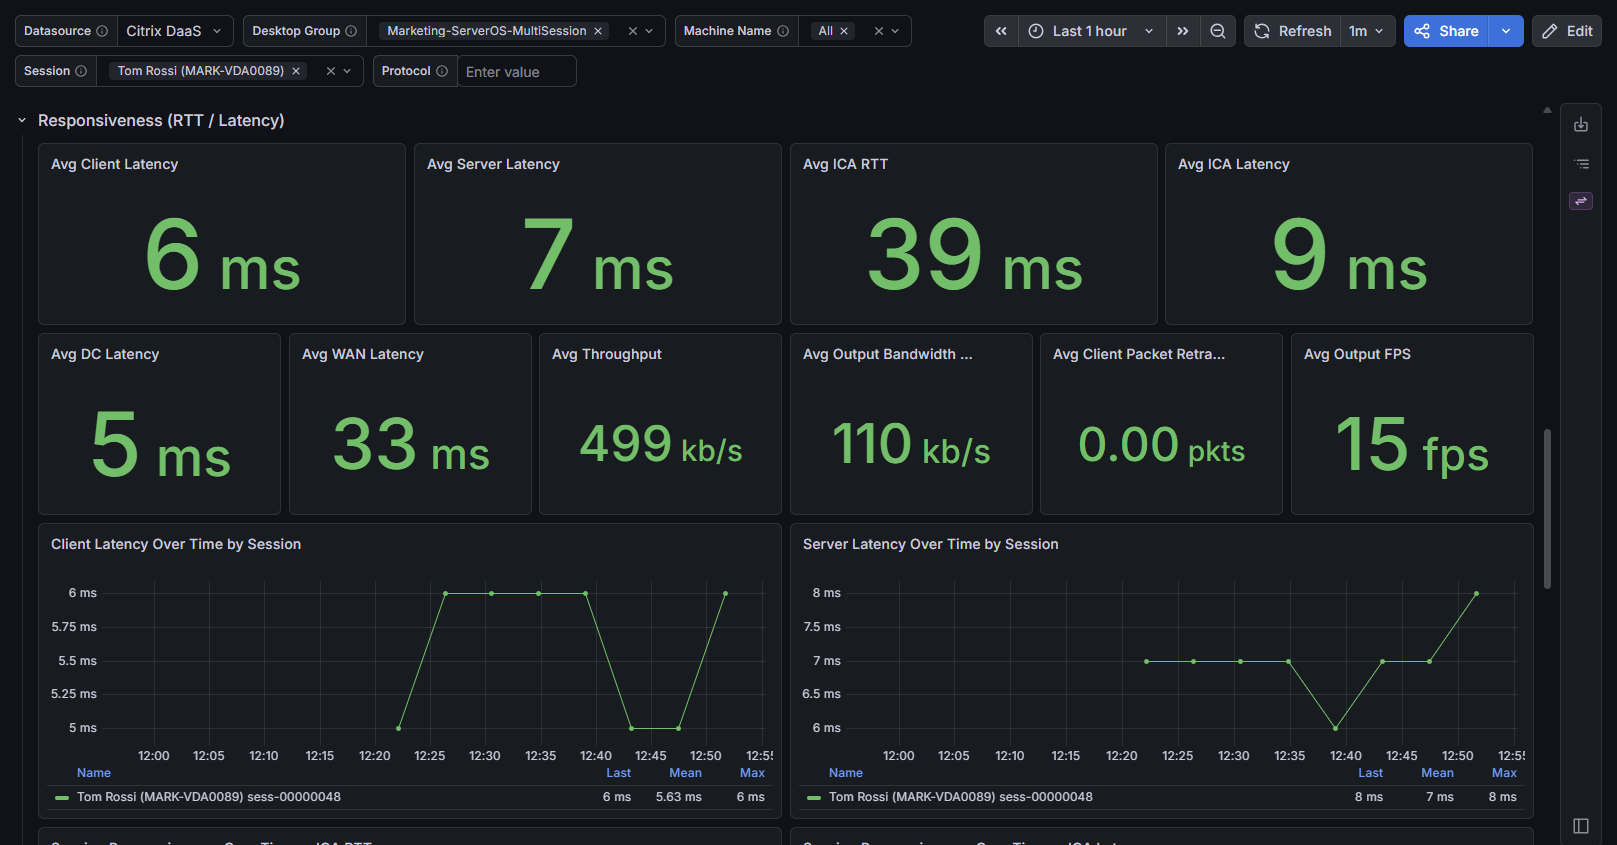
- Curated dashboards bundled with the plugin, covering session experience, machines and capacity, connections and logon, applications and stability, and site health/audit.
- Secure by design: Client ID and Client Secret stored encrypted in
secureJsonData; errors shown in the UI say what failed and what to check (for example an unreachable API Host, rejected credentials or a rate limit) without exposing credentials, tokens, URLs or upstream response text, which stay in the Grafana server log with secrets masked.
Compatibility
| Component | Supported |
|---|---|
| Grafana | >= 12.3.0 |
| Citrix DaaS API | Monitor OData API + Broker REST API |
| Authentication | OAuth2 client-credentials (Citrix Cloud API Client) |
Demonstration Video
Please find attached a demo video showcasing how to use the Citrix Daas integration.
Installation
Requirements
- A Citrix Cloud account with a Citrix DaaS (CVAD service) subscription.
- A Citrix Cloud API Client (Secure Client): Client ID + Client Secret, created under Identity and Access Management → API Access → Secure Clients. The acting administrator needs at least Read-Only Administrator scope.
- Your Citrix Cloud Customer ID (tenant short-name).
Obtain Credentials
- Log in to Citrix Cloud as an administrator.
- Go to Identity and Access Management → API Access → Secure Clients and create a new API Client (e.g.
grafana-ro). - Note the generated Client ID and Client Secret — the secret is shown only once.
- Note your Customer ID, shown in the Citrix Cloud console (tenant short-name, e.g.
loy6oujtu6a4). - Confirm the administrator associated with the API Client has at least Read-Only Administrator scope for the target site.
Configure the Data Source
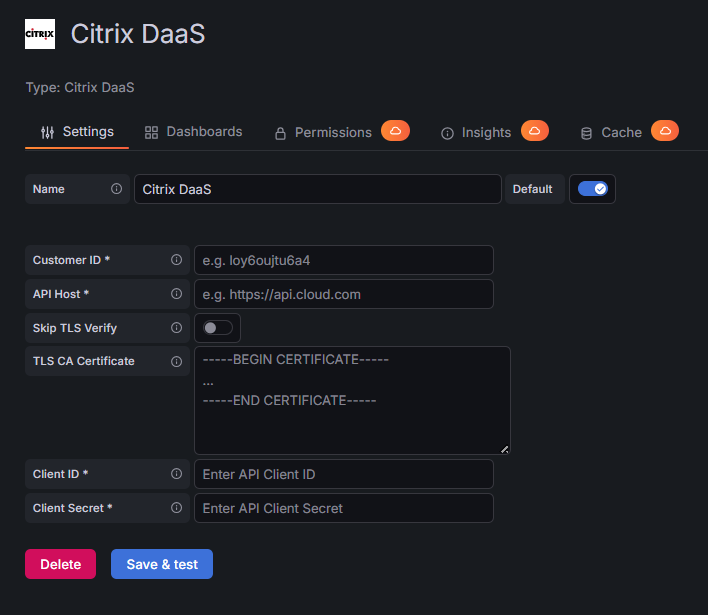
| Field | Type | Required | Description |
|---|---|---|---|
| Customer ID | string | Yes | Citrix Cloud customer ID (tenant short-name, e.g. loy6oujtu6a4). |
| API Host | string | Yes | Citrix Cloud API endpoint: https://api.cloud.com (Global), https://api.citrixcloud.jp (Japan), or https://api.cloud.us (US Government). |
| Client ID | secure string | Yes | Citrix Cloud API Client (Secure Client) ID; stored encrypted server-side. |
| Client Secret | secure string | Yes | Citrix Cloud API Client Secret; stored encrypted server-side. |
Click Save & Test to verify connectivity. The plugin authenticates, calls GET /cvad/manage/Me to resolve and cache your Site ID, and confirms live access with a probe query; errors are surfaced immediately in the Grafana UI.
Visual
Configuration Editor
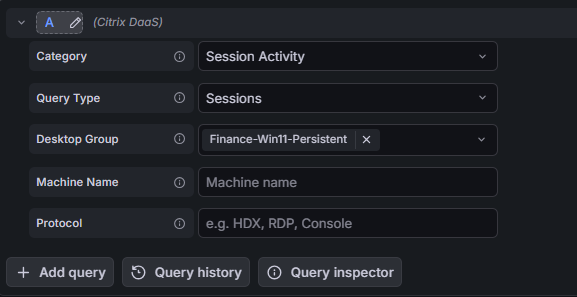
Query Editor
Dashboard: Session Experience
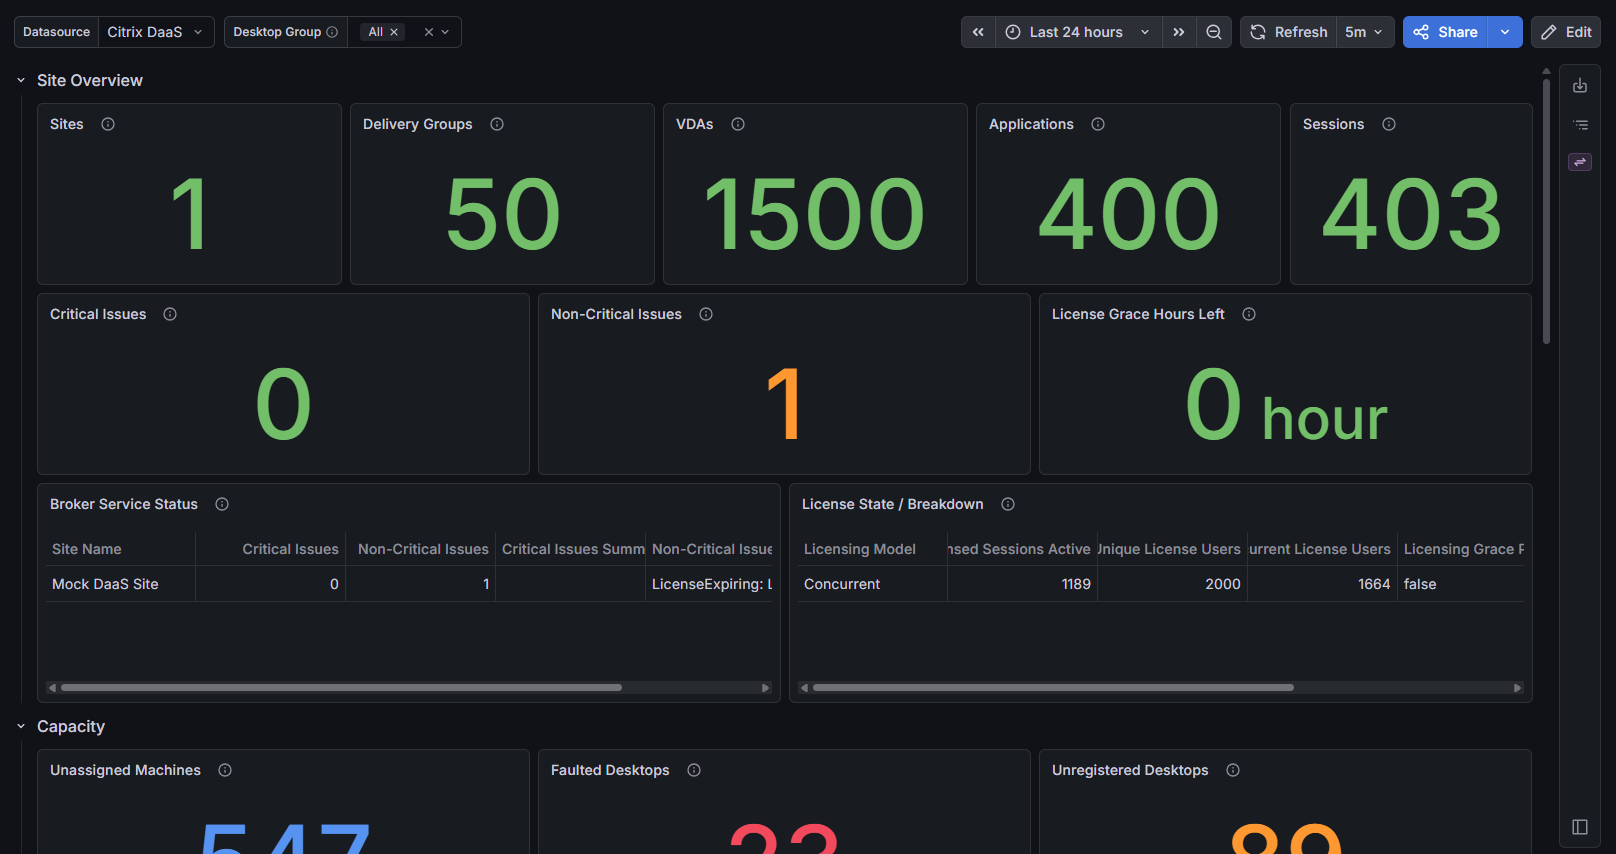
Dashboard: Site Health & Audit Logs
Usage
Query Editor
Query types are grouped by Category, which filters the Query Type dropdown to a manageable subset. Only session_metrics, app_activity, resource_utilization, and machine_metric_summary expose a Metric Type selector; every other query type returns a fixed set of columns. Contextual filters appear only for the query types that support them.
| Field | Shown when | Description |
|---|---|---|
| Category | Always | Groups query types: Site Health, Session Activity, Machines & Capacity, Application Delivery, Audit Logs. |
| Query Type | Always | Selects the Citrix DaaS resource or activity to query, scoped to the selected Category. |
| Metric Type | session_metrics, app_activity, resource_utilization, machine_metric_summary |
Selects the specific time-series metric returned for that query type. |
| Desktop Group (multi-select) | sessions, session_metrics, session_metrics_latest, connections, app_activity, app_errors, app_faults, app_instances, resource_utilization, machine_metric_summary, machines, applications |
Multi-select live dropdown (CallResource delivery-groups) to scope results to one or more delivery groups. Free-text values also accepted. |
| Machine Name (multi-select) | sessions, session_metrics, session_metrics_latest, connections, app_errors, app_faults, app_instances, resource_utilization, machine_metric_summary, machines |
Scope results to one or more machines. Options populate from the selected Desktop Group(s); exact free-text names also accepted. |
| Application Name | app_activity, app_errors, app_faults, app_instances |
Scope results to a single published application by exact name. |
| Protocol | sessions, connections |
Free-text filter (e.g. HDX, RDP, Console). |
| Session (multi-select) | session_metrics, session_metrics_latest |
Multi-select live dropdown (CallResource sessions) to scope results to one or more sessions. Free-text values also accepted. |
| Name or ID | machine_catalogs, delivery_groups, applications |
Fetch a single item by exact name or ID instead of the full inventory. |
Time-series Metric Type queries honor the panel time range. session_metrics_latest has no time filter — it always returns the most recent snapshot per session. Audit Logs use the panel time range to derive a look-back window (the Citrix Configuration Logging API only accepts a days look-back, not exact bounds), then trim results client-side to the exact range.
Query Types by Category
Site Health
| Query Type | Description |
|---|---|
site_health |
Site-wide issue counts and licensing summary. |
Session Activity
| Query Type | Description |
|---|---|
sessions |
Live and historical ICA/HDX session records. |
session_metrics |
RTT/latency time series per session (Metric Type: ICA RTT, ICA Latency, Client L7 Latency, Server L7 Latency). |
session_metrics_latest |
Most recent connection-quality snapshot per session (no time filter). |
connections |
Logon duration breakdown and disconnect diagnostics. |
Machines & Capacity
| Query Type | Description |
|---|---|
machines |
VDA machine inventory, power/registration/fault state. |
machine_catalogs |
Catalog capacity and provisioning config. |
delivery_groups |
Desktop group capacity and health. |
machine_metric_summary |
Storage IOPS/latency time series per machine (Metric Type: Avg IOPS, Peak IOPS, Avg Latency). |
resource_utilization |
CPU/memory/session time series per machine (Metric Type: Avg/Peak CPU, Avg/Peak/Total Used Memory, Total Session Count, Avg ICA RTT, Avg Logon Duration, Uptime, Uptime Without Session, Disconnect Time, Idle Time). |
Application Delivery
| Query Type | Description |
|---|---|
applications |
Published application catalog and config. |
app_activity |
Launch/usage time series per application (Metric Type: Peak Concurrent Instances, Total Usage Duration, Total Launches, Starting Instances). |
app_errors |
Application error log. |
app_faults |
Application fault log. |
app_instances |
Individual application launch/session records. |
Audit Logs
| Query Type | Description |
|---|---|
audit_logs |
Admin configuration-change activity log from Citrix's Configuration Logging API — who changed what, when, and whether it succeeded. |
Included Dashboards
Five dashboards are bundled under src/dashboards/ and provisioned with the plugin:
| Dashboard | UID | Description | Variables |
|---|---|---|---|
| Citrix DaaS: Session Experience | citrixdaas-sessions |
ICA/HDX session volume, lifecycle, duration, and connection-quality (RTT/latency). | delivery_group, machine, protocol, session_metric |
| Citrix DaaS: Machines & Capacity | citrixdaas-machines |
VDA machine inventory, power/registration/fault state, CPU/memory/storage utilization, and load. | delivery_group, machine, utilization_metric, storage_metric |
| Citrix DaaS: Connections & Logon | citrixdaas-connections |
ICA/HDX connection volume, reconnects/disconnects, security, and logon-phase waterfall. | delivery_group, machine, protocol |
| Citrix DaaS: Applications & Stability | citrixdaas-applications |
Published application catalog, launch/usage activity, instance completion, error/fault stability. | delivery_group, application, app_activity_metric |
| Citrix DaaS: Site Health & Audit Logs | citrixdaas-site-audit |
Site-wide health/licensing summary, delivery group and catalog capacity, admin configuration-change audit trail. | delivery_group, admin_user |
All name-filter variables (delivery_group, machine, application, admin_user) are plain text-box variables — type an exact name and leave empty to include every entity.
Architecture
Frontend (React/TypeScript)          Backend (Go / grafana-plugin-sdk-go)
────────────────────────────         ──────────────────────────────────────
ConfigEditor.tsx                     datasource.go    — NewDatasource, QueryData,
QueryEditor.tsx                                          CheckHealth, CallResource
datasource.ts                        client.go        — CitrixDataProvider interface
types.ts                                                 + Client (OAuth2, OData/Broker
                                                          pagination, retry/backoff)
                                     handlers.go      — per-query-type routing and
                                                          contextual filter building
                                     dataframe.go     — model → Grafana frame builders
                                     utils.go         — OData path building, enum-label
                                                          lookups, time parsing
                                     models/          — PluginSettings, query type
                                                          constants, Citrix API DTOs
Key design decisions:
- OAuth2 client-credentials with token caching: a bearer token is fetched once and cached in-memory with a 60-second expiry skew, refreshed automatically on expiry or a 401 response.
- Automatic Site ID resolution: resolved once via
GET /cvad/manage/Meand cached on the client, so Broker REST calls never require a manually configured Site ID. CitrixDataProviderinterface: decouples query handlers from the concrete HTTP client, enabling hermetic unit tests via a mock implementation.- Full pagination: Monitor OData responses are followed via
@odata.nextLink; Broker REST responses viaContinuationToken— both fetch the complete result set.
Support
For issues, questions, or feature requests, please reach out to grafanalabs.integrations@crestdata.ai
Authors and Acknowledgment
Developed by Crest Data.
License
This plugin is distributed under the Crest Data EULA. See the LICENSE file.
References
Grafana Cloud
Connect any plugin in Grafana Cloud.
- 150+ data source integrations
- Grafana Assistant - AI that correlates your data, builds queries, and answers questions
- 10k Prometheus metrics + 50 GB logs, traces, and profiles on the free tier
- ...and more
Insights
- Adoption
Running on 3 active Grafana instances.
- Activity
Last updated 28 Sep 2026.
4 releases in the past year.
- Queries
126 total queries served across all Grafana Cloud instances.
- Version
- 1.0.5
- Dependencies
- Grafana >=12.3.0
- Developer
- crestdata
Grafana Cloud
Connect any plugin in Grafana Cloud.
- 150+ data source integrations
- Grafana Assistant - AI that correlates your data, builds queries, and answers questions
- 10k Prometheus metrics + 50 GB logs, traces, and profiles on the free tier
- ...and more