
Cisco ISE Data Source Plugin for Grafana
Description
The Cisco ISE Data Source Plugin is a Grafana backend datasource plugin that enables querying and visualization of Cisco Identity Services Engine (ISE) data inside Grafana panels.
Cisco ISE is a network access control and policy enforcement platform. The plugin connects to the ISE ERS and OpenAPI/MnT APIs to retrieve active sessions, endpoint compliance, certificate lifecycle, network access policies, and infrastructure health data — all from a single Grafana datasource.
Features
- 15 query types covering 7 ISE security domains
- Dual-port support: ERS API (port 9060) and OpenAPI/MnT (port 443)
- HTTP Basic Authentication with configurable TLS verification
- API Gateway mode: route all traffic through port 443 when ISE is behind a gateway
- Automatic CSRF token handling for hardened ISE deployments (≥ 3.0); no configuration required
- Automatic pagination for all list endpoints (ERS: 100 per page, certificates: 50 per page)
- Retry with exponential backoff on ISE concurrency throttling (HTTP 503, 5xx, 429)
- 3 bundled dashboards for immediate value after installation
Compatibility
| Component | Version / Detail |
|---|---|
| Grafana | >= 12.3.0 |
| Cisco ISE | ERS API enabled; hardened deployments (≥ 3.0) supported |
| Authentication | HTTP Basic Authentication |
Visuals
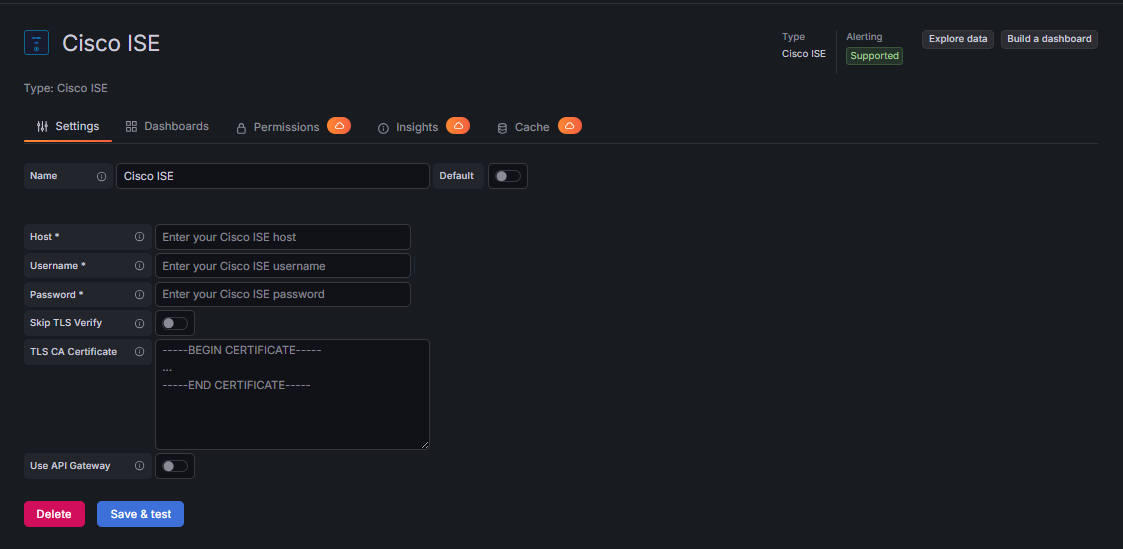
Configuration Editor
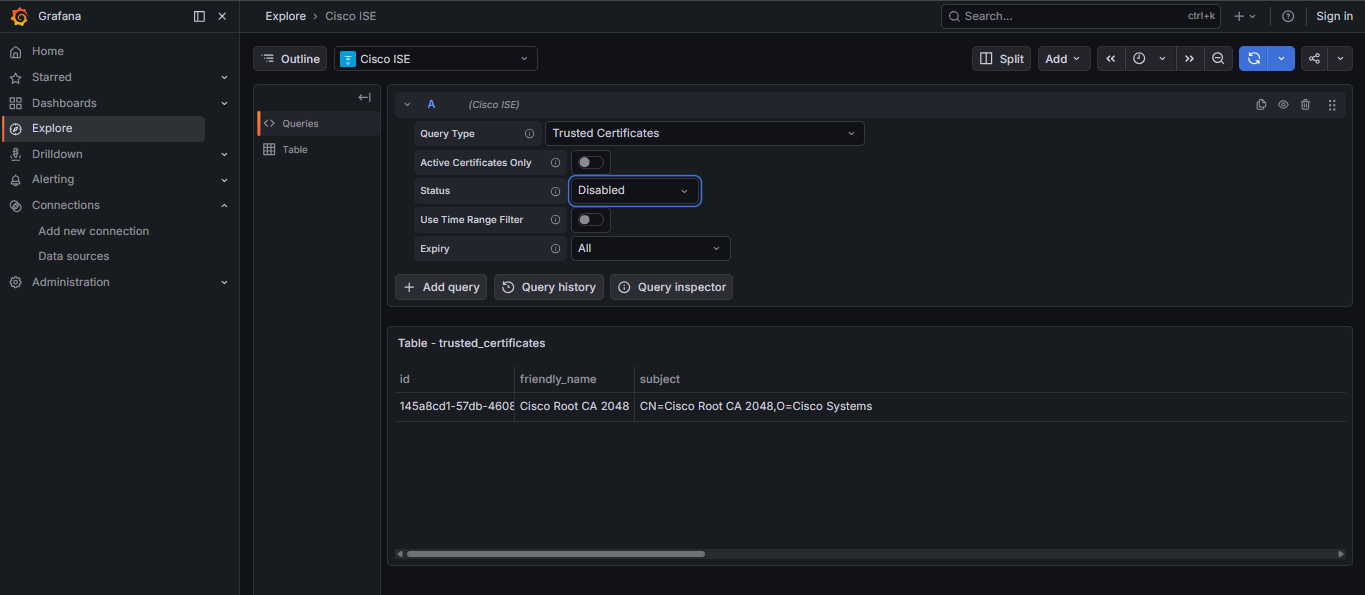
Query Editor
Installation
Requirements
- Grafana >= 12.3.0
- Cisco ISE with ERS API enabled (Administration > Settings > API Settings)
- Network access from the Grafana server to the ISE PAN on port 443 (OpenAPI, MnT) and port 9060 (ERS, unless API Gateway mode is enabled)
- ISE account must hold both ERS Admin and Super Admin roles
Obtain ISE API Credentials
- Log in to the ISE admin portal.
- Navigate to Administration > Settings > API Settings and enable the ERS API if it is not already enabled.
- Navigate to Administration > System > Admin Access > Administrators > Admin Users.
- Create or identify an administrator account and assign it both the ERS Admin and Super Admin roles.
Install the Plugin
Install the plugin from the Grafana Plugin Catalog or using the Grafana CLI:
grafana cli plugins install crestdata-ciscoise-datasource
After installation, restart the Grafana server for the plugin to be loaded.
Configure the Data Source
- In Grafana, navigate to Connections > Data Sources > Add data source.
- Search for Cisco ISE and select it.
- Fill in the required configuration fields:
| Field | Required | Description |
|---|---|---|
| Host | Yes | ISE Primary Policy Administration Node (PAN) IP or FQDN. No scheme. A port may be appended (e.g. ise.example.com:443). |
| Username | Yes | ISE administrator with ERS Admin and Super Admin roles |
| Password | Yes | ISE administrator password (stored encrypted) |
| Skip TLS Verify | No | Skip certificate verification. Use only for self-signed certs in lab environments. |
| TLS CA Certificate | No | Custom CA certificate in PEM format to validate the ISE certificate. Shown only when Skip TLS Verify is off. |
| Use API Gateway | No | Route all API calls through port 443. Enable when ISE is behind an API gateway. |
- Click Save & Test. The health check will validate your credentials against the ISE API.
TLS Configuration
For secure production environments:
- TLS with CA Certificate (Recommended): Leave "Skip TLS Verify" unchecked and provide a valid CA certificate in the "TLS CA Certificate" field.
- Skip TLS Verify: Only enable this for trusted lab environments with self-signed certificates. This skips TLS certificate validation.
Usage
Query Editor
Once the data source is configured, select a Query Type (and, where applicable, a Sub-selector) in the query editor to retrieve the corresponding ISE data.
Certificate queries (trusted_certificates) support additional filters: an active-only toggle, status (Enabled/Disabled), the Grafana dashboard time range, and an expiry dropdown (All / Expired / Non Expired / Expiring in 7 Days).
Bundled Dashboards
| Dashboard | Contents |
|---|---|
| ISE Session & Observability Monitor | Active session list, auth session list, monitoring stat counters |
| ISE Infrastructure Health | Deployment nodes, backup status, task status |
| ISE Security Posture | Endpoints, device type summary, certificates, AD joins, policy sets, authorization profiles, network devices and groups, user queries |
Error Handling and Retry Strategy
| HTTP Status | Retry | Message |
|---|---|---|
| 401 | No | Authentication failed — verify client credentials |
| 403 | No | Access denied — confirm you have sufficient permissions |
| 404 | No | Endpoint not found — verify Host |
| 429 | Yes (exp. backoff) | Rate limit exceeded |
| 500/502/503/504 | Yes (exp. backoff) | Transient Cisco ISE API error |
Max retry attempts: 3, with exponential backoff (base delay: 2 seconds — 2s, 4s, 8s).
Resources Reference
| Query Type | Sub-selector | Domain | Description |
|---|---|---|---|
active_session_list |
- | Session & Authentication | Current active RADIUS sessions (MnT API) |
auth_session_list |
- | Session & Authentication | Authentication session history for the selected time range (MnT API) |
monitoring_stats |
- | Session & Authentication | Live counts: active sessions, posture-compliant endpoints, profiler sessions |
deployment_nodes |
- | Infrastructure Health | All ISE deployment nodes with role, service, and status |
backup_status |
- | Infrastructure Health | Most recent backup job status and completion percentage |
task_status |
- | Infrastructure Health | Background task queue with execution status and counts |
user |
Internal User / Admin User / All Users | Privileged Access & RBAC | Local ISE internal user accounts, admin accounts, or a combined list (ERS) |
endpoints |
- | Endpoint Profiling & Compliance | All profiled endpoints with MAC, profile, group, and MDM compliance status |
endpoint_device_type_summary |
- | Endpoint Profiling & Compliance | Endpoint count grouped by device type |
trusted_certificates |
- | Certificate Lifecycle | Trusted certificate store with expiry tracking and rich filtering (see Query Editor) |
active_directory_joins |
- | Identity Source Integrity | Active Directory join points configured in ISE (ERS) |
network_access_policy_sets |
- | Network Access Policy | Network access policy sets with state, rank, and hit counts |
authorization_profiles |
- | Network Access Policy | ERS authorization profiles |
network_devices |
- | Network Access Policy | Network device inventory (ERS) |
network_device_groups |
- | Network Access Policy | Network device group hierarchy (ERS) |
Limitations and Recommendations
API considerations:
- The plugin automatically handles CSRF tokens for hardened ISE deployments (≥ 3.0); no configuration is required.
- List endpoints are automatically paginated (ERS: 100 per page, certificates: 50 per page).
- Enable API Gateway mode when ISE is behind a gateway so all traffic routes through port 443.
Troubleshooting:
- "Authentication failed": ensure the configured username and password are correct.
- "Access denied": confirm the ISE account holds both ERS Admin and Super Admin roles.
- "Endpoint not found": remove any
https://prefix or trailing slash from Host. The backend strips these but other parsing tools may not. - "Request timed out": caused by network latency, or by ISE concurrency throttling (rate limit exceeded).
Support
For issues, questions, or feature requests, please reach out to grafanalabs.integrations@crestdata.ai
Authors and Acknowledgment
Developed by Crest Data.
License
This plugin is distributed under a custom End User License (EULA). See the LICENSE file for details.
References
Grafana Cloud
Connect any plugin in Grafana Cloud.
- 150+ data source integrations
- Grafana Assistant - AI that correlates your data, builds queries, and answers questions
- 10k Prometheus metrics + 50 GB logs, traces, and profiles on the free tier
- ...and more
Insights
- Adoption
Running on 4 active Grafana instances.
- Activity
Last updated 20 Aug 2026.
1 release in the past year.
- Queries
0 total queries served across all Grafana Cloud instances.
- Version
- 1.0.3
- Dependencies
- Grafana >=12.3.0
- Developer
- crestdata
Grafana Cloud
Connect any plugin in Grafana Cloud.
- 150+ data source integrations
- Grafana Assistant - AI that correlates your data, builds queries, and answers questions
- 10k Prometheus metrics + 50 GB logs, traces, and profiles on the free tier
- ...and more