Plugins 〉Ask O11y


Ask O11y


Ask O11y - Agentic Observability for Grafana
![]()

Ask O11y brings an AI investigation agent directly into Grafana. It queries telemetry, calls MCP tools, builds evidence, gates risky actions, and turns live observability data into incident-ready answers.
Instead of jumping between dashboards, Explore, alert rules, runbooks, and service maps, operators can ask a question in plain language and get a traceable investigation with metrics, logs, traces, topology, approvals, and a final RCA report.
Why Teams Use Ask O11y
- Root cause analysis without tab switching: investigate alerts, regressions, and performance issues from one Grafana-native workspace.
- Evidence-first AI answers: every run records tool calls, telemetry evidence, approval state, and final report context.
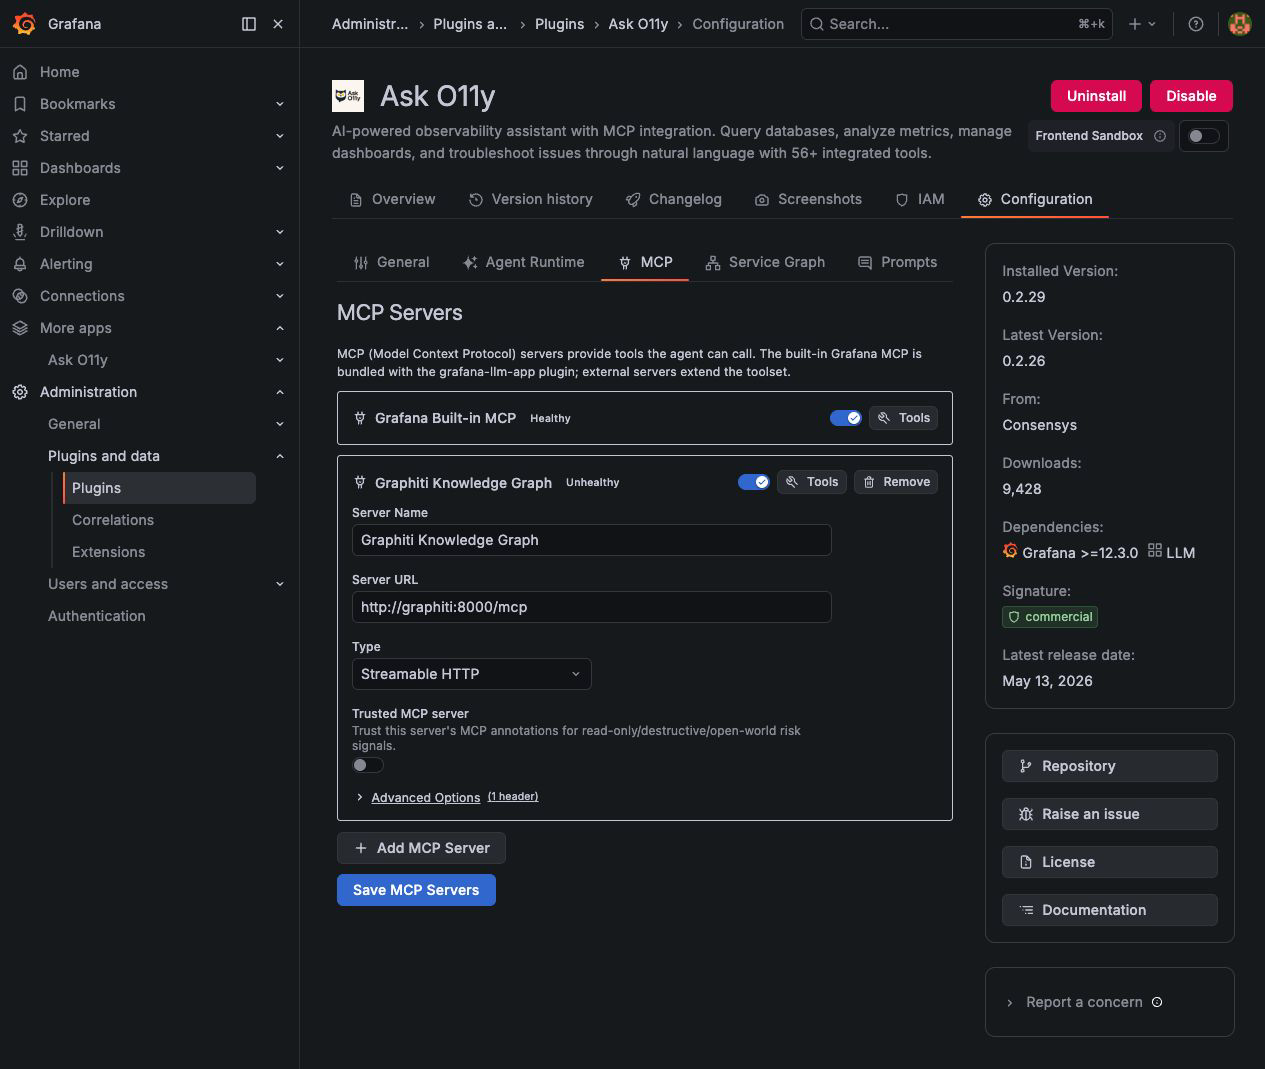
- MCP-powered Grafana automation: use built-in Grafana MCP tools or connect external MCP servers for multi-org and custom tool setups.
- Approval-gated writes: read-only investigations run quickly, while dashboard writes, annotations, destructive operations, and risky tools require explicit approval.
- Service topology memory: Graphiti-backed service graph context helps the agent reason about dependencies and incident blast radius.
- Grafana-aligned controls: RBAC, plugin settings, secure secrets, theme-safe UI, and backend resource handlers keep the agent inside Grafana's app-plugin model.
Product Tour
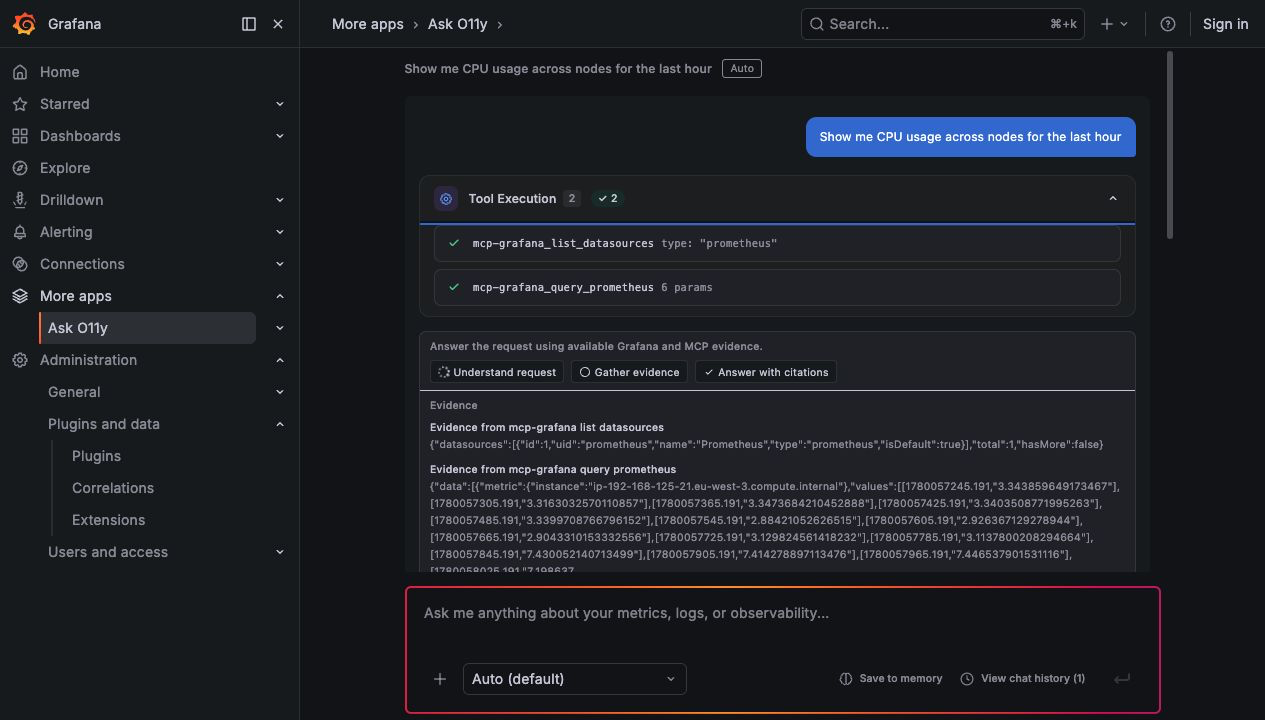
Live RCA Workspace
Ask O11y plans the investigation, gathers evidence in parallel, and keeps the operator in control when a write action needs approval.
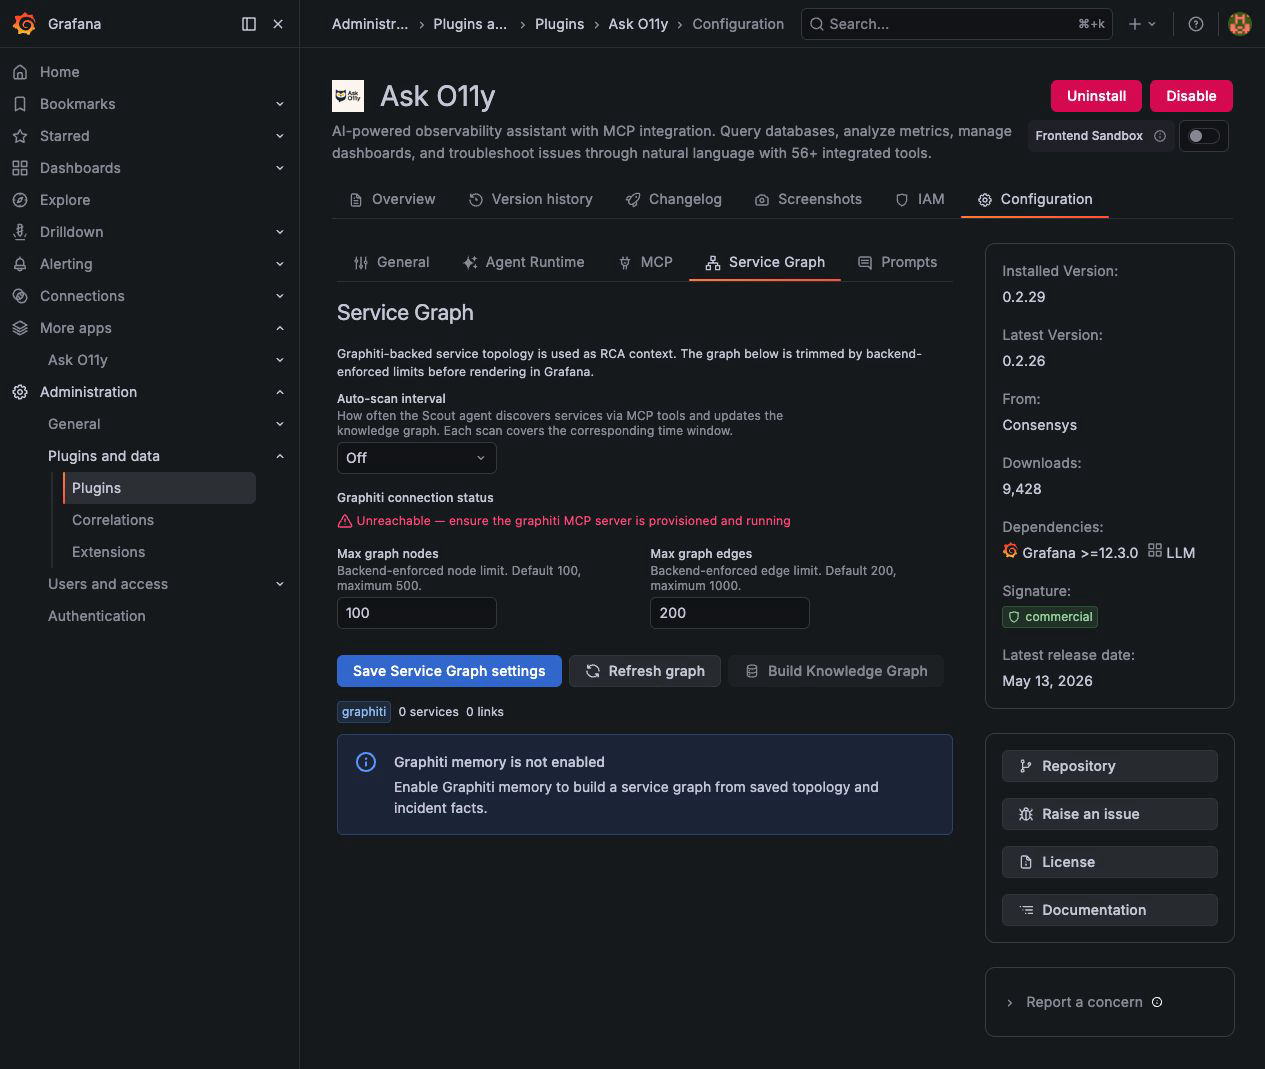
MCP And Service Graph Settings
Admin settings are organized into Grafana-native tabs for general limits, agent runtime, MCP servers, service graph controls, and prompts.
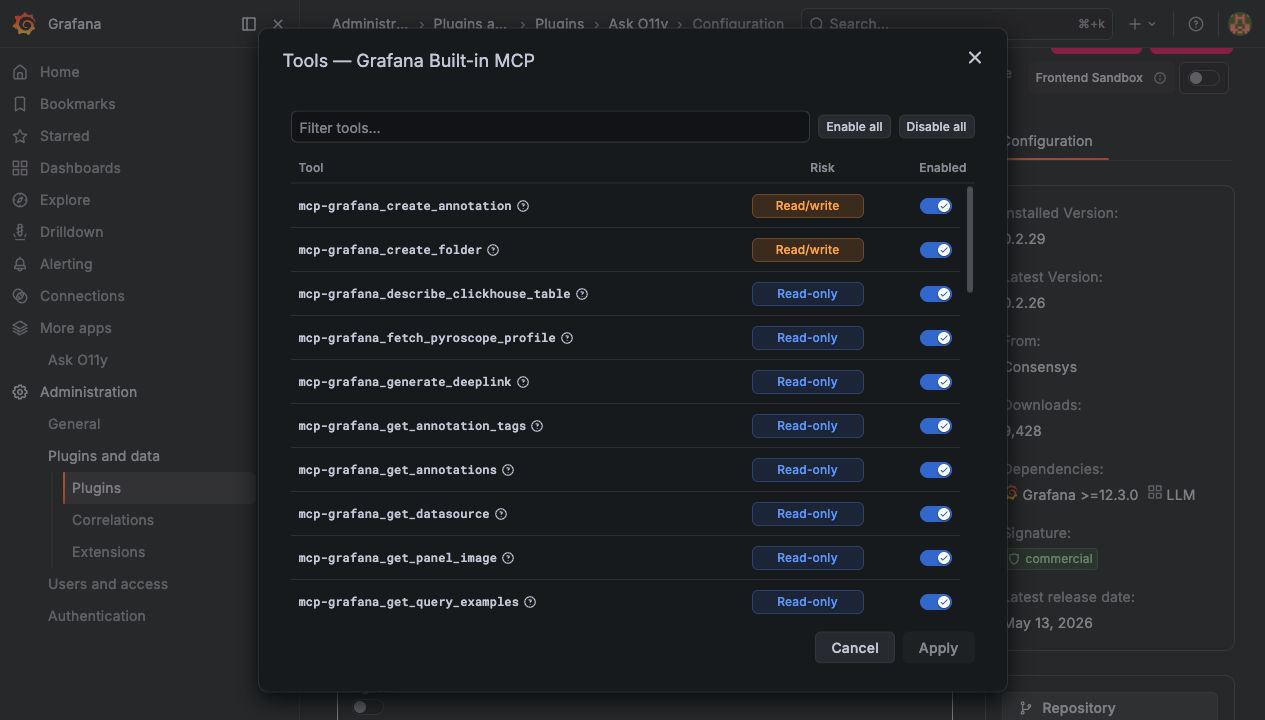
Tool Selection Controls
Choose exactly which MCP tools the agent can call. Tool names stay scannable, risk is shown in its own column, and long tool descriptions live behind hover help.
Service Graph Context
The Service Graph tab shows Graphiti connection status, scan controls, backend-enforced graph limits, and the embedded service topology view used during RCA.

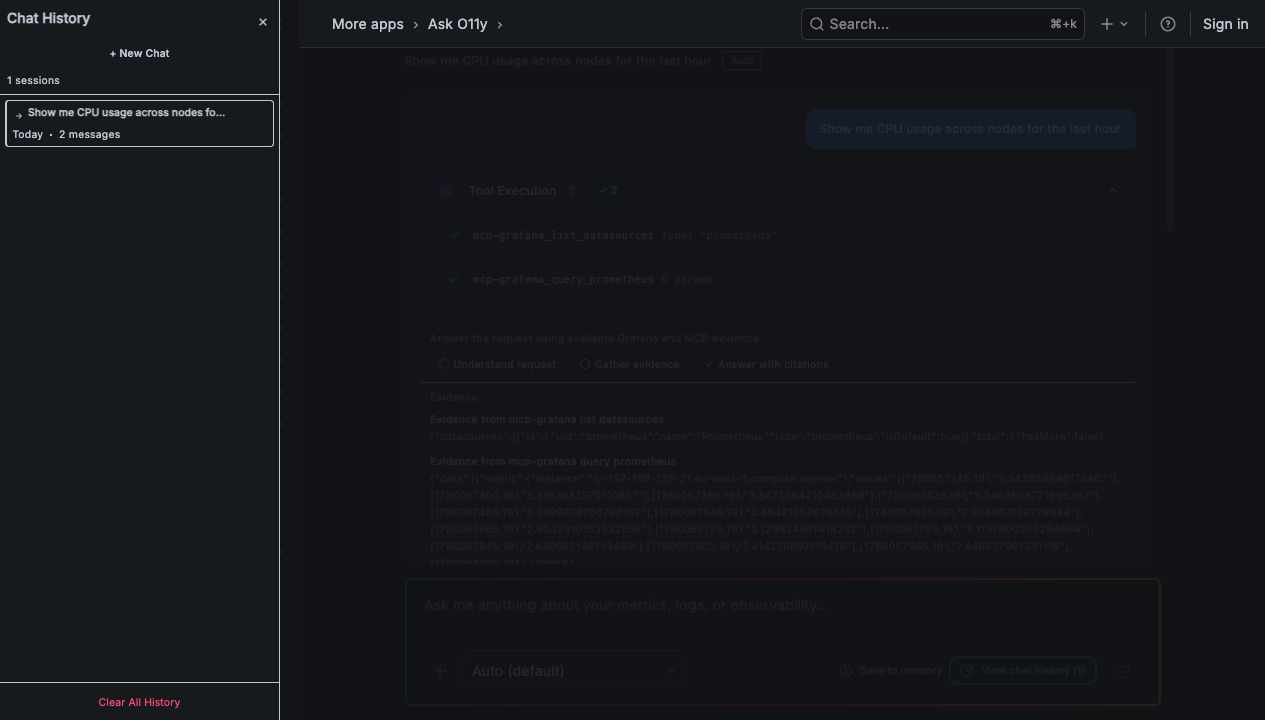
Run Trace And Evidence History
Reopen past investigations with their plan, evidence references, approval events, final report, and operational metrics.

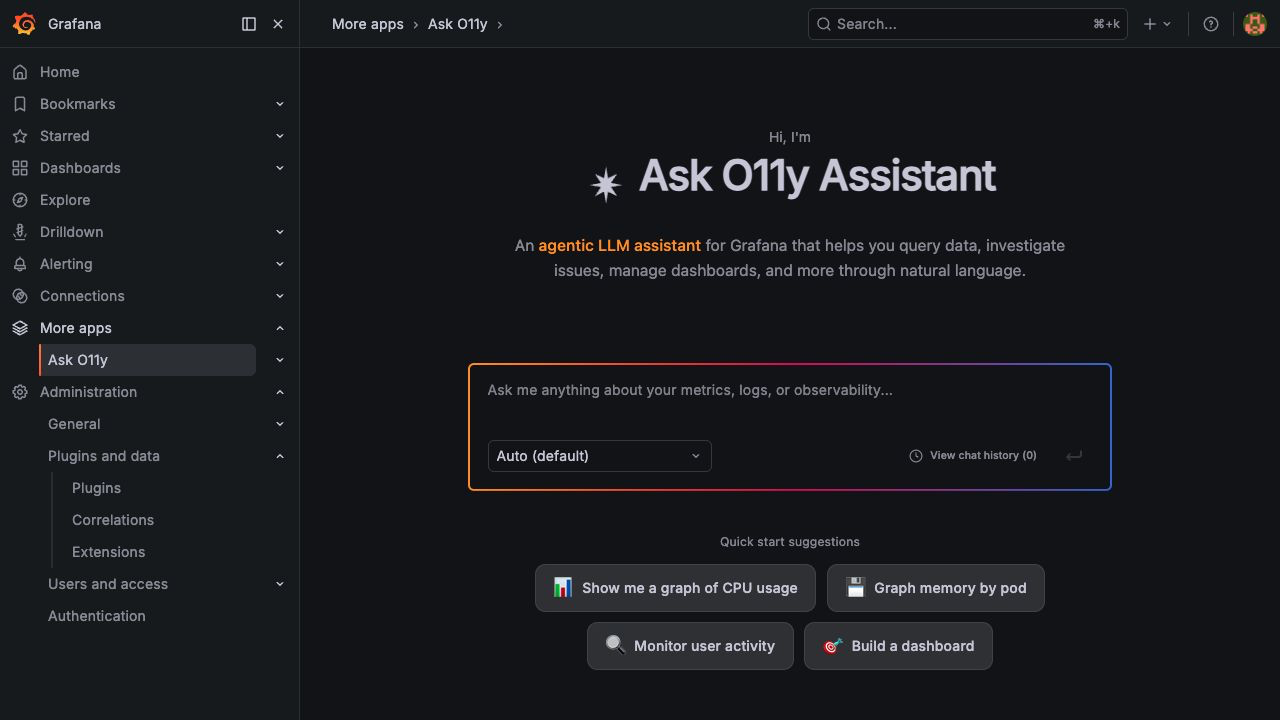
What You Can Ask
- "Investigate the checkout p95 latency alert and tell me if the last deploy is involved."
- "Find error logs for the payment service and link the traces with the longest spans."
- "Show CPU saturation by Kubernetes node for the last two hours."
- "Create an incident annotation for this outage window."
- "Map the checkout service dependencies and identify the most likely blast radius."
- "Build a dashboard panel for the API SLO burn rate."
Core Capabilities
Agentic Investigation Loop
Ask O11y runs a planner, step executor, tool scheduler, evidence ledger, approval gate, and final-report synthesizer in the Go backend plugin. Runs stream progressively into the UI with plan, step, evidence, approval, and final-report events.
Grafana And MCP Tooling
Use the Grafana LLM app and MCP tool ecosystem to query Prometheus, Loki, Tempo, Pyroscope, dashboards, alerting, annotations, folders, RBAC metadata, and other Grafana resources. External MCP servers can be added for multi-org or specialized tools.
Safe Automation
Viewer, Editor, and Admin access is enforced through Grafana RBAC and Ask O11y's tool risk policy. Read-only tools can run automatically. Write, destructive, open-world, untrusted-server, and external-communication actions can require approval before execution.
Topology And Memory
Ask O11y can use Graphiti-backed topology and historical incident memory to enrich RCA. The service graph lives in plugin settings with scan controls, connection status, graph limits, and backend-enforced trimming for large graphs.
Sessions And Sharing
Conversations are saved with history, import, and sharing workflows. Investigation sessions can be reopened with their trace and evidence so teams can audit what the agent saw and decided.
Requirements
Ask O11y requires:
- Grafana 12.3.0 or newer
- Grafana LLM app installed and configured with an AI provider
- Grafana MCP tools, either through the built-in Grafana MCP integration or an external
mcp-grafanadeployment - Grafana permissions for the users and service accounts that will run investigations or approve writes
For self-hosted Grafana deployments using managed service accounts, enable the relevant Grafana feature toggles:
environment:
  - GF_FEATURE_TOGGLES_ENABLE=externalServiceAccounts
  - GF_AUTH_MANAGED_SERVICE_ACCOUNTS_ENABLED=true
Grafana Cloud users generally do not need this self-hosted service-account configuration.
MCP Setup
Recommended: Built-In Grafana MCP
- Open Administration -> Plugins and data -> Plugins -> Ask O11y -> Configuration.
- Go to the MCP tab.
- Enable Use Built-in Grafana MCP.
- Open Manage tools to choose which Grafana tools the agent may use.
- Save the MCP settings.
The built-in Grafana MCP path is best for simple single-org deployments.
Multi-Org Or Custom Tools: External MCP
Use an external mcp-grafana sidecar when you need multi-org behavior, explicit org headers, custom auth, or additional MCP servers.
- Deploy
mcp-grafanaand point it at your Grafana instance. - Add the server in the MCP settings tab.
- Choose
streamable-http. - Add secure headers only through plugin settings.
- Mark servers as trusted only when you control them.
- Save and verify the health status.
Configuration Highlights
- General: LLM token budget, kiosk mode, chat panel placement.
- Agent Runtime: workflow version, approval policy, max parallel tool calls, eval capture.
- MCP: built-in Grafana MCP, external servers, trusted-server controls, secure headers, tool selection.
- Service Graph: Graphiti status, topology scan interval, graph build action, max node and edge limits.
- Prompts: system, investigation, and performance prompt templates.
Unsaved changes are shown per settings tab so admins know exactly what still needs to be saved.
High Availability
Ask O11y supports Grafana OSS and does not require Grafana Enterprise for the chat workflow. For multiple Grafana replicas, configure Redis in the Ask O11y plugin provisioning:
apps:
  - type: consensys-asko11y-app
    org_id: 1
    jsonData:
      useBuiltInMCP: true
    secureJsonData:
      redisURL: redis://redis:6379/0
Redis shares sessions, detached agent runs, share metadata, rate limits, and approval coordination between replicas. If Redis is not configured, in-memory state is local to each Grafana process and users may intermittently see Agent detached request failed (404): session not found when load balancing sends related requests to different replicas.
Sticky sessions are an acceptable short-term mitigation, but Redis is the recommended production configuration. See deploy/helm/ in the repository for Grafana Helm chart examples and optional Graphiti MCP wiring.
Alert Investigation Links
Add Ask O11y investigation links to Grafana alert notifications for one-click RCA:
/a/consensys-asko11y-app?type=investigation&alertName={alertName}
Operators can jump from an alert to a guided investigation, then return to Grafana context such as dashboards, Explore, Alerting, and incident views.
Security And Operations
- Secrets belong in
secureJsonData, never in the browser. - Plugin settings use Grafana-managed configuration.
- Grafana RBAC controls access to read, run, approve, write, memory, and settings actions.
- Tool risk policy separates read-only, write, destructive, untrusted, and externally communicating tools.
- Agent observability can be captured through run traces, tool errors, approval waits, and eval results.
Troubleshooting
See TROUBLESHOOTING.md for help with Grafana Cloud, self-hosted deployment, permissions, MCP connection issues, service accounts, and common plugin problems.
Support
- GitHub Issues
- GitHub Discussions
- Security issues: use GitHub Security Advisory for private disclosure
License
MIT License. See LICENSE.
Grafana Cloud Free
- Free tier: Limited to 3 users
- Paid plans: $55 / user / month above included usage
- Access to all Enterprise Plugins
- Fully managed service (not available to self-manage)
Self-hosted Grafana Enterprise
- Access to all Enterprise plugins
- All Grafana Enterprise features
- Self-manage on your own infrastructure
Install on Grafana Cloud
Plugins can be installed directly from within your Grafana instance or automated using the Cloud API or Terraform.
Learn more about plugin installationMarketplace plugins
This is a paid plugin developed by a marketplace partner. To purchase an entitlement, sign in first, then fill out the contact form.
Get this plugin
This is a paid for plugin developed by a marketplace partner. To purchase entitlement please fill out the contact us form.
What to expect:
- Grafana Labs will reach out to discuss your needs
- Payment will be taken by Grafana Labs
- Once purchased the plugin will be available for you to install (cloud) or a signed version will be provided (on-premise)
Thank you! We will be in touch.
For more information, visit the docs on plugin installation.
Installing on a local Grafana:
For local instances, plugins are installed and updated via a simple CLI command. Plugins are not updated automatically, however you will be notified when updates are available right within your Grafana.
1. Install the Application
Use the grafana-cli tool to install Ask O11y from the commandline:
grafana-cli plugins install The plugin will be installed into your grafana plugins directory; the default is /var/lib/grafana/plugins. More information on the cli tool.
Alternatively, you can manually download the .zip file for your architecture below and unpack it into your grafana plugins directory.
Alternatively, you can manually download the .zip file and unpack it into your grafana plugins directory.
2. Enable it
Next, log into your Grafana instance. Navigate to the Plugins section, found in your Grafana main menu.
Click the Apps tabs in the Plugins section and select the newly installed app.
To enable the app, click the Config tab. Follow the instructions provided with the application and click Enable. The app and any new UI pages are now accessible from within the main menu, as designed by the app creator.
If dashboards have been included with the application, they will attempt to be automatically installed. To view the dashboards, re-import or delete individual dashboards, click the Dashboards tab within the app page.
Changelog
All notable changes to the Ask O11y Grafana plugin will be documented in this file.
The format is based on Keep a Changelog, and this project adheres to Semantic Versioning.
0.2.36 (2026-06-09)
Bug Fixes
- backend: add prompt guardrails (#144) (a6f0aaa)
- feedback UX quick wins, run-plan cleanup, and topology improvements (#143) (61d5515)
0.2.34 (2026-06-03)
Bug Fixes
- agent: remove legacy runtime mode and always emit structured agent events
0.2.32 (2026-06-01)
Bug Fixes
- chat: collapse evidence details by default and complete run progress on terminal events
0.2.31 (2026-06-01)
Bug Fixes
- agent: make approve-for-session tool grants session-scoped
- chat: collapse run progress details behind an expandable progress bar
0.2.30 (2026-05-29)
Bug Fixes
- agent: coordinate approval decisions through Redis across Grafana replicas
- llm: add retry, auto fallback, and safe diagnostics for Grafana LLM 500s
0.2.29 (2026-05-29)
Features
- agent: add approval-gated agent runtime, run traces, eval routes, model routing, and MCP risk classification
- config: rework plugin settings into Grafana-native tabs with MCP, service graph, prompt, runtime, and unsaved-change controls
- docs: refresh Marketplace README and screenshots with real dev-instance captures
0.2.28 (2026-05-21)
Features
0.2.27 (2026-05-18)
Bug Fixes
0.2.26 (2026-05-13)
Bug Fixes
0.2.25 (2026-05-13)
Bug Fixes
0.2.24 (2026-05-11)
Bug Fixes
0.2.23 (2026-05-04)
Features
0.2.22 (2026-04-21)
Features
- backend: add graphiti knowledge graph integration (#119) (835c040)
- backend: anti-hallucination safeguards and mcp transport retries (#122) (04b0f11)
Bug Fixes
- backend: inject real datasource UIDs and discover list_datasources tool dynamically (#125) (bb0993c)
- mcp: unblock streamable-http transport behind OAuth/CF gateways (#123) (b1ead68)
0.2.21 (2026-04-07)
Bug Fixes
0.2.20 (2026-04-02)
Features
0.2.19 (2026-04-01)
Features
0.2.18 (2026-03-30)
Features
Bug Fixes
[Unreleased]
Fixed
- viz: resolve Prometheus, Loki, and Tempo datasources like Grafana defaults (and optional
dsUID on code fences) instead of hardcoded names (#104)
0.2.17 (2026-03-13)
Features
- add attestation to artifact (#2) (99b0a07)
- add custom loader with style (#17) (5b4abcc)
- add Right Side Panel (#3) (9bbf7c7)
- agent: server-side agentic loop with detached execution and E2E test consolidation (#46) (c5fbe29)
- agent: use alert runbook annotation during investigation (#57) (3f1bc5d)
- backend: move agent loop logic server-side with template system and PromptEditor UI (#53) (f50ff9a)
- chat: add alert investigation mode for one-click RCA (#29) (a0f129e)
- chat: add OTEL tracing and Tempo to the agent loop (#82) (4037b68)
- config: store MCP server headers and Redis URL in secureJsonData (#86) (1038a49)
- get ready for first release (#1) (bdd4c98)
- store sessions in the backend (#6) (4825a8e)
- use scene for split view (#15) (62a8f4b)
Bug Fixes
- add orgID to share urls (#18) (b08a530)
- allow plugin signing (a52542c)
- allow signing (a6e75ad)
- backend: address Grafana review feedback for Go code quality (#64) (57b42f1)
- backend: fix unreliable session history in multi-replica Grafana deployments (#69) (876e939)
- backend: make SA token fetch non-fatal and sanitize HTTP error messages (#90) (9c14ba6)
- build: filter node_modules from Go manifest (#71) (881d928)
- chat: add SSE idle timeout and allow new chat during generation (#62) (954437c)
- chat: fix autoscroll not triggering after user scrolls up (#78) (4d4c618)
- ci: add fast-pass for release-please PRs (49de748)
- ci: add workflow_dispatch trigger (75c59b4)
- ci: allow 'main' scope for release-please PRs (7aa127b)
- ci: make release-please PRs mergeable by skipping CI for non-code changes (#35) (73b1bea)
- ci: remove package.json from paths filter (05ab8b4)
- config: enhance claude setup (7d76956)
- deps: pin flatted to 3.3.3 to exclude Go files from manifest (#75) (c458ef4)
- mcp: namespace mcp-tool-settings localStorage key with plugin ID (#83) (a1e8eef)
- plugin: change per-request MCP log statements from Info to Debug (#84) (dd8f4a3)
- release: use PAT for release-please and skip GitHub Release creation (#37) (fc6014a)
- release: use simple tag format (v0.2.5 not ask-o11y-plugin-v0.2.5) (e84de65)
- share banner and limit tabs (#19) (51b491d)
- side panel disappearing after each new question (#16) (527287d)
- side-panel: open panel when links appear after session load or hard refresh (#79) (fb4d87d)
- ui: remove all console.* calls from shipped frontend code (#91) (61f59a1)
- ui: replace hardcoded colors and fixed pixel widths with Grafana theme abstractions (#87) (5f64b38)
- ui: resolve chat UX issues and frontend code quality (#66) (5ec62dc)
- version (#28) (0f9b584)
Reverts
0.2.16 (2026-03-13)
Bug Fixes
0.2.15 (2026-03-12)
Bug Fixes
- backend: make SA token fetch non-fatal and sanitize HTTP error messages (#90) (9c14ba6)
- ui: remove all console.* calls from shipped frontend code (#91) (61f59a1)
0.2.14 (2026-03-11)
Features
- chat: add OTEL tracing and Tempo to the agent loop (#82) (4037b68)
- config: store MCP server headers and Redis URL in secureJsonData (#86) (1038a49)
Bug Fixes
- chat: add SSE idle timeout and allow new chat during generation (#62) (954437c)
- mcp: namespace mcp-tool-settings localStorage key with plugin ID (#83) (a1e8eef)
- plugin: change per-request MCP log statements from Info to Debug (#84) (dd8f4a3)
- ui: replace hardcoded colors and fixed pixel widths with Grafana theme abstractions (#87) (5f64b38)
0.2.13 (2026-03-09)
Bug Fixes
- chat: fix autoscroll not triggering after user scrolls up (#78) (4d4c618)
- side-panel: open panel when links appear after session load or hard refresh (#79) (fb4d87d)
0.2.12 (2026-03-06)
Bug Fixes
0.2.11 (2026-03-06)
Bug Fixes
Reverts
0.2.10 (2026-03-04)
Bug Fixes
0.2.9 (2026-03-03)
Features
Bug Fixes
- backend: address Grafana review feedback for Go code quality (#64) (57b42f1)
- ui: resolve chat UX issues and frontend code quality (#66) (5ec62dc)
0.2.8 (2026-02-18)
Features
0.2.7 (2026-02-14)
Features
Bug Fixes
- config: enhance claude setup (7d76956)
0.2.6 (2026-02-06)
Features
- add attestation to artifact (#2) (99b0a07)
- add custom loader with style (#17) (5b4abcc)
- add Right Side Panel (#3) (9bbf7c7)
- chat: add alert investigation mode for one-click RCA (#29) (a0f129e)
- get ready for first release (#1) (bdd4c98)
- store sessions in the backend (#6) (4825a8e)
- use scene for split view (#15) (62a8f4b)
Bug Fixes
- add orgID to share urls (#18) (b08a530)
- ci: add fast-pass for release-please PRs (49de748)
- ci: add workflow_dispatch trigger (75c59b4)
- ci: allow 'main' scope for release-please PRs (7aa127b)
- ci: make release-please PRs mergeable by skipping CI for non-code changes (#35) (73b1bea)
- ci: remove package.json from paths filter (05ab8b4)
- release: use PAT for release-please and skip GitHub Release creation (#37) (fc6014a)
- release: use simple tag format (v0.2.5 not ask-o11y-plugin-v0.2.5) (e84de65)
- share banner and limit tabs (#19) (51b491d)
- side panel disappearing after each new question (#16) (527287d)
- version (#28) (0f9b584)
0.2.5 (2026-02-06)
Features
- add attestation to artifact (#2) (99b0a07)
- add custom loader with style (#17) (5b4abcc)
- add Right Side Panel (#3) (9bbf7c7)
- chat: add alert investigation mode for one-click RCA (#29) (a0f129e)
- get ready for first release (#1) (bdd4c98)
- store sessions in the backend (#6) (4825a8e)
- use scene for split view (#15) (62a8f4b)
Bug Fixes
- add orgID to share urls (#18) (b08a530)
- ci: add fast-pass for release-please PRs (49de748)
- ci: add workflow_dispatch trigger (75c59b4)
- ci: allow 'main' scope for release-please PRs (7aa127b)
- ci: make release-please PRs mergeable by skipping CI for non-code changes (#35) (73b1bea)
- ci: remove package.json from paths filter (05ab8b4)
- release: use simple tag format (v0.2.5 not ask-o11y-plugin-v0.2.5) (e84de65)
- share banner and limit tabs (#19) (51b491d)
- side panel disappearing after each new question (#16) (527287d)
- version (#28) (0f9b584)
0.2.4 (2026-02-05)
Features
- add attestation to artifact (#2) (99b0a07)
- add custom loader with style (#17) (5b4abcc)
- add Right Side Panel (#3) (9bbf7c7)
- chat: add alert investigation mode for one-click RCA (#29) (a0f129e)
- get ready for first release (#1) (bdd4c98)
- store sessions in the backend (#6) (4825a8e)
- use scene for split view (#15) (62a8f4b)
Bug Fixes
- add orgID to share urls (#18) (b08a530)
- ci: add fast-pass for release-please PRs (49de748)
- ci: allow 'main' scope for release-please PRs (7aa127b)
- share banner and limit tabs (#19) (51b491d)
- side panel disappearing after each new question (#16) (527287d)
- version (#28) (0f9b584)
0.1.0 - 2026-01-XX
Initial release of Ask O11y - AI-powered observability assistant for Grafana.
Added
Core Features
- Natural Language Query Interface: Conversational AI assistant for querying metrics, logs, and traces
- Real-time Streaming Responses: Live LLM responses with tool execution status updates
- Interactive Visualizations: 8 chart types (time series, stats, gauge, table, pie, bar, heatmap, histogram)
- On-the-fly Visualization Switching: Change chart types without re-running queries
- Session Management: Persistent chat sessions with localStorage support
- Quick Suggestions: Context-aware query suggestions based on Grafana environment
MCP Integration
- Model Context Protocol Support: Integration with MCP servers for extensible tool capabilities
- 56+ Grafana Tools: Complete dashboard, datasource, alerting, and query management
- Multiple Transport Types: Standard MCP, OpenAPI/REST, SSE streaming, HTTP streamable
- Dynamic Tool Discovery: Automatic detection of available tools from configured MCP servers
- Multi-server Aggregation: Proxy and aggregate tools from multiple MCP servers
Security & Access Control
- Role-Based Access Control (RBAC): Admin/Editor full access (56 tools), Viewer read-only (45 tools)
- Multi-tenant Organization Isolation: Secure data isolation per user, with sessions organized by organization
- Grafana Permission Integration: Respects existing Grafana datasource permissions
- Secure Credential Storage: Integration with Grafana's secure storage mechanisms
Visualization Features
- Time Range Controls: Built-in time picker with common presets
- Auto-refresh: Configurable intervals from 5 seconds to 1 hour
- Query Export: Copy PromQL/LogQL/TraceQL queries to clipboard
- Theme Support: Automatic light/dark theme integration
- Expandable Charts: Full-screen chart analysis mode
- Responsive Design: Mobile and desktop optimized layouts
Developer Experience
- TypeScript: Strict type checking with comprehensive type definitions
- React 18: Modern React with hooks and functional components
- Tailwind CSS: Utility-first styling with Grafana theme integration
- Go Backend: High-performance MCP proxy server
- Comprehensive Testing: Unit tests (Jest), E2E tests (Playwright), Go tests
- Hot Module Reload: Fast development workflow with webpack dev server
Data Source Support
- Prometheus: PromQL query execution with metric visualization
- Loki: LogQL query execution with log exploration
- Tempo: TraceQL query execution with trace analysis
- Generic Datasources: Query any Grafana datasource through natural language
Tool Categories
- Datasource Operations: Query, list, test connectivity, health checks
- Dashboard Management: Create, update, delete, search, star, snapshot
- Alert Management: Configure alerts, silences, notification channels, contact points
- Query Execution: Run queries with automatic visualization
- Resource Discovery: Search and explore Grafana resources
- Panel Operations: Manage dashboard panels and visualizations
- Folder Management: Organize dashboards with folder operations
- User Management: Query user information and permissions
Technical Details
Frontend Stack
- React 18.2.0 with TypeScript 5.5.4
- Grafana UI Components (@grafana/ui, @grafana/data, @grafana/scenes)
- Tailwind CSS 4.1.12 for styling
- RxJS 7.8.2 for reactive state management
- Model Context Protocol SDK (@modelcontextprotocol/sdk)
Backend Stack
- Go 1.23+ with Grafana Plugin SDK
- MCP Go SDK for server integration
- Multi-transport proxy server
- Health monitoring and connection management
Build & CI/CD
- Webpack 5 for frontend bundling
- Mage for Go build automation
- Multi-platform builds (Linux amd64/arm64, macOS amd64/arm64, Windows amd64)
- GitHub Actions CI/CD pipeline
- Automated testing and validation
- Plugin signing support
Supported Grafana Versions
- Minimum: Grafana 12.1.1
- Tested: Grafana 12.x and Enterprise editions
Dependencies
Plugin Dependencies
- grafana-llm-app: Required for LLM provider integration
Key Libraries
- @grafana/* packages: Core Grafana integration
- @modelcontextprotocol/sdk: MCP client functionality
- js-tiktoken: Token counting for LLM context management
- streamdown: Markdown streaming utilities
Notes
- This is the initial community release
- Requires LLM API key configuration (OpenAI, Anthropic, or compatible provider)
- MCP server configuration required for full functionality
- MIT License