Building Grafana Cloud for next-generation cost-efficiency and scale
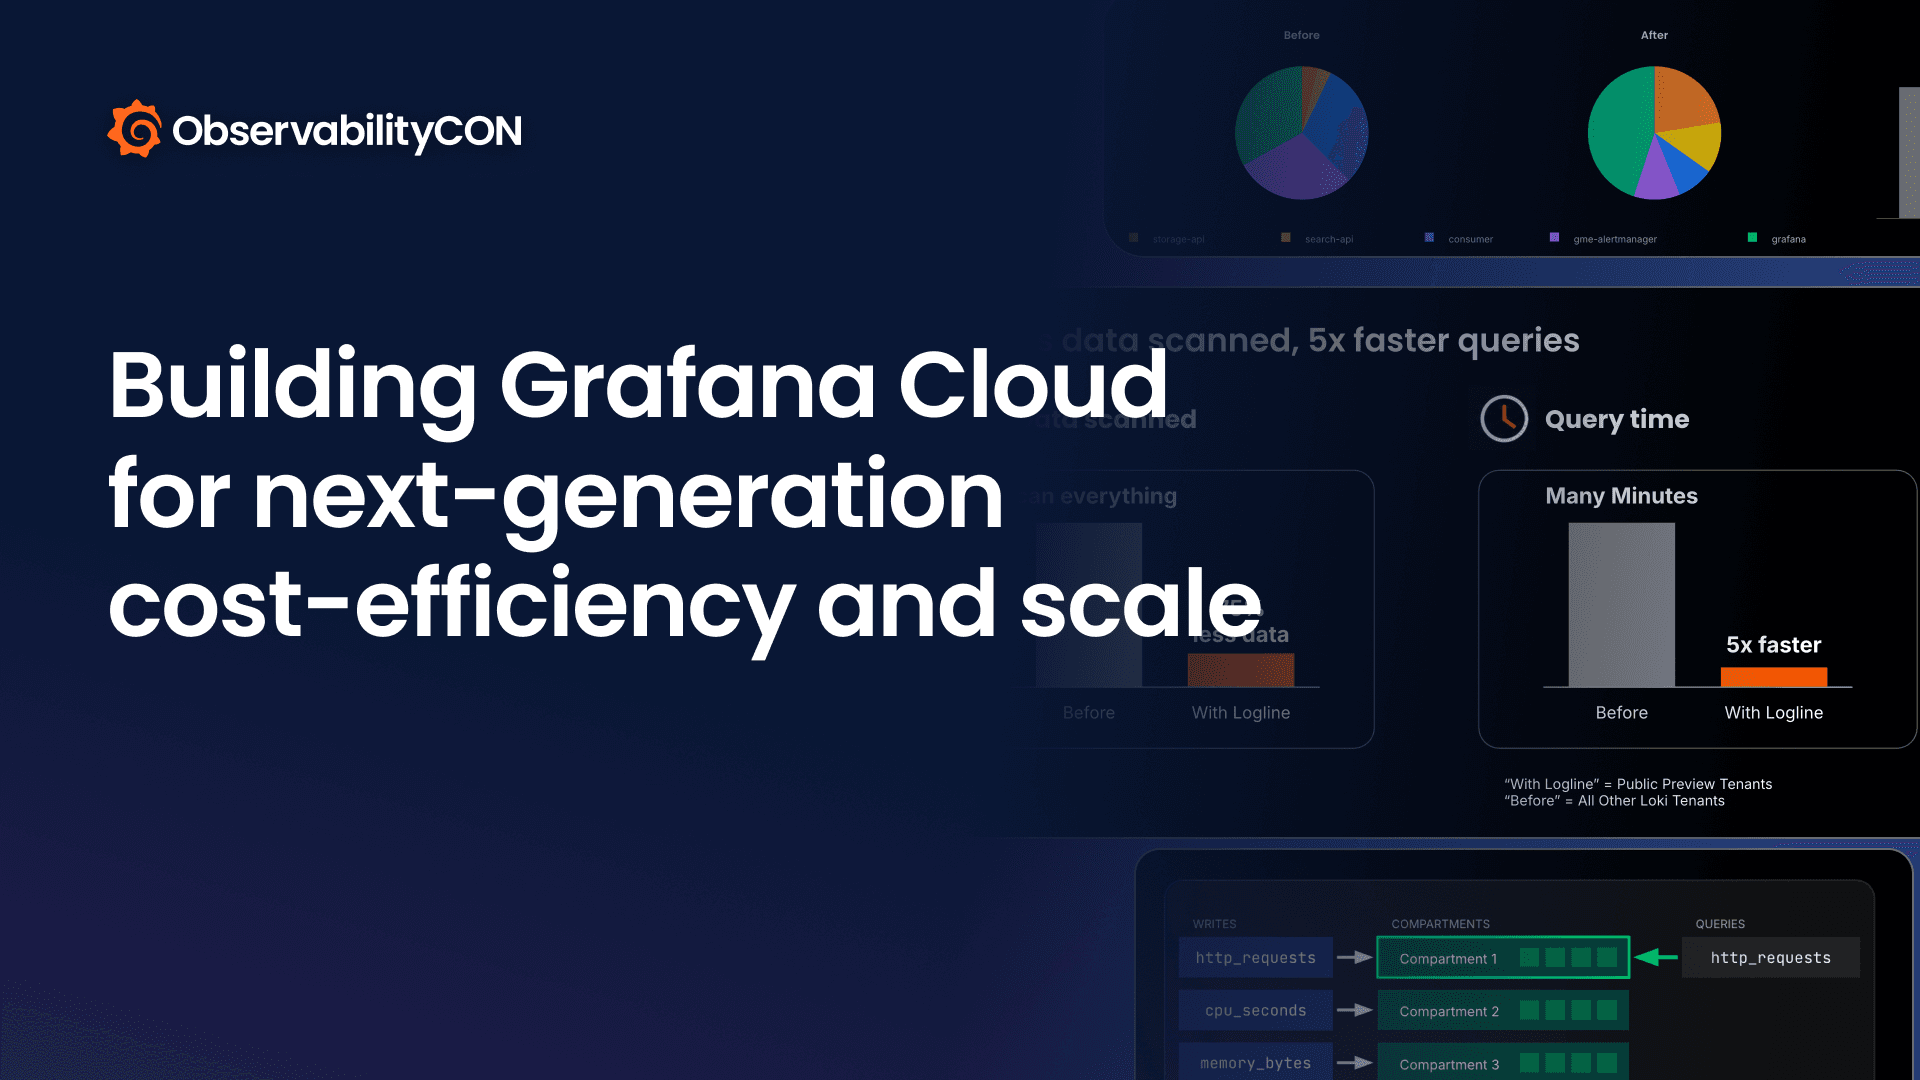
Grafana Cloud already has a strong reputation for cost efficiency at scale, but we’re not stopping there. In this session, members of the Grafana Labs engineering and product teams show how Grafana Cloud and the open source databases that power it — Mimir, Loki, Tempo, and Pyroscope — are evolving for the next step-function change in observability data volumes.
We'll go deep on Mimir, already tested well past 1 billion active series, which is raising the ceiling on ingestion volume and query speed with a new compartmentalized architecture. We'll also give an update on needle-in-the-haystack queries, which we first previewed at GrafanaCon: a new secondary index for Loki that accelerates log queries by shrinking the volume of data that needs to be scanned. We'll share results from early customer deployments as well as what we’ve learned along the way.
Adaptive Telemetry sits on top of this foundation as a second lever for cost efficiency and scale that shrinks data volumes rather than just handling more of them. New capabilities make this more effective than ever before. See a demo of how routing can send telemetry to the storage tier that fits its use case and replay brings colder data back when it matters. Auto-apply and intelligent sampling handle that optimization autonomously, blending in human-in-the-loop control, so you get exactly the telemetry you need, without spending extra time managing it.
Speakers

Steven Dungan
Staff Product Manager, Grafana Labs

Patrick Oyarzún
Principal Software Engineer, Grafana Labs

Jonathan Halterman
Principal Engineer, Grafana Labs

Jason Nochlin
Distinguished Engineer, Grafana Labs
Steven Dungan: We have a good one for you here for the next 40 or so minutes. A lot of good stuff to announce. I know we teased some of it yesterday, but we're going to go into a little bit of depth about what we are doing to help customers manage and work with Grafana Cloud at scale.
So I'm Steven. I'm a staff product manager here at Grafana Labs. I love my work. I love being a remote company. It lets me spend a lot of time outside. It also lets me spend a lot of time of my workday at home with my cat. So it's a great work setup, but I'm here to talk mostly about work today. And what we're going to talk about today is basically our central thesis of the world is there's already too much telemetry, but the rate of telemetry being generated by AI is going to make things even worse.
I think many of us remember the consequences of the advent of Kubernetes and cloud native, the shift from monolithic architectures to microservices architectures. It created deluge of data. All the costs that went with it and complexity went with it, but not necessarily commensurate value. More data was stored, it cost lots of money. It made things more complicated, but there was also more noise. Queries had to diverse more data. Humans had to sift through more to find their answers.
These are some of the things that customers tell us is causing some of this growth. All of these look familiar. Maybe some of these look new, but generally what we're hearing is basically this new evolution of data. So our question for y'all is basically how you will handle this, but we've come up with some ideas and some features that will help you do this.
So more acutely, the challenges and the pain points that we think are going to emerge or be exacerbated in this new world is you, your alerts, your agents won't be able to find the smoking gun needed to know when something is wrong and where to triage with all this data. The deluge of additional data without any prioritization mechanism won't help you maintain healthier systems or diagnose issues quickly, but it will show up in your bill and you'll have to fight sheer scale anytime a query is run because queries would just touch more data and be slower. People don't like slow queries.
Oh, going the wrong way. All right. So what do we have to talk to you about today? I have a large team of people who've worked on this, gone on this journey with me for the last year plus, and we're very excited to unveil where we are today. We're going to cover specifically five areas that are going to help you, whether you're an SRE or platform administrator or even a developer who's trying to use our tools to solve observability problems day to day. We're going to help you be a hero for your company. Everyone wants to be a hero, right? Maybe without the cape, but still a hero in a different context. We'll help you be the hero for your company in this changing world.
So to start, we're going to talk about full text search and logs and I'm proud to bring out Jason Nochlin to talk about that.
Jason Nochlin: Hello. Hi, I'm Jason Nochlin as the founder of a one-person company called Logline that Grafana acquired last year and that has become full tech search in Loki. So that's what I will be sharing with you today. Who's excited for faster queries? Awesome.
Oh, so a little bit about me outside of building databases. I play fetch with my dog. I am a blue belt in jujitsu. That's not me and Mark Zuckerberg, but it could be. And I have three kids, one of which just started kindergarten. So keeping very busy outside of the database development.
So imagine it's 1:00 AM and you get paged and you need to look up a specific request ID in your log stack. How quickly can you find the log line that matters? This is actually very, not even a too contrived scenario. I was on my honeymoon in Thailand and I was the CT of a small company at the time and got paged while on the beach because the queue was clogged and my wife still doesn't know what that means to this day.
I get asked about it like, "Did you need a plunger?" But yeah, so being able to solve that quickly and get back to the beach and sipping coconuts was very important in that moment. And when you get one of these out-of-hours pages, you definitely do not want to be thinking about your observability system or having to remember the specific syntax or specific labels to find your logs. You want to just get the answer, fix the problem and move on.
So in Loki, how long that process took depended on not traversing too many logs. So we have the time range and the label selectors. If you had a very broad label selector over a wide time range and you needed to find a specific trace ID, Loki's query engine would have to churn through all of the logs in that haystack, we call it, to just find those few matches.
And this could take minutes and lead to slowing down, having to think about your observability system and frustration.
So Logline was acquired by Grafana to give a better path to Loki. We announced the acquisition at GrafanaCON four months ago and it's a secondary index that just runs in parallel to the Loki write path. It uses ngrams, encoding, bitmaps, indexes under the hood. If you're interested in that stuff, find me after. I did not have time to cover it on this particular talk. And we did a lot of performance engineering to make it fast and efficient.
This is a novel patent pending indexing technique. We looked at the existing solutions. There was always trade-offs in terms of computational expense or how effective they would be or how Loki worked previously, which was just scanning too much data. And Logline really brings a state-of-the-art efficiency for finding rare values that is better than any of the existing common techniques.
And we've been in private preview in Grafana Cloud for the last few months and the results have been pretty awesome. So we see these are the averages. So we think about this in two ways. On the left is data scanned. So we looked at in total, how much data do the queries that are supported by the indexing today, which I'll cover later, scan for the cohort of the preview participants versus other large tenants in Loki. And the preview tenants scan on average 75% less data. So that was really awesome to see that. And then the query times have also gotten even faster. So we see 5x faster on average for queries that do have this needle in the haystack profile of only returning a few lines inside a big haystack. So the initial performance numbers are looking great. The other exciting piece of this is around cost.
So who's running open source Loki here? Yeah, we got a few. So it's cost-effective for us to run or if you're self-hosting, it will be cost-effective for you to run. So we were able to bring this indexing to every log line and field in your logs. It's not limited to structured metadata or anything like that that we have with some other Loki features. There's no specific configuration for the indexing. It just runs on the type of filters that it supports, just like you run the same queries, they're just faster now. And we're going to be bringing this into cloud logs at no additional costs because the efficiency is so high. So it's both fast and free. How often do you hear that? That's pretty cool.
And then don't just take my word for it. We asked some companies in the preview how it's going for them and this is a pretty awesome result. So this company, Timo at DATEV, had these queries they were running that normally scan terabytes and took three minutes to return. And as soon as we turned on Logline in their stack, the queries dropped to under three seconds. So down to only 100 gigabytes because the indexing was able to skip the 80 to 90% of the candidate chunks that we ruled out as not possibly matching the needle. So that was really awesome to see instance results, especially with a very early customer that definitely took a flyer on trying this out when it was unproven.
Oh yeah. So now for the demo, I'm going to switch over to the demo and show you this in action. Oh, it's up. So this is trying to simulate this needle in the haystack scenario. This panel up here is just a look back seven days ago in the logs, so like picking to some trace IDs. So picking a random needle that was seven days ago. I'm going to change this query to be over the last 30 days and then just find one of these, oops, find one of these values. Hopefully the password manager stays out of the way on this.
So on the left we have the query running with Logline and on the right we have it running without Logline. So you can see the query with Logline finished in 1.5 seconds. We're still waiting for the query on the right without Logline. Is that right? Yes.
Oh, it reported... It should be something like 570 seconds. I don't know why it's reporting a much lower value, but yeah, we... There we go. Okay. So this is the speed-up we expect. Thank you.
Yeah, so the query took 30 seconds and scanned 750 gigabytes without the indexing. With it, it dropped down to 500 megabytes and returned in one and a half seconds, and we can make that even better coming soon. So I'm going to switch back to the slides. Cool. And yeah, just to wrap up. So the Logline name is going away. We're calling this full text search in Loki. It's generally available now in Cloud Logs. We're doing a phase rollout that will end in around the middle of November. So every Cloud Logs customer will have this in the next four weeks or so.
Reemphasize, there's no additional costs. This is just going into existing Loki, making it faster and more efficient.
There are some caveats on specific shapes of queries that we support versus don't support, and there's more work being done on that to broaden the amount of supported queries. So if you do have a Loki instance, check the public Cloud Log docs. Also, if you just Google needle in a haystack Grafana Cloud or ask your AI tool about that, it'll find this link and tell you about it. So you can find the details on the types of queries that are supported versus not there.
It's also coming to Loki OS soon. I know this was announced in the keynote. I got a number of questions about it yesterday. We have an upcoming release 4.0 in the next... I don't know exact timeline, but should be within the next couple months. So this will either be available in 4.0 or a fast follow release 4.1. So look for that.
And yeah, very excited to have the faster and more efficient queries as we see an increase in query volumes from agents and humans. So making all those process more efficient for everyone and every robot will be great. So thank you.
I will now pass it over to Jonathan to talk about scaling metrics.
Jonathan Halterman: Hello everybody. My name is Jonathan. I'm an engineer working on Grafana Cloud Metrics. And today I'm going to be telling you about some of our plans to increase the scalability of Grafana Cloud Metrics and the Mimir Open Source Project. So as Steven mentioned earlier, AI infrastructure has been driving massive observability growth. Some of the banks and data platforms we've talked to are expecting 2 to 3x growth over the next few years. And some of the AI companies we've talked to are growing even faster, seeing double-digit growth and doubling their data in just a matter of months. And with all this growth, we wanted to make sure that we're providing enough headroom for our customers' needs in the future.
So Grafana Cloud right now runs several clusters for customers of up to 1 billion active series, but we wanted to set an aggressive goal and to be able to run clusters of 10 billion active series worth of metric data. So 10 times the amount of metric data without sacrificing any of the things that are important to you, performance, reliability and cost. Usually, when you're scaling a metrics database, there comes an inflection point where things start to break down. As more and more data has to be scanned to process a request, the requests can become slower, inefficiency can cause higher resource usage costs, and ultimately, these things incentivize you to want to split up your data into multiple clusters, which is not a great experience. And so I want to walk through briefly why this happens before I talk about how we solved it at Grafana Labs.
So with a typical metrics database, when a request comes in, it has to be processed by multiple nodes under the covers. And as the database grows from three nodes to six nodes to maybe six or 600 nodes, 6,000 nodes even, the amount of fan out that has to happen to process a single request can end up being a drag on efficiency. And this is what we saw with Mimir. So with Mimir, when we tested up to several billion active series, we saw that fan out eventually started to drag down our efficiency. And so the way that we solve for this was adopting what's effectively a cellular architecture, and we call these sub cells compartments. So each compartment is responsible for some subset of the total metrics in the system.
You can see as a request with some metric, to send some metric comes into the system, it gets routed to the compartment that owns it. And when a query for some metric comes into the system, we also route it to the compartment where that metric lives. And in this way, we're able to focus most of the requests on the metrics database to an individual compartment without having to fan out to the entire system. And so we're able to get the scalability of multiple clusters with the usage and experience of a single cluster.
But of course, we needed to prove that this actually worked at scale. And so what we did is we set up a massive load test. We created a Mimir cluster comprising tens of thousands of CPUs and tens of thousands of pods, and we loaded up with data and we found that on the right path, we could indeed scale to 10 billion active series. On the read path, we're still load testing. We've achieved 5 billion active series worth of query loads so far, but we plan to keep pushing until we hit 10 billion.
What's important about this isn't just that we can put a bunch of data in a database though. What's important is like I mentioned before, we're able to do this while still providing a good user experience. So this is a chart for one of our load tests that shows us going from zero to 10 billion active series over the course of a few hours, which is an incredible amount of scale to go through.
And while this is going on, our error rate remains nice and low, so the user experience is good. Latency also remains low while this is going on. And another thing that remains in check is efficiency. So this chart shows another load test where we scaled from 4 to 10 billion active series over a few hours and the yellow line, which represents unit costs, so this is the amount of resources that it takes to process an individual request, stays nice and low. And so our system remains efficient even while it's undergoing this massive increase in load.
So overall, Grafana Cloud Metrics is highly scalable today. We run clusters of 1 billion active series, but we're going to be pushing the ceiling even higher to support clusters of up to 10 billion active series. We're going to be doing this without compromising any of the things that are important to you, performance, reliability, and efficiency.
This work right now is going into the open source Mimir project, and we're looking forward to bringing it to Grafana Cloud Metrics soon.
Next, I'm going to hand it off to my colleague, Patrick.
Patrick Oyarzún: All right. So Jason and Jonathan just explained to you how we are investing in our databases to allow you to 10x your volume without compromising on query performance or availability. But I want to talk about the other side of that problem, which is the data itself. We keep talking about these telemetry explosions from AI and all these architectural changes going on in the industry, and the story is the same every time. Your bill goes up, but the value you get out of your telemetry doesn't. So what are we going to do about this?
At Grafana, we have this solution called adaptive telemetry. We started back in 2023 with Adaptive Metrics, and every year since we've added another signal to the portfolio. Ultimately, this year we made generally available adaptive profiles and we're seeing real savings for real customers. So we're up into the billions of active series saved, petabytes of logs, and then for traces and profiles, we're seeing upwards of 80, 90% savings for customers who enable it.
So these are real savings for real customers happening right now. Here's what one customer had to say. Rapid7 says, "When something breaks, engineers aren't wading through data nobody needs." But this is a little bit different. I've been talking about cost, but this is not necessarily about cost. This is about focus. It's about being able to find what you need when you need it. And so I want to talk about the person in this quote, the engineer, and I'll do that by focusing on Adaptive Traces.
So if you've run a platform team or if you've been involved in a large organization, you've probably heard this story before. Boss comes in and says, "We're spending way too much on observability. We need to do something about it." And a natural next step for any team is to start sampling traces. When you tell your engineers this, the first response is, "Well, wait a minute. What if I have an incident tomorrow and I need some of that data? What are we going to do? We can't just drop it." And so the typical advice goes something like, "Well, you develop a sampling strategy. So you keep all of your traces with errors, you keep all of your slow traces, maybe you've got some critical infrastructure that you make sure to keep everything for, and then everything else you just keep a representative sample."
And this works really well for the times when you know what's going to go wrong, when you really understand the error cases and how things will fail. It starts to fall apart when you don't know like those unknown unknowns. So for Adaptive Traces, we wanted to set a higher bar, not just a representative sample, but the actual data you need is still available. How do we do that?
I'm going to talk to you about three features that we've GA'd this year that layer on top of each other to accomplish this. Those are volumetric policies, diversity policies, and finally trace recovery, which is brand new, and I'll talk about that in a minute. So these layer on top of each other, like I said, to give you that confidence and give you the data you need.
Let's dig into volumetric policies. A volumetric policy, you can think of like a smarter version of your standard percentage-based sampling policy. So you might say, "I want to drop 95% of my data." And with a normal probabilistic policy, as they're called, what you get is basically the same shape of your data, these gray bars on the left, but smaller. And so that means your top consumers of your tracing budget are still your top consumers and your small services that are actually well-behaved, not sending too much data, might even get sampled completely out and you have no signal for them anymore.
So a volumetric policy improves upon this by adding this learning loop in the middle of the ingest pipeline. So we actually learn the shape of your data, dynamically determine which attributes are best to give a fair distribution of traces, and then we automatically adjust sampling rates across those attributes to give you a fair distribution.
There's a lot of interesting statistics and probabilistic data structures, things like that happening in this learning loop. And so if you're interested about that, please come find me. I'm at the adaptive telemetry booth downstairs.
So this works really well to give you like a fair baseline. This is a pie from just 15 seconds in one of our ops clusters, and you can see these two services in yellow and orange towards the top are given these little slivers of the total pie. After enabling a volumetric policy, their slices of the pie are comparatively larger. So they're not actually sending more data, but they're given a more fair allocation of the total budget. And all of this, despite the fact that we're still deleting 96% of the traces.
So this gives you that baseline, but there's still a gap. Anytime you have a learning loop like this, it takes time to understand the shape of your data and to adjust those sampling policies. So what about the one-off things? So you've had a service that's running totally great for three months and then you get a single 503. You want to keep that trace, but there's no time to learn that the shape of your data has changed and you need to increase the sampling rate. So this is where diversity policies come in.
You can think of a diversity policy as basically keeping all of the unique types of traces that you have. Again, this is no configuration, just like volumetric. All you do is click a button to enable it. And what we do is we calculate what we call a fingerprint for each trace, and this uses all of the important attributes about the kind of shape of your trace. So you can think of the service, the endpoint, the method, the status code, these things, and they all get boiled down to a single unique identifier for that trace. And then we just check, have we seen a trace like this in the last 15 minutes?
And if the answer is no, we keep the trace. So this guarantees that you're going to have that random 503 whenever it comes in, we'll see that as a unique fingerprint and we'll sample it. But this still leaves a gap. If you're dropping 95% of your data, I'm sure you're thinking, "Yeah, but I get a support ticket, I see a log, I have a trace ID, and you've dropped 95%." That means 95% of those links are dead now. So for this, I want to go to my demo and I'll show you what we can do here.
Cool. So this is Adaptive Traces. You can imagine now I'm a part of a platform team. I'm worried about reducing costs. I've got this mandate for my boss. And so through looking at my tracing estate, I've decided that this cart service is generating too much noise. And so I create a policy, this is a drop policy and it drops any trace that has a span where the service name equals cart service. This is like an extreme example, right? You're saying, "I want to drop 100%." And indeed we can see if we drop into traces drill down, there are no traces, right? If we try to search for these, they're simply not there. So I'm happy, my boss is happy, we're saving lots of money.
Fast-forward a few months and I'm now an engineer working on the cart service. I'm getting paged because my SLO is firing. I'm below my 99% target and I'm trying to figure out what's going on. So I do what I normally do, which is jump to the cart service dashboard. And I'm looking here and I can see that my runtime exception rate in my .NET app is a little higher than I expect. And as a matter of fact, this is alerting. So I scroll down and I can see some logs and I notice that there's something about Redis going on and great, there's a trace ID, so I can figure it out.
Now traditionally, because of that other policy you saw on a tail sampling pipeline, clicking on this link will bring you to a big page that says not found. And then you need to go talk to your platform team, adjust sampling policies, hope the error happens again, this sort of thing. With Adaptive Traces, because of the architecture of Adaptive Traces, we've been able to build an experience that allows you to restore any trace, even if it's dropped for 24 hours after we receive it.
And so in this case, rather than getting that not found error, I'm able to directly jump to the span and see my stack trace and get fixing the problem.
And so this is trace recovery. This is very near and dear to my heart. It started as a hackathon project that I worked on a while ago and is now generally available, no additional cost to anybody using Adaptive Traces. And this includes all tiers. Thank you.
Great. And with that, we can swap back to the slides and I will pass it off to Steven to talk about the rest of adaptive telemetry.
Steven Dungan: All right, I'm back. A couple hard acts to follow and we're getting towards the end, but I still have a couple more awesome things to show. There's a lot packed into this talk. We're back hearing from our friends at Rapid7. You should really stick around after this talk and hear Carl give his talk. It's a great talk. I got a little sneak preview of it. But now we're going to switch to talking about Adaptive Metrics and the fact that customers love that Adaptive Metrics makes the recommendations for you and removes a lot of the manual analysis and back and forth with teams, the guesswork, the missed opportunities.
But there's a problem. We give you recommendations, lots of recommendations, sometimes 700 pages of recommendations. Okay, that was an exaggeration, but still lots of things to point and click through if your experience is just reviewing each recommendation we give you and deciding if it's okay or not. So we started hearing this, that screenshot there is from an internal Slack where we heard from a lot of folks in the field like, "Hey, did you know this was the problem?" So we talked to the customers. We asked them, "What are you doing when you're doing this review process? There's this blue apply all button. Why do you not just hit it?" And they're like, "Oh, we're reviewing things like where are the metrics being used? What's an appropriate aggregation function to use to aggregate this metric? Has usage changed at all? Is it used in a given dashboard? Where are my highest impact recommendations?"
And we're thinking Adaptive Metrics already does all this under the hood. So it sounded really, really familiar to us. We have worked to provide additional data points in the UX if you're coming in for the first time for more visibility into what it's doing, but still once trust is earned, there's a lot of rework involved here. So surely, there must be a more effective, less toilsome way to do it.
Sure enough, so what we are announcing today is that Adaptive Metrics auto-apply is now generally available. So how this works is basically recommendations are generated roughly every 12 hours. With auto-apply, it does exactly what it says. You basically have all the perks of analysis, review, recommendations and actual aggregation, but now without the toil. Now it's just like a human. It's pressing the blue button for you. We've been dogfooding this ourselves for over a year. It's been in public preview for a while also where we can work out all the challenges with customers, all the fears they had about what's scary about this. It's time to get to that generally available world as of this week.
One of the concerns we heard from customers occasionally was, "What if a metric is aggregated? I'm used to this nice new normal baseline of active series and then someone queries the pod label. What's going to happen there? Won't it spike cardinality?" Yeah, it would have. It potentially could have, but that's why we introduced this feature we're calling cost mode. Essentially what we heard from customers, just because someone queries it, maybe there should be a little more nuance to it. Maybe it shouldn't just increase active series without any sort of context for our budget. Is this the trade-off we want to make?
So we've introduced this cost mode functionality and basically what it will do is if you turn this functionality on when you use auto-apply, it'll line up all your recommendations. And if the recommendation would reduce your active series, it applies it. Easy-peasy.
If the recommendation would increase your active series, like your query behavior has changed, but it wouldn't increase that baseline of series you were used to. We apply it. Easy-peasy, right? No harm to your budget. But now with this mode, if this situation of someone clicking the pod label or querying the pod label, this would lead to a large series increase. Auto-apply is smart enough to say, "No, we won't apply that one. You'll have to come in and tell us you want to do that."
You can still run Adaptive Metrics the old-fashioned way and strictly apply it based on queries, but we think this is a nice budgetary target aspect to Adaptive Metrics that we've been hearing about that customers really benefit from.
All right. So Adaptive Metrics is in auto-apply. The last theme I want to talk to you about today is improved logs economics. So we're going to talk about doing this in two different ways to set the stage for what we are trying to solve with this. We heard two things with Adaptive Logs quite frequently. One, we're basically seeing customers with the need for greater flexibility. So when logs come in, logs have many different use cases. It could be observability, audit and compliance, analytics. Each use case has its own different requirements for how accessible logs need to be.
Logs also have different users, not just developers, but analysts, support engineers, even product managers use logs sometimes and probably agents. And finally, of course, the ultimate constraint is logs are verbose and expensive. We want to keep all the logs, but telemetry explosion and all that, we just can't do that. It was hard to do it before. It's going to be really hard to do it going forward. Adaptive Telemetry is here to help with that. So this was problem number one. And the other thing we heard was basically the maturity of the OTel ecosystem has made customers a lot more comfortable with doing transformation, pruning, et cetera, at the edge, performing these simpler ETL operations in their own infrastructure before they have to pay the egress.
Basically, if the cost of egress outweighs the cost of compute and complexity, let's just do it in our own infrastructure before we have to pay our cloud provider overlords.
So let's talk about the flexibility aspect first. Until today, in Adaptive Logs, logs were either kept or dropped. It's great at identifying the logs you need for day-to-day operations and common investigation patterns and then discarding the rest. We see this lead to serious cost savings for our customers, but it's not a complete approach because the need for logs for things like auto and compliance. For incidents, maybe I need full fidelity logs as well.
We needed to find a balance for this where customers could say, "I don't want to pay everything for these logs, but I can't just discard them totally on the floor." There's also, as a platform owner, I'm sure you feel the psychological aspect of going, as Patrick talked about, going to your developers and saying, "We really need to reduce the spend here." And developers saying, "But I need this stuff." A lot of friction.
So what do we do about that? We are announcing in public preview that we are adding an archive capability to Adaptive Logs. So for logs you may need for future incidents, audit and compliance, those logs, you now have the option to route them to your own object storage instead of just ingesting them into Grafana Cloud or throwing them on the floor. And again, the ultimate principle value here is economics. You get to right size what you need to do with your logs. We basically find the right tier for you and your use cases. You're paying much less for this optionality.
We write this data in open format also, so you have flexibility with what to do with the data once it's in your bucket. And it's a leap forward for us into this routing tiering world of aligning cost to value. Again, it's an economics problem, but as Patrick said, the end goal here is coming back to value and making sure you're getting value out of the telemetry and aligning that to your costs.
All right, so now I'm going to demo what this looks like if you need to access the data.
All right. So imagine a situation where you work at a bank. I used to be in the situation myself. And imagine you're in the complaints department. As you can imagine, people are pretty rightfully so sensitive about what happens with their money. And let's suppose in this case, it's a weekend morning and a customer will call her. Daniela calls in and says, "Hey, I tried to come in and transfer money and it looks like it just didn't work in the app. What's going on? I don't want to redo this payment and get double charged. My friend wants the money. What happened here?"
So what we've concocted here, I've behind the scenes with some LLM friends written a script that leverages DuckDB to access the data in place. What I want to know is if I'm in the complaints department here is did Daniela's transaction on Saturday go through? Or what happened if it didn't? So I could write this really gnarly SQL. I could also look to an agent to do this for me or a team to make this an even better experience for me. But the idea is the data is just in place for me to be able to ask this question and quickly get an answer.
And so what I see here is basically, okay, I see this user signed in. I see this user was able to access her account just fine, was able to click through the app. But then when she tried to run the transfer, it was rejected. So it was not like the process got hung up halfway. Her money is not lost into the ether. The transfer was just rejected. So probably something to go to the engineering team with and say, "Here's what happened. I've got a trace ID for you. If you want to look even further, maybe we have a bug or UX improvement to make."
Cool. So back to the presentation now.
This was a very contrived, simple example, but suppose I wanted to do something further. Suppose I wanted something more high fidelity. Suppose I wanted to do a more nuanced investigation. What other users were affected? If this issue wasn't just a one-off bug, but there was actually some sort of systemic issue, maybe it would be nice to have the full fidelity context of all my data and the experience of Grafana Cloud to help me navigate around.
So we are also working on the ability to replay data into Grafana Cloud, and we are coming very, very soon with a private preview. If you're interested here, while I talk, you're happy to scan the QR code and get added to the interest form and we'll get in touch with you. But the idea here is basically we'll give you the optionality to say, "I want this full fidelity experience. I don't want to manage the query experience." You can replay them into Grafana Cloud to access them and get the full abilities that they were ingested in the first place.
All right. One last thing to talk about before we start winding down here. I mentioned there was a lot. That whole economics problem of if we're just dropping logs, that seems like fairly straightforward to do in our infrastructure. "What if I could just drop the logs sooner?" So Adaptive Logs gives you the ability to generate these rules for dropping logs. It gives you the ability to create what we call exemptions and basically say these logs should always be preserved.
Now, we have developed the ability to turn these into fleet managed pipelines that can be run on your hotel or alloy collectors in your own infrastructure. So you get the benefits of Adaptive Logs, but you get them sooner before you have to pay the cloud provider. You simply indicate with the label for specific collectors which collectors you want these pipelines to apply to and voila.
Here's a very mature diagram of what it could look like. It looks a little bit better when you actually use it, but we are in public preview for this. It's in everyone's stack, so go ahead and give it a try. It's nice because basically the rules that you can't manage upstream still fall back to being applied in Grafana Cloud. So you can get best of both worlds of things that will work upstream or you want to apply upstream, you can. You still get the benefits of Adaptive Logs in the cloud for things that make sense there and for getting these very, very up-to-date recommendations.
And as mentioned, this works with both Alloy and the OpenTelemetry Collector. Thank you to our fleet management folks for getting [inaudible] protocol in good shape. So yeah, if you remember, we started this presentation 50 some slides ago, a while ago with the whole this is the world we're living in. Hopefully we've convinced you that we have good answers to this, but what are those answers in all these features we now translate to?
These are the outcomes we think you will get as we move forward with Grafana Cloud. We think as you scale and see more telemetry volume, the signal will stay clear. We think your costs, while they won't disappear entirely, will certainly align to value. You're only paying for what you need and what you actually are getting value from. You're paying for the business of faster RCA, keeping your systems up or keeping them healthy before something even goes wrong.
And then finally, you're paying to keep your developers happy with fast performance, snappy queries. Thank you, all.


