Opening keynote
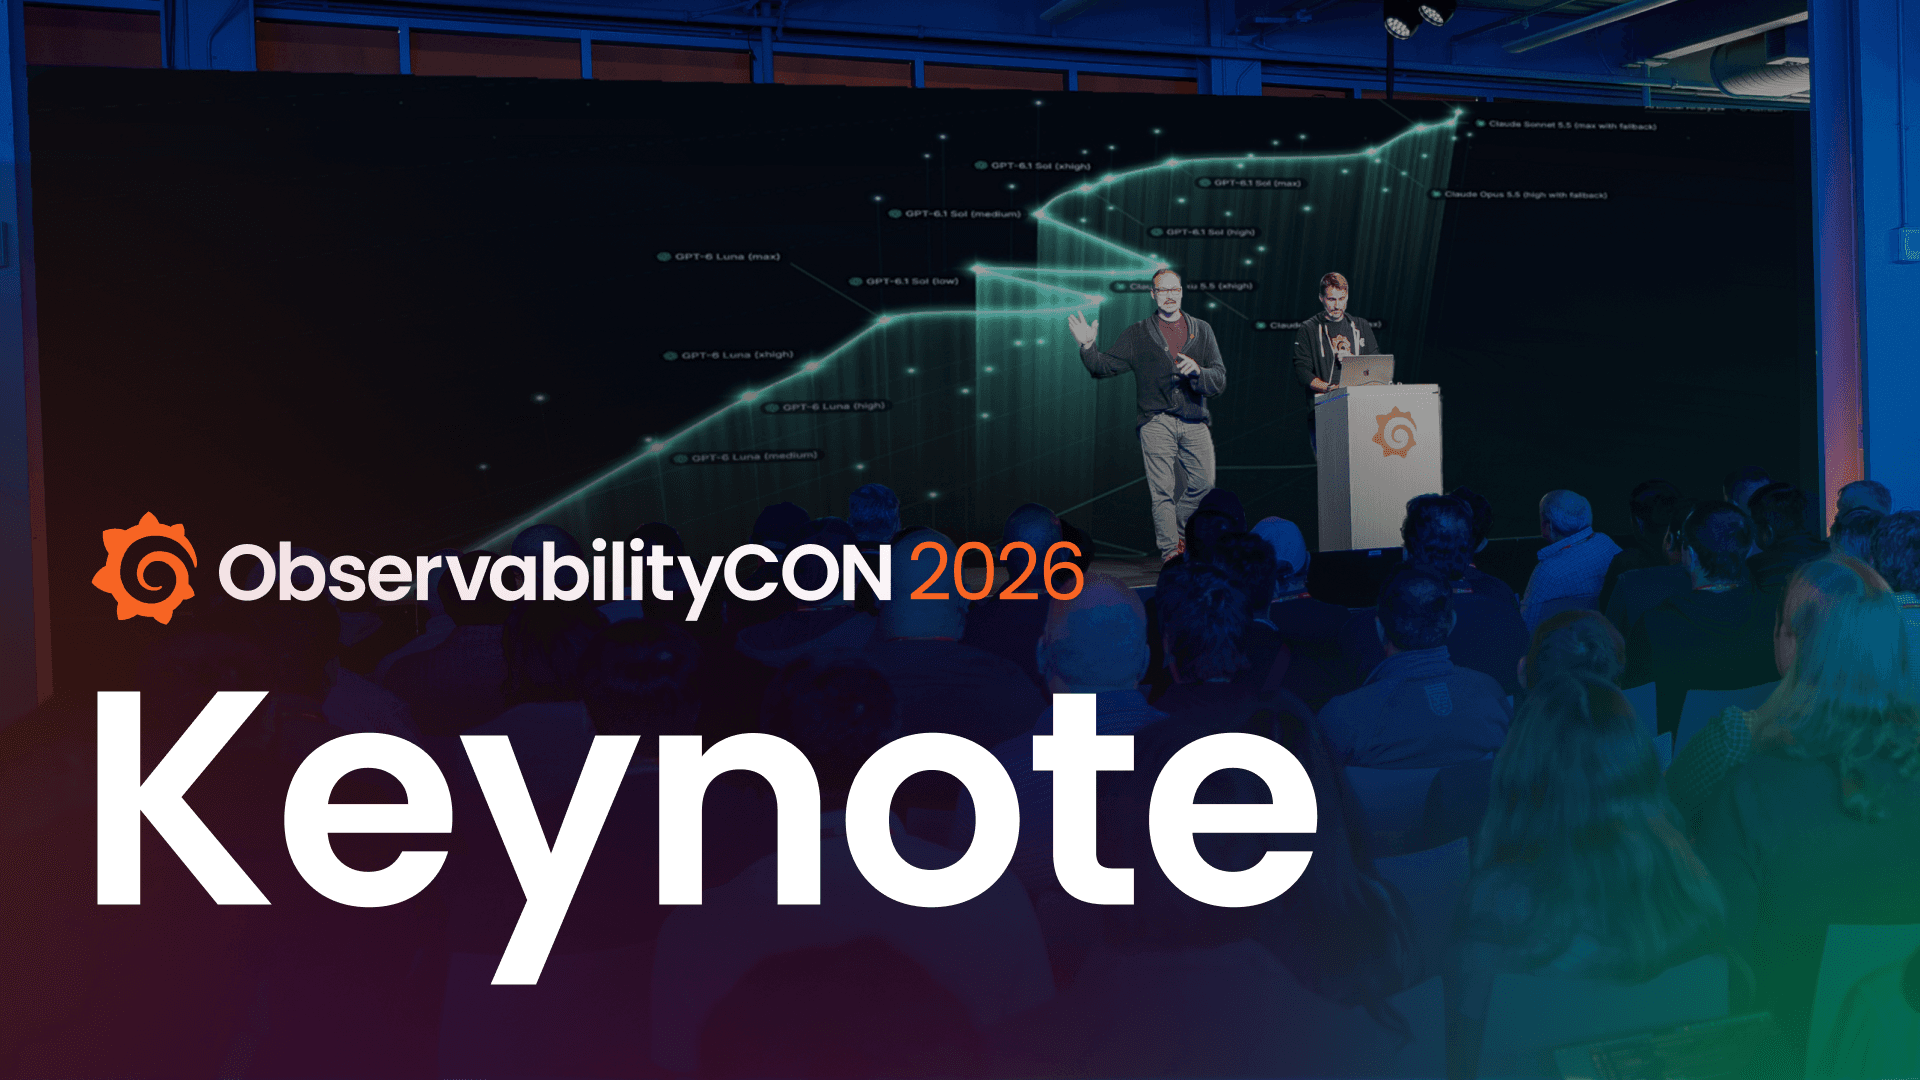

Join Grafana Labs CEO/Co-founder Raj Dutt, CTO Tom Wilkie, members of the engineering team, and Omar Lopez, Head of Observability for SailPoint, for the kickoff of ObservabilityCON 2026, where they share the latest in AI for observability, observability for AI, and solutions for all.
Speakers

Raj Dutt
CEO, Co-Founder, Grafana Labs

Tom Wilkie
Chief Technology Officer, Grafana Labs
Jen Villa
Senior Director of Product, Grafana Labs
Richard Lam
Director of Product, Grafana Labs

Manoj Acharya
VP, Engineering, Grafana Labs

Mat Ryer
Senior Director, Engineering AI, Grafana Labs

Omar Lopez
Head of Observability, SailPoint

Cyril Tovena
Principal Software Engineer, Grafana Labs
Richard Lam: Please welcome the co-founder and CEO of Grafana Labs, Raj Dutt.
Raj Dutt: Hello everyone. Are we excited to be here? I certainly am. Yeah? All right. Well, welcome to ObservabilityCON, our flagship annual conference. And it's great to be here in San Francisco. We're a post-geographical company. We're 1700 people in over 40 countries around the world, and we actually don't have in the last several years a lot going on in San Francisco. We kind of want to do more. So it's really good to actually have an obscon here at SF. So warm welcome to everyone. Warm welcome to everyone here, everyone looking at the live stream. I know there's speakers in the bathroom, so if you're in the bathroom, hurry up, the show's getting started. So quick note, thanks to our sponsors. Without our sponsors, we wouldn't be able to put an event like this on. So big thanks to all our valuable sponsors, especially our pioneer sponsor, AWS.
Cheers. Round of applause to our sponsors, please.
All right, so we are remote first as a company, so we don't have a single office anywhere in the world. It's kind of an interesting environment to operate, but we love it and it's a big part of our culture. But it is so important that we get together and we really want to bring our people from all over the world and put them in front of you, right? We think human connection, building trust, talking about our products, our technology in person, making those face-to-face connections is super important. And it's been a big way, quite frankly, of how we've built our community over the years. So we really have two flagship events, ObservabilityCON, that's the one you're at today. It's all about our products. It's all about bringing our customers together to learn from each other, really focused on our flagship product, Grafana Cloud. GrafanaCon, on the other hand, is all about the open source community and it's packed full of open source demos, new releases, technical talks, and there's a lot of crossover at both conferences, but we try to keep things a little bit different, a little bit of a different theme at both of them.
And our entire company has been really busy over the last year getting in front of so many people. In fact, we had over 35 people sign up for webinars and events over the last year, and obviously culminating at this conference at such an amazing venue. So we have an incredible events team, by the way, too, just going off script. They've done a, needless to say, fantastic job putting this together. So another quick round of applause for them.
And yeah, it's been quite a year for Grafana Labs since the last ObservabilityCON. I mean, the pace of change both internally within the company and externally around the world has just been staggering, breathtaking even. I'm sure I'm not alone and many of you feel that way in your own roles and looking at what's going on. Grafana Labs as a company, things continue to go relatively well in no small part, thanks to many of you. We've hit over 10,000 paying customers, over $600 million in annualized revenue, and we're trusted now by some of the largest, most demanding, most sophisticated companies in the world, companies like Microsoft and Anthropic and NVIDIA and Amazon. They're all standardizing on our technology and our platform, which is really cool to see. And this kind of started to happen for us, if I'm really quite honest, only in the last two or three years.
We've kind of graduated and grown up in some ways as a company and we're now competing in the mainstream. We're going head to head with a lot of other observability vendors that we've always looked up to and admired. And this year, I'm really pleased to say that we were named for the third year in the row as a leader in the Gartner Magic Quadrant, and we're positioned furthest to the right for completeness of vision. And so this is a huge credit not only to the Grafana team at large, both the product team and the R&D teams and the go-to-market teams, but also our entire community, because as we're going to talk about, Open is such a big part of who we are, and the way we've built this is we've really built it together. So out of just curiosity from everyone here, who is a customer of Grafana Labs in the audience?
I guess I shouldn't realize in my hand I'm kind of a customer. But no, I just wanted to say sincerely from all of us, thank you so much because you have really shared in this journey and allowed us to get to this point and get this kind of recognition. But we're not resting on our laurels by any means at this moment, right? While we've achieved a pretty, certainly from judging it from when we first started in 2014, while we've achieved a pretty incredible scale and have received a lot of kudos and awards, we are pretty paranoid. We're just getting started at Grafana Labs, right? We are at a very, very interesting time and we think that we're in the early days of an architectural shift that is going to be much, much more transformative than the previous architectural shifts that have come before it. So depending on your age, many of you have been through similar shifts before.
I was a bit too old for mainframes, but I remember monoliths, I remember cloud 1.0, all these changes caused more data, more variability. And I think in many ways these changes and these architectural shifts over the last few decades, they were kind of incremental or evolutionary. They certainly caused many vendors to thrive. They caused big shifts in the way that we consume observability, but I really believe that this architectural shift that we're in early days of right now with AI and agentic, this is going to be a profound shift in the way that we use and consume observability. And it's really going to be an interesting time. And I think we've got a really great keynote to kind of walk through some of our thoughts and current thinking as a company. So this is the top level kind of framing of today's keynote, and you've got a bunch of really amazing people coming on to present on these topics.
And one of the things about Grafana Labs is we build software made for practitioners by practitioners, right? We're big believers in dog fooding. We run our platform ourselves. So at this keynote, you're going to hear from many of the people who are actually building and creating these products and services. So starting from the right agentic operations, not just making your software better, but making your software better more autonomously and ideally automatically with human in the loop, you're going to be hearing from some of our really talented engineers and engineering leaders like Mat and Cyril on the future of observability, both AI for observability and observability for AI. We're also going to be hearing about how context is king. You're going to be hearing from Manoj, who leads our observability engineering team and Richard on our product team. Context is king. We're all collecting all this telemetry, but how do we turn that into actionable insights?
Cloud economics re-imagined. I'm sure many of you are feeling this pain, data's exploding, particularly in this era with AI. And how do you handle the exploding bills, particularly when value isn't there? This continues to be a big theme about what we're building and we're really excited to share more on this in just a minute. And finally, open is our secret weapon, right? This isn't something that we necessarily intended, if I'm honest, when we started the company 12 years ago, but open is such a core part of who Grafana Labs is and it's really become a big part of our AI strategy. So obviously it all started with Grafana over 12 years ago now, hard to believe. Grafana was from day one, open source, big tent, right? We really prioritize interoperability and over the last decade plus Grafana has become the world's most popular visualization software.
It's kind of cool. And this has led to a massive community of users all over the world building dashboards, setting up their observability, playing around with Prometheus, playing around with Loki, doing it in the open, and they're putting all this knowledge and experimenting and because they're doing it out in the open, there's become a huge amount of content on the open web on how all these technologies work, how our whole stack works, details on PROMQL, details on how to configure authentication for Grafana. There's a wealth of information out there. And as a result of that, all the foundational models are so well trained on our technology stack, much more so than proprietary vendors. And this has been really, really cool to see. When we launched Grafana Assistant GA earlier this year, we were in shock at how quickly it became useful to people. Now, part of that is obviously due to our amazing engineering team, people like Mat and Cyril who you'll hear from shortly, but part of our ability to kind of leapfrog where the competition was, was because of this massive content and this amazing community that we're lucky enough to be at the center of.
And this is what the frontier models prefer, it's what they recommend, it's what they're familiar with, and it's what they're trained on. So open knowledge is becoming like a not so secret superpower of how we're continuing to build Grafana Cloud and our observability strategy. And of course, still committed to open source, open ecosystem, open interfaces. So we've got a great keynote for you. Next up, Tom Wilkie, our CTO, and Jen Villa, our senior director of product. We'll get into cloud economics re-imagine. Please welcome them on stage. Thank you very much.
Tom Wilkie: Hello everyone. Good to be here in San Francisco. It's been a little while. I used to live here about 15 years ago, but yeah, now I live in London. Right then, we are going to talk a little bit about how we are re-imagining cloud economics. I think you're all pretty familiar with this story about how the revolution in AI is really driving massive growth in telemetry volumes. And it's a bit of a double whammy here. The scale of investment in AI infrastructure is really unprecedented and all of this info needs observability, but also AI is making it so easy to build new applications that that pace has increased to an extent that there's, again, this huge influx of new telemetry. We used to talk about how the shift to microservices and cloud native was driving this growth, but that looks kind of pretty minor in comparison now.
We also know that more data doesn't necessarily mean more value to our customers. The bills go up, a lot of observability vendors charge based on consumption, but that value you get from that data kind of plateaus eventually, especially when you get to these ridiculously large scale. We don't want to just solve this problem with aggressive discounts and tweaks to our pricing and packaging. We at Grafana Labs, we're always looking for technical innovations to solve these kind of challenges. We're a tech company after all. So the first such kind of thing we've done recently that I want to talk about is bring your own cloud. This is where we will run a full region of Grafana Cloud in our customers' AWS or Google or Azure accounts. This allows our customers to pick up the info bill and allows Grafana Labs to pick up kind of the operational toil of all of this.
It really is a shift away from the traditional kind of cloud consumption pricing model and makes it feasible to run at really, really large scales cost effectively. But we didn't just stop there. At Grafana Cloud, we continually test like twenty four seven every single release of our software multiple times a day. This is so that we can avoid kind of shipping bugs into production obviously, but running these clusters at this newfound scale is getting pretty expensive. So this year we've invested in our own pretty massive bare metal cluster. We're putting it in Ireland. It's pretty early days. The machines are still being racked up and we're still learning how to operate it, but this will allow us to test and qualify releases at massive, massive scale, much more cost effectively. And we hope one day this develops into our ability to run production workloads on bare metal and maybe even for our very largest customers in their own data centers.
Something we're really excited about and goes back to some of the roots that the founders have in their previous startups. The next thing is a lot of this work we've talked about at scale has allowed us to achieve kind of a massive milestone, which is running MIMIR, our metrics database at 10 billion active series. Now this is 10 times bigger than where we were a year ago. And there's been a ton of novel techniques going into how we've achieved this scale. There's a talk tomorrow morning, I believe, that the team will go into some of those techniques. I don't really have time to do it here. Another big achievement in our databases team is the improvement in query performance in Loki. In April this year, we bought a company, a chap called Jason Knockland that had this really novel needle in a haystack indexing technology.
And we've spent the last few months integrating it into Loki. We've been in private preview with about 20 customers for the past since June, I think. And today we're announcing the general availability. This is rolling out to all our customers in every Grafana cloud region over the next few weeks. The results have been amazing. These are the average case results, five times faster queries, a 75% reduction in the amount of data scanned. But for other queries, for certain queries, it's orders of magnitude faster, right? We've still got a ton of improvements with shipping. We're improving the index performance. We've got broader coverage for more supported queries, and this will be coming shortly to a low-key open source release as well. So with that, I'll hand over to Jen.
Jen Villa: Great. And while Tom has talked a lot about cost efficiency at scale, we also want to emphasize we believe observability should be cost efficient at any scale, and that's why we've invested in adaptive telemetry. You've probably heard us talk about this a lot, but as a reminder, how it works is by identifying what is valuable in what you send us. We look at multiple inputs. First, what your users are doing, so what's being queried, what's being dashboarded, but also signals from your systems. So what services are erroring, have high latency or maybe just recently deployed. And then once we have that perspective on what's valuable, we give you a way to act on it, aggregating it, sampling, dropping it. We have thousands of customers using and saving money with adaptive telemetry today. And I'm excited to say that the pace of innovation here has only accelerated.
And I'm going to talk to you about two improvements that we're making that I'm particularly excited about. Now, historically, we have aggregated and sampled that telemetry on the Grafana Cloud side, and this has been great, especially for customers that don't really have a good way to manage their collectors, but there's a downside of that. You've been sending a bunch of telemetry over the network, paying that egress only for us to drop it on our side. And so today we're excited to say that we have a solution for that problem by bringing together Adaptive with another feature that we love, our fleet management, which is our way to operate telemetry collectors at scale. So now what you're going to be able to do is take the policies and the recommendations from Adaptive and push them out to your collectors, be it an alloy or an hotel collector, so you don't have to waste money saving or sending low value data over the wire.
We're starting with logs and then excited to bring it to other signals in the future. Now, second, we've really only given you two options for that low value telemetry previously. You can keep it in Grafana Cloud or you can throw it out. And we get that there are some classes of telemetry for which neither of those really work, right? Sometimes you have stuff maybe you need to hold onto for audit or compliance or just to have it around, but you don't really need immediate access to it. Today, we're giving you a third option that should address that need. You will now have going forward the ability to send that telemetry either you or Adaptive identifies to an object storage bucket you own. So you can hold onto it at a fraction of the cost as long as you want. And because we're sending it in an open telemetry format, you can query it in place using an analytics tool of your choice, Amazon Athena.
And then if you decide sometime down the line, actually, I would like to see this information back alongside all the rest of my observability context, you can do that, replaying it back into Grafana Cloud. Again, starting with logs and coming to other signals in the future. So summing it up, Tom and I just talked about a few of the things we're doing to reimagine cloud economics for the AI era. If you'd like to hear more, as Tom mentioned, check out the Wednesday morning 10:00 AM talk. And with that, I'm going to hand it off to Richard and Manoj.
Manoj Archarya: Hey there. Welcome to San Francisco, my hometown. Excited to see you all here. So I mean, we are talking about Grafana in the AI age. We had to pick a city, which is the AI capital of the world, so no surprises there. So let's jump in. So Tom and Jen just walked you through how we are going to manage our cost while the data telemetry is going to explode on us. And for the next 10 minutes, Richard and I will walk you through how to get better answers from our bots, dots, whatever you are using there, better, faster, cheaper. Let's dive in.
So we all know the models are intelligent and some even calling them super intelligent, but they know all the software. We know that they can code well, they know the software stack really well, but I don't think they know much about our architecture, our business and how it runs and how it is changing all the time. So when you ask a question, so instead of kind of piece it together, I mean, I don't know, less and less winging it, more piecing it together, but then they're filling up, burning all the time and tokens and filling up the context window. So this is where exactly what we have been building. So we want to build the context layer that's kind of pre-built. It's ready to go so that the agents can literally talk to it when you ask a question and it stays up to date.
It's real time, it's always on and it's there for the agents to reason through. So how we're going about it? So last year ObsCON, if you guys were watching us, we launched this thing, what we call as knowledge graph. And now we have made it the context layer on the cloud for both human and agents, how we are all bonding together. So we'll scan your telemetry and your data sources that you have already set up and quickly discover your cloud infrastructure, your run times, your databases, your applications, and how these things are all connected. It's automatic, it's continuous, it's always there. And you can access it from the Grafana interface or from your Claude Code or Codex or whatever other editors they're using there, CLIs you're using there with our GCX Grafana Cloud CLI or your MCP server. Now we have been dogfooding this ourselves.
We are a big believer in dogfooding in Grafana Labs and also rolling out to some of our customers who have this complex service dependencies. Actually, Neil has a talk coming up today afternoon, so do check that out. So the early results from our own internal testing, it's quite promising. I mean, you can see the number up there, but when you are asking really high bar questions, which has multi hop incidents, so it's already proving us that we are using far fewer tokens and we are going to take it to next level. So that just gives us the impetus that we are going to just double down our investment in what additional things we bring to knowledge graph, the context layer. So we are starting, this is already generally available and we have a talk coming up where you can talk to assistant and model your business entities into the graph itself.
So don't just build one on your own, build the same graph where your telemetry data is already in. And we have one coming up from Michael and Mimi about how we are going the whole entire incidents and on call and all your teams into the graph itself.
Now, the whole end goal is to get answers to this new kind of questions very, very quickly, faster, better. But the one of my favorite one is actually how one of the largest fast food chain in the world is actually modeled their point of sale systems into the graph. And now they can relate your business data with your infrastructure data. The PO systems are literally Kubernetes clusters running there. So if you can relate, okay, how is the store performing? Is it because of my board scratch looping? Who knows, right? Anyway, we can get answers to the kind of questions, right? So anyway, so that's kind of a quick highlight of how the context layer is looking like. So Richard and me have been on this journey for several years now, trying to make our context and stack fuller and stackier, all these things. But Richard, are we there yet?
Richard Lam: You know what, Manoj, I think there's more we can do. Like Manoj said, we started working on this about three years ago. We've been on this journey where we've been moving from the separate asserts product to evolving this to an integrated platform and making it available everywhere as easy as possible, this knowledge graph. And we've added a ton of context and entity types over the years. There's more ways than ever that you can use it either through the UI, through Grafana Assistant or any external agent that you bring to the table. And as far as full stack observability goes with Grafana Cloud, it's great for monitoring infrastructure, applications and microservices, but we want to make it even more powerful than that. And this is especially important as you all know in this room, with the explosion of all the AI led development and innovation, new products and features are being shipped faster than ever, but they're also creating new problems, harder problems to solve for.
And yet it's really, really important to remember, it doesn't really matter how quickly any of us in this room are innovating right now, even right here at Grafana Labs, because if at the end of the day a customer experience is a broken app, you're trying to order that cheeseburger at 11:00 PM or you're trying to transfer money to your friend on Venmo or whatnot, a broken experience is a broken experience. It doesn't matter that we're shipping features 10 times faster if none of that works. A broken experience is a broken experience, productivity gains go out the window and your user's stuck, that's a bad time for everyone. So I'm really excited to announce that we're expanding our front end observability products and synthetic monitoring capabilities and adding way more context where it usually matters the most, and that's the user experience. First, on the browser monitoring side, we already give you web vitals, errors and user actions today.
That's all part of our core RUM products, but now we're going to give you tools for actually observing the end user experience itself. You're going to get session replays and critical user journeys. With replays, we're going to allow you to query by users or custom attributes and time against every single interaction that happens in the UI. You'll be able to link these to synthetic monitoring checks and errors and even traces. And of course, it's all masked by default when you're capturing it. So there's added security and privacy with more granular controls to even tune how much of that you want to mask, if at all. And then with critical user journeys, you're going to be able to define very specific user workflows through highly visual funnels, very cool, lots of graphs there. And then you'll get an alert potentially when a flow fails, and then you can just jump straight to the replay or error, very intuitive.
And I'm really excited by these new capabilities because I think they really broaden what Grafana Cloud can do. These are new shapes of data, new signal types that we didn't have before, unlocking new use cases against new personas. So you'll learn a lot more about that tomorrow. That's interesting to you during our digital experience monitoring session with Priscilla and Ukash. Great session. So stay tuned for that. But I do want to zoom in on one more thing, right? That's mobile observability. Now, this is one of our most requested, if not the most requested products the last couple of years. So it's actually very exciting that I can stand on stage today to actually give you an update on it because it's been quite a long time. This is a consolidated Grafana cloud experience. It's not a separate tool. It's built on top of our front end observability product.
You're going to get a single web and mobile experience wind up together. It's a very familiar experience. You're going to get support for all four major mobile platforms, iOS, Android, React, and Flutter. And I think best of all, it's open telemetry from the start. We're building native support for both iOS and Android in upstream hotel SDKs. That means no proprietary agent. There's no vendor lock-in. This is the Grafana way. We build an open source even when it comes to Grafana Cloud. And best of all, it's open for private previews today. You're going to see QR codes plaster everywhere. Join the wait list if you're interested. We'll be in contact. We've got a demo booth out there where you can see it in depth, but even before that, I want to hand it back to Manoj so you can get a glimpse right here on what that actually looks like.
Manoj Archarya: Awesome. Let's do it. Let's do some demo. I mean, it's no fun with the demos, right? Okay. So here is my trustee banking app. It's an Android app. It's now fully instrumented with OpenTelemetry SDK. And here I'm trying to open an account and I have to enter my date of birth. And it so happens that I was actually born on a leap year. And so let's type it in. Oh wow. I'm so young. Oh shit. Oh no, my application just crashed, right? Okay. So this is 2026, you don't want to write alerts. Here's the homepage of mobile observability and you can see that it was healthy and now it's now red, right? Something just escalated. So you're kind of constantly monitoring all your signals that is flowing into Grafana Cloud and finding in real time, hey, it looks like there's a new kind of crash in the system and it's showing you bubbling it up to the very top and giving a preview of the stack trace that caused it.
And then you can quickly jump into open errors and here you can see how many times this crash has already happened, look at all the different attributes captured from the SDK itself. So here as I scroll down, I can actually jump into the exact sessions. Now this is not a replay yet, that's coming soon, but this is the actual, the boring textual version. So here you can see that I can now start looking at all the different kind of events you're capturing, your lifecycle events, your network events, your network requests right here, your view changes, and then even your app janks. Okay, that's pretty cool. My app is freezing, but then looks like it crashed. So that's kind of there at the very end. So jump in, look at the full stack trace. So okay, so I got the stack trace. What do I do now?
I need to fix it, right?
Let me go back and look at my homepage. Maybe Assistant already has some recommendations because I did hook up my source code with Assistant. Okay. So yeah, but if you don't trust it, that's no problem. You can absolutely take it to Kurtzer or your trustee coding agent and then just copy the data into the coding prompt. But if you do trust us, you can absolutely quickly take a look at the report. I mean, that we have a full report on what is the root cause, what caused it, and down to even the line of code we think we should be fixing it. So yeah, it's all kind of fed into the entire context window we're talking about here. So we have the full context and we have reason through it. And you can apply this fix and get going. So that's kind of pretty fast and quick in the completing the loop as we call it in AI age.
So my app is now up and running, so I'm ready to go. So all it takes to do this is like Richard was saying, OpenTelemetry instrumentation. It's fully built in open source in OpenTelemetry. I mean, you guys know that we actually number two in OpenTel hotel contributions now. I mean, it's pretty cool, right?
So you can see that it's just one line change there. Otel initialize and it's not proprietary. It's right there. And you're ready to go. So yeah, what I just showed you is just tip of the iceberg. We have a lot more stuff that we have been building. We have a full conference load of talks. So you can binge watch us right here in this room or grab some coffee from the Amazon coffee booth and meet us downstairs, meet the expert booth. Now I'm going to hand over to my buddy, Mat, for the next episode in our AI journey. Thank you.
Mat Ryer: Hello everybody. Hi, everyone in the room. Hello people on the live feed. Hello people in the future on YouTube. And of course, hello to the people still in the bathroom. Are they all right? Should we check? Yeah, no, that'd be fine. Yeah. We are here for this agentic revolution. It's made us way more productive, but also the quality is higher as well. But of course, the risk is with more changes, there's more to go wrong. And this is where our observability solutions have to level up so that we can meet these new challenges. And this is what we're building at Grafana Labs. We started with the Assistant. We're thrilled with the success of Assistant. Does anyone use the Assistant?
Yes, they do. Great. Well, yeah, we love all the fan mail we get. Assistants, we feed it all into Assistant when it comes in. So please keep that coming in. But this is a chat integration woven throughout Grafana. It knows how to make telemetry queries, very complicated ones. It can deal in natural language, of course. It uses beautiful visualizations to show you the data so you don't get a wall of text. And of course it's got all the tools it needs to actually do things like create dashboards, do investigations, help you set up alerts, everything. And it's available in all places. We're trying to make this everywhere that you need it. In particular, my favorite one is the Slack one because you can just be having a conversation naturally and somebody just at Grafana and brings in production telemetry kind of insights right into the chat for everyone.
And it reads the context, of course, of the thread so it knows what you're dealing with. Amazing. And we have it integrated everywhere. We've got MCP both sides, so you can plug any MCP server into the assistant, so it can use that when investigating or carrying out tasks for you. And you can plug the other way around, plug the assistant into other agents. We just want to play nicely really whatever your situation is and whatever your workflows look like. Watches is another area that this kind of fantastic always on capability. What happens is you calibrate the watcher, that's when you burn the tokens up front. That watch is then lightweight and it will just keep looking at whatever telemetry it's figured out, it needs to look at. So it could be brand new feature. We want to watch this as it goes into production to keep an eye on it.
And maybe for a couple of weeks after we want to keep watching it. The agent can then intelligently notice what's normal and tell you when something changes. And from there you can just launch an investigation. You can do it yourself or you can get a Slack DM or tell it automatically to fire off and start investigating.
Investigations are a very special agent that we've put together, which essentially goes around, uses the context it has, and it comes up with hypotheses. And then adversarially, concurrently, other agents try to disprove that. So they kind of have a little battle inside and it drives the quality up. And this is what we're seeing for us, this is great. It'll prove some hypotheses correct. It'll disprove things. It might find root causes, it might find symptoms. For us, it often finds what the issue is and this has just been an incredible level up for us. How do we do this safely? How do we build all these things? How are we even iterating with any kind of confidence? Well, we had to put this app together. We had to build agent observability for ourselves and at the same time, we built it for you as well. So this gives you everything you need if you're building agents and running and operating them at scale.
You get high level analytics. You can of course filter this down Grafana style. You can just see everything where time is going, where tokens are going. There's also forensic view of the conversations themselves. So you can see the messages, of course, the thinking inside there, if it has tools. And if you've written tools that you've also instrumented, we bring the traces for those tools right into the view so you get the mechanical and the agentic together. So this is massively powerful. We use this every day and this is what helps us iterate with confidence. We know if we make a change, we know if we've improved things or have had some inadvertent effect elsewhere, it just becomes visible to us. Now, of course, I'm going to be saying this, but I'm going to welcome on somebody from SailPoint who is leveling up their observability using these tools.
So please welcome to the stage Omar Lopez.
Omar Lopez: All right. Hey everyone. It's great to be back at ObsCON. I'm Omar Lopez and I lead the observability team at SailPoint. Now, if you're not familiar with SailPoint, we are an identity security company which protects every identity, human identities or non-human identities, machine identities, and of course AI agent identities. Now, a few weeks ago, we had our own conference down in Austin, and at that conference, one of our executives tells a story about a customer, and this customer was adamant that they had no AI agents in their environment, but when we got working with them and did some discovery, found out they had 10,000 agents and many withstanding admin privileges. So discovery is extremely important as well as assigning ownership and securing those agents. So as I mentioned, it's great to be back at ObsCON. In 2024, I gave a talk as well, and it was about why we moved into Grafana Cloud.
And now it's been a few years. We've had access to all the tools and services Grafana Cloud has to offer. And one of those is Grafana Cloud traces. We migrated off another platform and we really leaned into Assistant to write sampling rules and migrate dashboards, write and understand TraceQL queries. Typically, this could take a month or two. We were able to do it in a week with one engineer. It's been a tremendous help. But we're not only moving services, we're onboarding new teams. Our access and risk management team came over in an acquisition and they were new to Grafana Cloud. They had never used it before and Assistant really became their best friend. It really helped flatten the learning curve for them. They used it to learn and write Prime QL, create dashboards. They started using it to run investigations, and this really helped to reduce their incident response time or incident investigations.
It took them from hours down to minutes to resolve these incidents. And so we wanted to look more into these investigations. And a few weeks ago, our internal team had an incident. Luckily it was in dev and no external customers were affected, but I wanted to test out investigations myself. So I jumped into the incident Slack channel and I did @Grafana, "Run an investigation. Tell me what you can find out and let me know." I gave it some context, but sure enough, a few minutes later it came back. It knew exactly what happened and it even offered a couple of solutions. And so once that incident resolved, our incident command manager, Corey, reached out and was like, "Yo, hey, that was cool. There's a Slack channel right there. It's a Slack to me. Can we get more of that please?" And so it makes so much sense the more we though about enabling a investigation for every incident because it knows so much about all of our metrics, our SLIs and SLOs, our tracing data, service maps, service dependencies, any changes that's happened.
Assistant knows it all. And so we're excited to start looking at what we can do with that in the future. Now, last thing I want to leave you all with is the human element of all this. We talk about AI and agents all day, every day, but there is a human aspect to this because our humans using these tools and I get a lot of feedback at SailPoint about how Assistant is just making their lives so much easier. A lot of the grunt work and toil has been reduced, myself included, I'm a part of that. So I just want to thank you to the GrafanaLabs team. They've made an incredible tool. It's made a lot of happy end users at SailPoint. So yeah, that's my time. Thank you. I'm going to kick it back over to Cyril.
Cyril Tovena: Hello everyone. Well, thank you Omar for that. I'm really excited to show you what the team has been building in the AI department and I'm really proud too. So we've been really focusing quite hard on trying to make your operation and also your engineering in general more autonomous and all of this so that you can keep up to pace with this new era. But we're not going to stop there. We're going to give some new superpower to the assistant. And today I'm proud to announce that we are putting manage sandbox in public preview in Grafana Cloud.
So this really gives our agent and the assistant the ability to tap into your code, tap into your GitHistory, being able to build, test, write script, run scripts, or even trigger some workflow wherever you are. So that means on Grafana, on GitHub, on Slack, and even on a schedule. For us, this has really been the next level of operation. It's been really useful. For instance, we do a lot of GitHubs at Grafana Cloud and we've been using it quite often to ask every week to prepare some and suggest some PRs for right sizing or Kubernetes clusters. We've been also building some improvement loop, making sure that every Monday, for instance, we have some PR ready to tune our CPU profiling based on hotspot that we have in our telemetry. And finally, sometimes when the team feels like it's ready, we're on Slack, we're chatting about a new feature and we're just asking the assistant to do the release and watch it land.
But that's just free example. There's probably many other example. Every team has a lot of operational work that no one has really time for. And you can now end off that list to us in Grafana Cloud. So I want to quickly talk about how it works. So for every task, the work is done inside a dedicated Micro VM and you can actually customize it, set it your way. So that means you can have your own Docker file to explain the tools that you need to set up. You can also have your own secrets and you can set up some policies. You have the control. You can decide when the assistant is going to make PR, if it has the right to push branches or even what kind of network access it's going to have. And then finally, I think this is the magic a bit in this is that this sandbox sit right next to your telemetry.
So like metrics, logs, trace, profile. And it's not just actually writing code, it's actually correlating your life telemetry so that you can make the right change for you.
So we're going to do a quick demo. I want to show you how it works very briefly. All right. So at the same time, I want to show you also the new Grafana Cloud assistant home page, which is this one. It's pretty cool. It's looking pretty slick. And I wanted to show you also, I have an overview of the watches here that are running. I don't think I have any issue. Yeah, nothing. I have my automation here, so watching PR, hill climbing, the CI, making sure my branch are released. So you can use this page to just jump back into the action if you need to. So my previous work, or I can just start something. Been working on a chat app, like a bank chat app, and I've heard about some issues in the chat services. So I'm going to ask about this. So find out why the customer chats fails.
So this is a workspace. I don't know if everyone have seen workspace before, but it's conversation first view where you can really try to get into understanding what the agent is telling you and when you need to, you can look at the information on the site. And here you can see that as I ask, it's just coming back with showing me the problem with a nice physician and a graph, and you can always look at all the sources that the agent is doing. So I'm going to ask it to investigate now, which was one of the suggestion. And it's really just going to try to figure it out the scope of this problem and it's asking me if I want to continue. So I'm going to say yes, but obviously if you're not happy with the scope of the investigation, you can always keep chatting or you can also ask it to just start looking at your telemetry from there without an investigation.
So the investigation started is creating some hypothesis that you can use to help and steer. So if you know that something already, you sometimes have more context yourself than the agent, you know that this is not the issue and you can go there and directly disprove the evidence and tell it why. So why it's happening, I want to show you something else. I want to show you that my team has been asking me to standardize the metrics for the outcome of the customer chat request. And I wanted to do that. So what I did is I basically asked the assistant, it created a PR for me directly on my BI, so we can see the PR here. So I'm showing you the PR. So I'm just going to scroll back up. There we go. So you see it did it on my behalf because I generated that myself and I asked the assistant and then I can go back to the chat if I need to, but I wanted to put your attention into also those assistant in GitHub now, so those comments.
What happened is that the assistant goes into your PR during the CI checks and it will be able to show you if there's any issue related to instrumentation or your infrastructure. So it's using that knowledge to tell you, well, this PR apparently is going to break a SLO. And from there, you can actually ask for making a fix in Grafana or you can follow up directly in GitHub and ask Grafana more question.
All right, so I'm going to go back to this one. So it sounds like you already worked on GitHub and started building. So we can open this subagent here and we can see for instance that there's already a PR, so I'm going to check it out. And yeah, this time this PR has been made by the assistant, right? So directly from investigation, I get a fix in GitHub. All right, let's go back to the slide. Perfect. So a quick recap. Now you can get fixes directly from investigation and it works across multiple repo because we know that you're not necessarily having just one repo when you're building microservices.
You can build from Slack or deploy from Slack checks on GitHub. So that's something that I show you today. Not only it looks at your telemetry and to make sure that you're not making mistake, but also you can customize your own checks. So you can have database index migration checks if you want. You can have your own checks that matches your company so you can go fast. And then you can build improvement loop, improving the CPU every week based on profiling. So really manage Sandbox for us has been helping us improve a lot of our operational work, such as the fixes, the review, every little weekly task that takes a lot of toil. And with this new features, we're able to really focus on what our business is and more work on our core business. So for the rest, I'd like to welcome back Matt again so we can have some more fun.
Mat Ryer: Excellent. Thank you for that demo, Cyril, and thank you to GitHub for being available for it as well. Hookups. So Sandbox is already incredibly useful for us internally and they are foundational piece on which we're going to build. And we did that for our final announcement, which we're very excited about. To do this announcement, we have to go all the way back to the start, back those many years when Torkel was building Grafana in his bedroom, beautiful data visualizations, making that data available and accessible, democratizing it so everyone can suddenly get the benefit of all these insights. So it's not a place that we are going to stand still though, right? We want to innovate. We think there's places we can do that more here as well. And we'd love to just show you this short video.
Richard Lam: If you require RF data, be prepared to switch over your Grafana sources at lift off.
Raj Dutt: They're using Grafana to load rockets. There's nothing in Grafana that's specific to IT or observability. It's just a great general purpose visualization tool.
Mat Ryer: Because you can do whatever you want with Grafana. You can make it your own.
Cyril Tovena: So we can extend Grafana in ways we can't imagine today.
Mat Ryer: Yes. Introducing Grafana pages. What do you think? Yeah, seriously, this is an evolution in live data visualization and I can't wait to show you. Let's show them a demo of some real pages.
Cyril Tovena: Yeah.
Mat Ryer: How do you create a page, Cyril?
Cyril Tovena: So by the way, we were in page all along. Also, this is available in public preview now in Grafana Cloud. So to create a page, we are going to go to... So I prepared the prompt just so I don't have to type it and show how my type are.
Mat Ryer: That's fair enough.
Cyril Tovena: Yeah. So I basically ask here to check out traffic flow. I want to see it live, so we're going to ask that. The way it works is it's going to use the sandbox, as you said. So it's going to take a bit of time, write some code, react code, so we can maybe show something else in between.
Mat Ryer: Excellent. But that's just one sentence prompt to get a page. We'll see what it comes up with later. Here's a kind of typical sort of visualization that you might get, but actually in Grafana, you can't have it so that these labels are visible all the time. So we used pages to just give us that capability. So if you've had a feature that you just wish Grafana did, but it never did because you're basically the only person who wants it, now you can have it and it's just a prompt. Yes. Round of applause. Why not? I want to find out what that feature is that they are so excited about, but I think we can do a little bit better than this. And so we remixed it. So remixing is a way of taking a page that you love and making it better or tuning it more to yourself.
And again, this is just a prompt to do this. So if you see a page, I think teams are doing this already internally, that there's a page that's useful that they love and they're able to prompt it and you can just go amazing, not northern,
Cyril Tovena: But actually
Mat Ryer: Honestly, it's probably going to figure out what you mean. The LLMs are quite forgiving, which is lucky for Cyril really.
Cyril Tovena: I'm struggling.
Mat Ryer: No, no, you're not. You're doing absolutely great. Yeah. You zoom out?
Cyril Tovena: Yeah, I'm trying. Do
Mat Ryer: You want me to do it?
Cyril Tovena: Yeah. Yeah. Something is going on.
Mat Ryer: Oh yeah. It's not zooming out. Excellent. Unfortunately, we didn't pray to the demo gods because we're demo atheists, so now we're on our own. That's amazing that that's happened.
Cyril Tovena: There
Mat Ryer: We go. First time. Yes.
Cyril Tovena: First time. Yes. All right. Should we show how the page look like? Because we prepare it in advance.
Mat Ryer: Yes. Check this out. Prepare yourselves. Let's go full screen. Look at this. Look at this. The shimmer in the Northern Lights, it's really understood the brief here. It's beautiful. This is real data that drives this. So this could be live telemetry that you're looking at here.
Cyril Tovena: Yeah. It's using the Infinity data source to grab the data online. So it's pretty nice. And you can trust it. You can look at the data source.
Mat Ryer: Yeah. And if it is going to reach out for data, it's only going to do that if you've approved it to do so with approved URLs, or it'll ask you in the app to allow it. Same for if it's making any actions or anything. But genuinely, yeah, this was a remix and then a little bit of iteration, but not much and not as much as you'd think. The harness in pages is really doing a lot of the heavy lifting to make this happen. We've done all that work so that you don't need to. This is just, look at this. Yeah, he's just changing the theme there, get nice gray scale one.
Cyril Tovena: Yeah. So the assistant can come up with theme for you and you can select the theme and it stays with you so it has some sort of storage.
Mat Ryer: Yeah, incredible. So if you've got to do flashy presentations, this is going to be the tool for you.
Cyril Tovena: Right.
Mat Ryer: Useful one though here.
Cyril Tovena: Useful one. Yeah.
Mat Ryer: What's this
Cyril Tovena: One? So this one is using my GitHub MCP or off to actually go and check the repository that I want to look for CVs. And then you use, again, the Infinity data source to grab the CVs. And because it can write code, you write a little program to just being able to find the CVs in my code. And so we find a couple of them, this is a demo application. I see. We don't have those CVs.
Mat Ryer: Yeah, normally we're a bit more secure than this.
Cyril Tovena: Yeah.
Mat Ryer: Yeah.
Cyril Tovena: What's funny though is that it's useful, but more than that, as we've shown before, now that the sandbox exists, we can actually make fixes. So you can integrate with the assistant because there's a SDK into pages. So you can call the assistant whenever you want from the pages and you can create a fix so we can ask to fix it. Now it's ready to go.
Mat Ryer: Yeah. So that's actually really powerful. This is basically the pages themselves can be agentic, and you can just ask for it to do that and it's going to be able to do it. So if you're building complex things, I mean, you could build applications with this, you can build tools that you reuse. The limits really are in your imagination. And then the team's done a lot of work to embed all of Grafana's kind of knowledge and taste into the agent. So what it produces will always look good.
Cyril Tovena: All right. Going back, it's still running because the way it works is that it's taking screenshots. It's not just one shot thing. It's like taking a screenshot where it is and then looking if it looks good, maybe there's a margin that is not great, and then it's keeping at it. And so you always, from the start, you let it run from the start, you get something super good.
Mat Ryer: Yeah. So this is the prompt that we asked for earlier. And look, it's just one small sentence and look what it produces. By default, out of the box, you're just going to get delightful experiences. That's our mission with pages. Theming is also baked in. This great decisions made by the team. It just works fantastic.
Cyril Tovena: Yeah. So I want to show you the source here. So if we go to sources, I can see the queries that it's doing so I can dig and make sure I trust that. I can see it's using that metric from Prometheus.
Mat Ryer: Yeah. This is important, of course, because we know that they can hallucinate. So we do a lot of error correcting on your behalf, and this is what allows you to just trust this data, but of course verify.
Cyril Tovena: One last.
Mat Ryer: One last one?
Cyril Tovena: Last one.
Mat Ryer: Okay. So get ready. So this is real data from one of our services, and this is showing live traffic around the world and where it's going, which regions it's going to in this beautiful map view. I feel like a weatherman. Let's go here because there's a band of low pressure here that we want to look at. So we can click to zoom in. In we go. And yeah, now we can dig even deeper into this. We see the architecture of the system that we're talking about. Yes, thank you. And we can go and look at the pods and see which pods are actually getting hit with the traffic. So yeah, beautiful, functional, kind of incredible. And we did this just by kind of asking for it and just sort of imagining what we could build here. We're going to ship a load of these pages for you to remix yourselves out of the box, but this is already available.
And yeah, we think pages is an evolution in how we're going to be working with data, how we're going to visualize things, how we're going to tell stories about our data to ourselves and to each other. It's connected to live data. There's a lot of work that went into making sure that we deal with the data in a context efficient ways and wire things up properly. You get all the building blocks of Grafana, so if it's going to visualize a metric, it's probably going to reach for a Grafana visualization, unless you ask for something a little bit more adventurous. Having the agent baked right in so that the pages themselves are agentic, I think is another layer when you think of what problems you can solve with this. Incredible. Agents have changed the pace of software. We're here for it, and we're here to help you keep pace as well through the observability.
Thank you. We're going to hand back to Tom now. Thank you so much. That's great, mate.
Tom Wilkie: So I'm just here to wrap us up and take us home. You've heard from, I mean, I think it was like eight to 10 presenters. We talked about cloud economics, how we're evolving adaptive telemetry, how we're bringing more scale to our databases, about bare metal and bring your own cloud. Talked about context, how we've been improving the knowledge graph and embedding it throughout the entire experience and how we're bringing DEM, digital experience management to Grafana Cloud. And then of course, finally, you saw pages, you saw agent sandboxes, you saw all of the AI suite from Grafana Labs, really exciting stuff, and you were the first to see it. So thank you so much.


