Plan your experience at ObservabilityCON 2025
Don't miss the hands-on workshops, inspirational live keynote, or technical deep dive sessions—all led by observability experts.
Register (50% off)

Find out how LexisNexis went from logs only to fully autonomous incident response, using AI in Grafana Cloud to extend its observability beyond infrastructure telemetry into business and operational data.
Grafana Labs CTO Tom Wilkie and Anthropic's Head of Platform Engineering Katelyn Lesse discuss a shared realization: you can't run AI or observability at scale without the other. Get a candid look at the a-ha moments and lessons learned building AI into observability, and observability into AI.
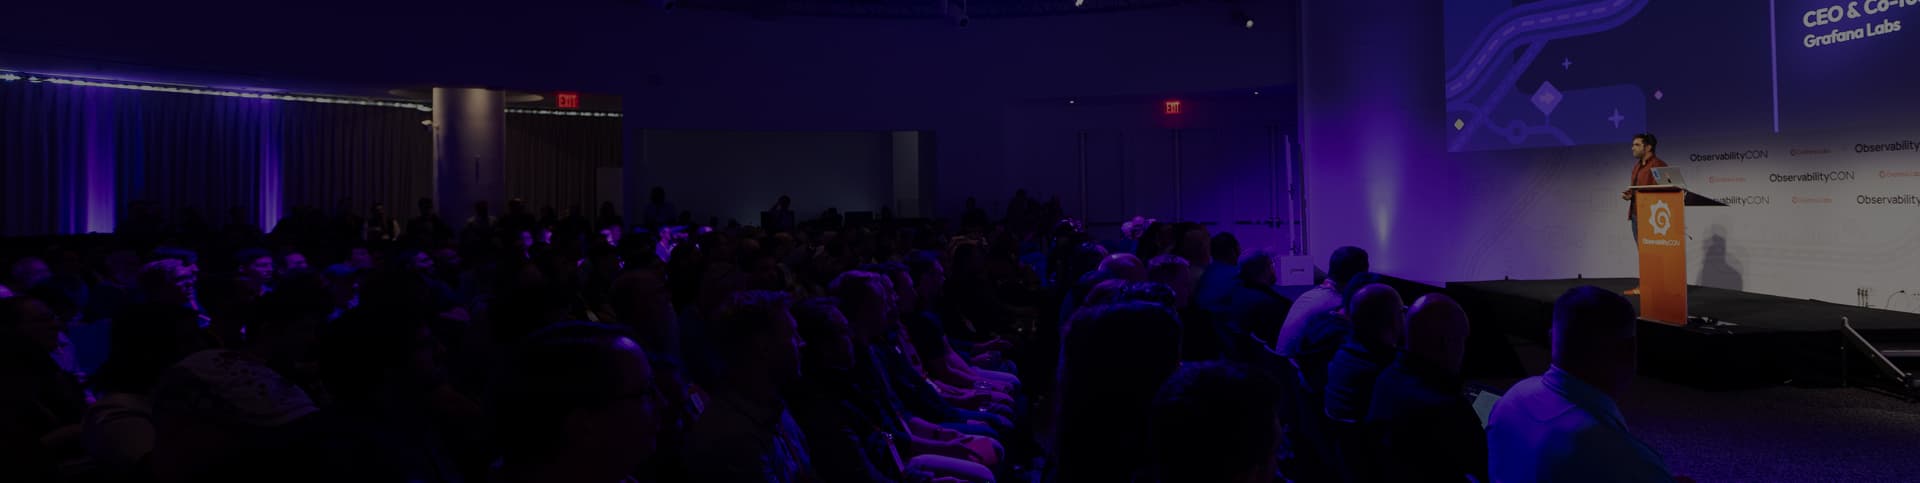
Join Grafana Labs CEO/Co-founder Raj Dutt, CTO Tom Wilkie, and members of the engineering team for the kickoff of ObservabilityCON 2026, where they share the latest in AI for observability, observability for AI, and solutions for all.
Learn how Deutsche Telekom IT GmbH built a FIFA World Cup 2026 Situation Room in just a few weeks, using Grafana Cloud's AI-powered Assistant to speed up dashboard creation and incident response during one of the world’s largest live sporting events.
Welcome to the era of agentic operations. See how Grafana Assistant makes observability proactive, not reactive, taking on more of the work of deploying, running, and fixing your software applications.
Say goodbye to black-box agents. Grafana Cloud makes agent sessions a new telemetry signal—correlated with metrics, logs, traces, and profiles—that helps you understand not just whether agents are working, but how and why.
Learn how Uber uses Grafana Cloud Profiles to give thousands of engineers performance visibility across millions of CPU cores – combining Generative AI and neurosymbolic analysis to optimize code automatically and deliver significant cost savings.
Learn how Grafana Cloud quickly connects what your business sees to what your systems are doing, using an end-to-end playbook built around OpenTelemetry standards.
See all the ways Grafana Cloud raises the bar on cost efficiency and operating at scale: needle-in-the-haystack log queries, faster ingest and query speed at billions of active series, plus intelligent sampling and more in Adaptive Telemetry.
Adaptive Telemetry led Rapid7 to Grafana Cloud. Learn what happened next, from enabling interns to ship production dashboards on day one with Grafana Assistant, to reinventing support using Frontend Observability and Assistant for understanding real user journeys.
Observability tells you when systems fail, not when users do. Learn how to close that gap in by connecting user journeys, session replay, and a knowledge graph to surface real user behavior and session-level evidence in Grafana Cloud.
Learn how UKG compressed a 15-month transformation into four through a targeted delivery strategy, technical guardrails that reduced risk, and an AI-assisted dashboard and alert conversion that accelerated adoption at enterprise scale.
Get a closer look at how Grafana Cloud simplifies incident response and management so that incidents start with context, postmortems write themselves, and every incident makes the next one faster to resolve.
Learn how DriveWealth built a single agentic auto-triage layer in Grafana Cloud for its regulated, real-time brokerage environment, so critical context is collected even while on-call engineers are sleeping.
The next observability users are agents. See how any agent—whether it's Grafana Assistant, third-party tools like Cursor or Claude Code, or homegrown—can interact with Grafana Cloud to help triage, troubleshoot, or advance your business needs.
Learn how Coreweave's Mission Control AI simplifies observability and troubleshooting experience by querying Grafana, Loki, and Prometheus, bringing natural-language workflows to live observability data.