That’s a wrap on ObservabilityCON on the Road Amsterdam
Be the first to know updates on future ObservabilityCON events
The annual open source observability conference from Grafana Labs
Open source observability updates
Hear what’s new in the open source observability landscape and connect with community members
Technical tips and tricks
See how recent developments in the LGTM stack can help you optimize telemetry costs, shift left with performance testing, and streamline incident response
Expert advice
Get your technical questions about Prometheus, OpenTelemetry, and other open source observability topics answered by Grafana Labs experts
Community success stories
Learn from users who are transforming their approach to observability, managing exploding telemetry data volumes, and slashing MTTR
Agenda
- 9:00 AM 10:00 AM
Registration + Expo
Enjoy a light breakfast while networking with attendees and exploring Grafana demos in the Expo hall - 10:00 AM 10:45 AM
ObservabilityCON on the Road Keynote
Live in Amsterdam, it’s ObservabilityCON on the Road! Join Grafana Labs CTO Tom Wilkie and VP Solutions Engineering Dave Russell for a look at the latest trends across the observability ecosystem and developments in the open and composable LGTM (Loki-Grafana-Tempo-Mimir) observability stack.

- Dave Russell, VP, Solutions Engineering, Grafana Labs
- Tom Wilkie, Chief Technology Officer, Grafana Labs
- 10:45 AM 11:15 AM
How to reduce observability costs by controlling metrics growth
The shift to cloud native architectures and increased developer autonomy to instrument applications has caused an explosive growth of metrics data and cardinality. But more data does not mean better observability: It can be difficult to balance scale while managing costs.
Learn how Grafana Cloud can help lower your observability bills. By regulating metrics growth through governance and unique customized aggregations, you optimize your costs and pay closer to what you actually use.

- Dimitar Dimitrov, Software Engineer, Grafana Labs
- 11:15 AM 11:45 AM
Through the looking glass of OpenTelemetry
Mambu provides a cloud banking platform to hundreds of customers in more than 65 countries. In this talk, Senior Engineering Manager Onur Beygo will share why and how the company is standardizing on OpenTelemetry and Grafana Enterprise to achieve vendor-neutral, open source observability, with meaningful insights gained through the correlation of metrics, logs, and traces in one UI. You’ll also hear how the observability team gained mindshare by quickly showing business value and creating an easy path for development teams with autoinstrumentation, and what’s next for OpenTelemetry and the Grafana Stack at Mambu.

- Onur Beygo, Senior Engineering Manager of Observability, Mambu
- 11:45 AM 12:45 PM
Lunch
- 12:45 PM 1:15 PM
How to manage the tradeoff between cost and coverage for observability logs
Logs have always been, and continue to be, a critical part of the troubleshooting workflow for observability and SRE teams. But the reputation of legacy solutions being expensive on budgets and resources – for storing and querying – results in teams making tradeoffs on which services and applications to instrument logging. This creates observability blind spots.
Learn how Grafana Loki can help you optimize multiple stages of your logging lifecycle – from supporting multiple log formats and smaller indexing, to blazing fast querying and long-term retention. Uniquely built on Prometheus architecture, Grafana Loki is a cost-effective logging solution purpose built for observability.


- Ward Bekker, Senior Principal Solutions Engineer, Grafana Labs
- Michel Hollands, Senior Backend Software Engineer, Grafana Labs
- 1:15 PM 1:45 PM
From OSS to Grafana Enterprise: What Topicus. Education learned along the way
Topicus provides learning platforms that deliver teacher empowerment, student and parent engagement, and operational and financial excellence for schools across the Netherlands. Six years ago, the Topicus team started hacking together a monitoring platform for the company’s systems using open source Grafana, before eventually moving to Grafana Enterprise on prem and adding Grafana Enterprise Logs. In this session, you’ll hear the lessons they learned along the way and what they wish they’d known before they started.

- Kenneth Veenstra, Teamlead of the platform and infrastructure, Topicus
- 1:45 PM 2:15 PM
How to avoid the most common Kubernetes monitoring mistakes
Which metrics should you collect? What dashboards are best suited to effectively monitor Kubernetes clusters? How do you measure resource utilization for capacity planning? Often, this is all a game of trial and error – and one that business-critical services cannot afford.
Learn how Grafana Cloud’s K8s monitoring solution was built so you can avoid the guessing game and kickstart your K8s observability strategy in minutes. In this session, we break down the most common Kubernetes monitoring mistakes and share best practices on how to set up Kubernetes monitoring the optimal way.
- , , Grafana Labs
- 2:15 PM 2:45 PM
Afternoon break
- 2:45 PM 3:15 PM
How to prioritize critical resources through SLO-driven Incident Response & Management
Prioritizing performance issues based on business impact is often challenging because it is hard to quantify the right SLO/SLI levels.
Learn how you can build an SLO framework that unifies data from multiple disparate tools and is integrated into a seamless incident management workflow with Grafana OnCall and Incident. You can then prioritize responding to the most critical error budget burndowns, allowing your critical developers to focus on innovation rather than firefighting performance issues.

- Mitch Seaman, Director of Product, Grafana Labs
- 3:15 PM 3:45 PM
How to prevent issues from hitting customers by using load testing and tracing together
With the increased demand to ship new features, developers can overlook the importance of catching and resolving performance issues before they hit end users in production. Learn how Grafana’s unique solution of k6 performance testing correlated with Grafana Tempo distributed tracing can help developers easily prevent performance problems before they become an issue.

- Myrle Krantz, Engineering Director, Grafana Labs
- Mario Rodriguez, Senior Software Engineer, Grafana Labs
- 3:45 PM 4:45 PM
Reception + Expo
Join us for appetizers and beverages while networking with attendees and meeting Grafana experts in the Expo hall
Not what you were looking for?
Find a Grafana Labs event near you
From local meetups to virtual webinars and in-person GrafanaLive events, there’s plenty more to explore.
See all eventsThank you to our ObservabilityCON 2023 sponsors:
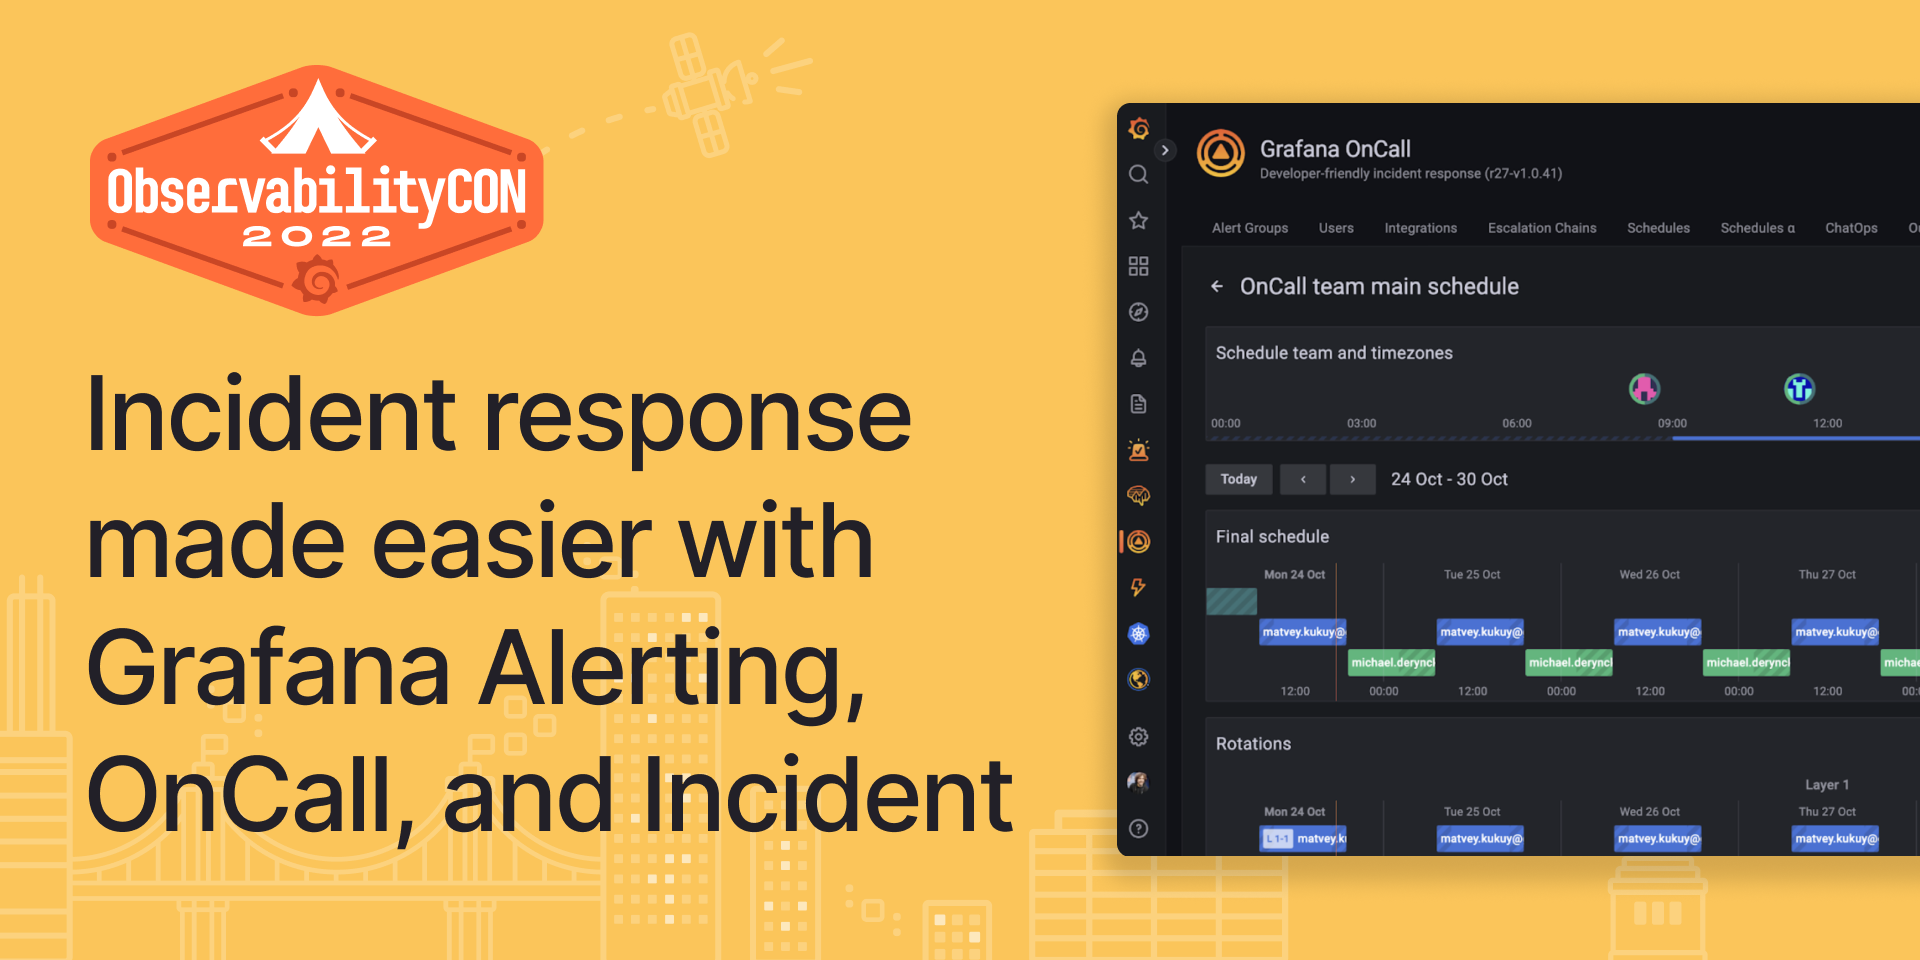
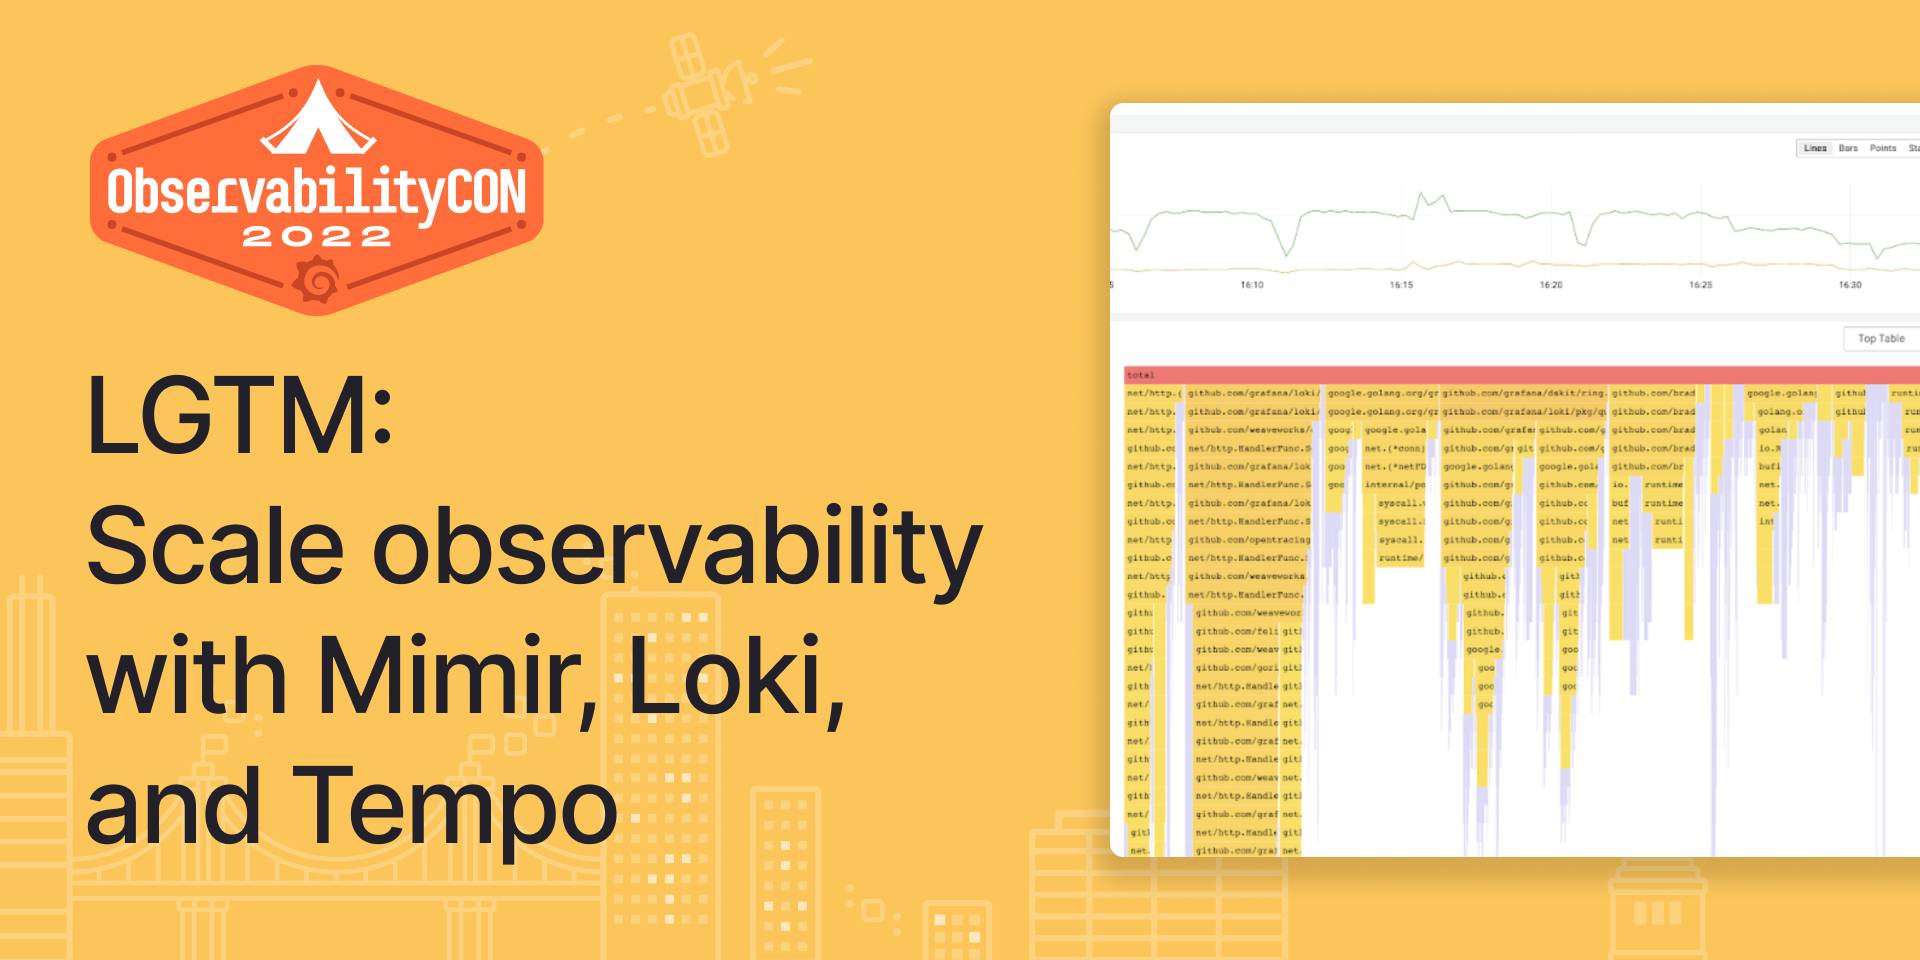
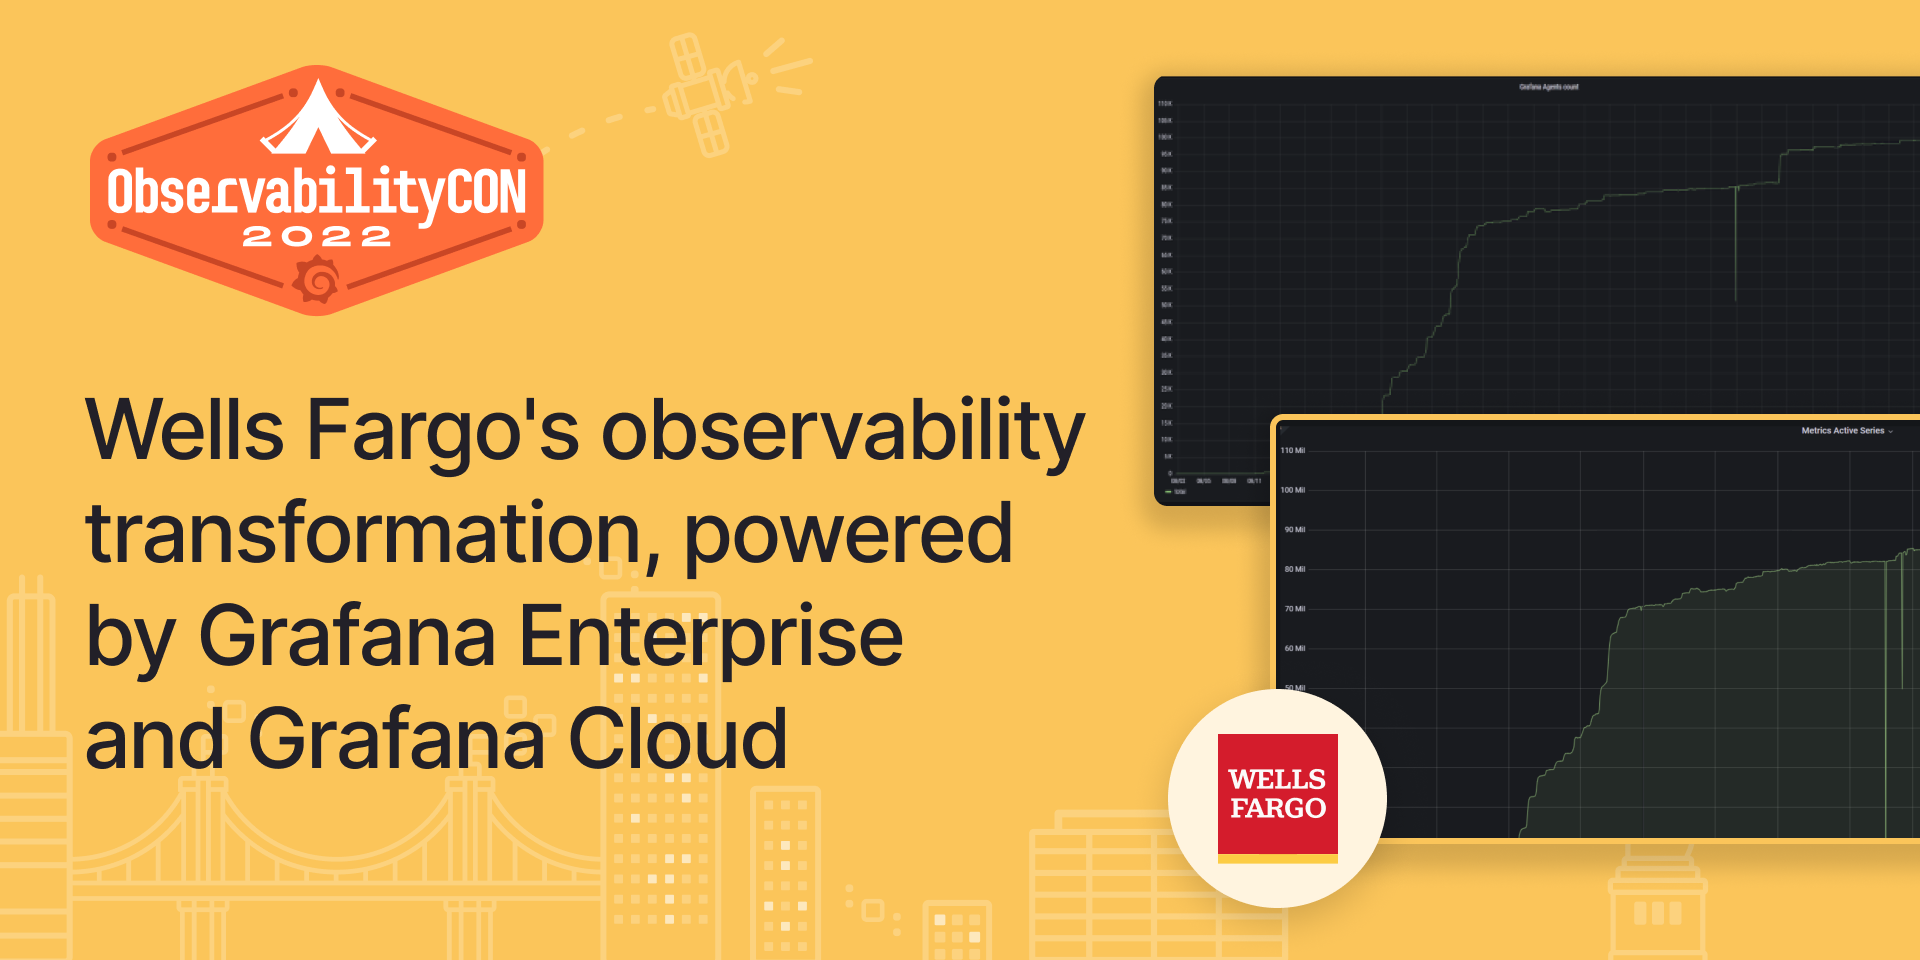
Best of ObservabilityCON 2022 in New York
See what popped up under the big tent at our flagship ObservabilityCON this past October.


