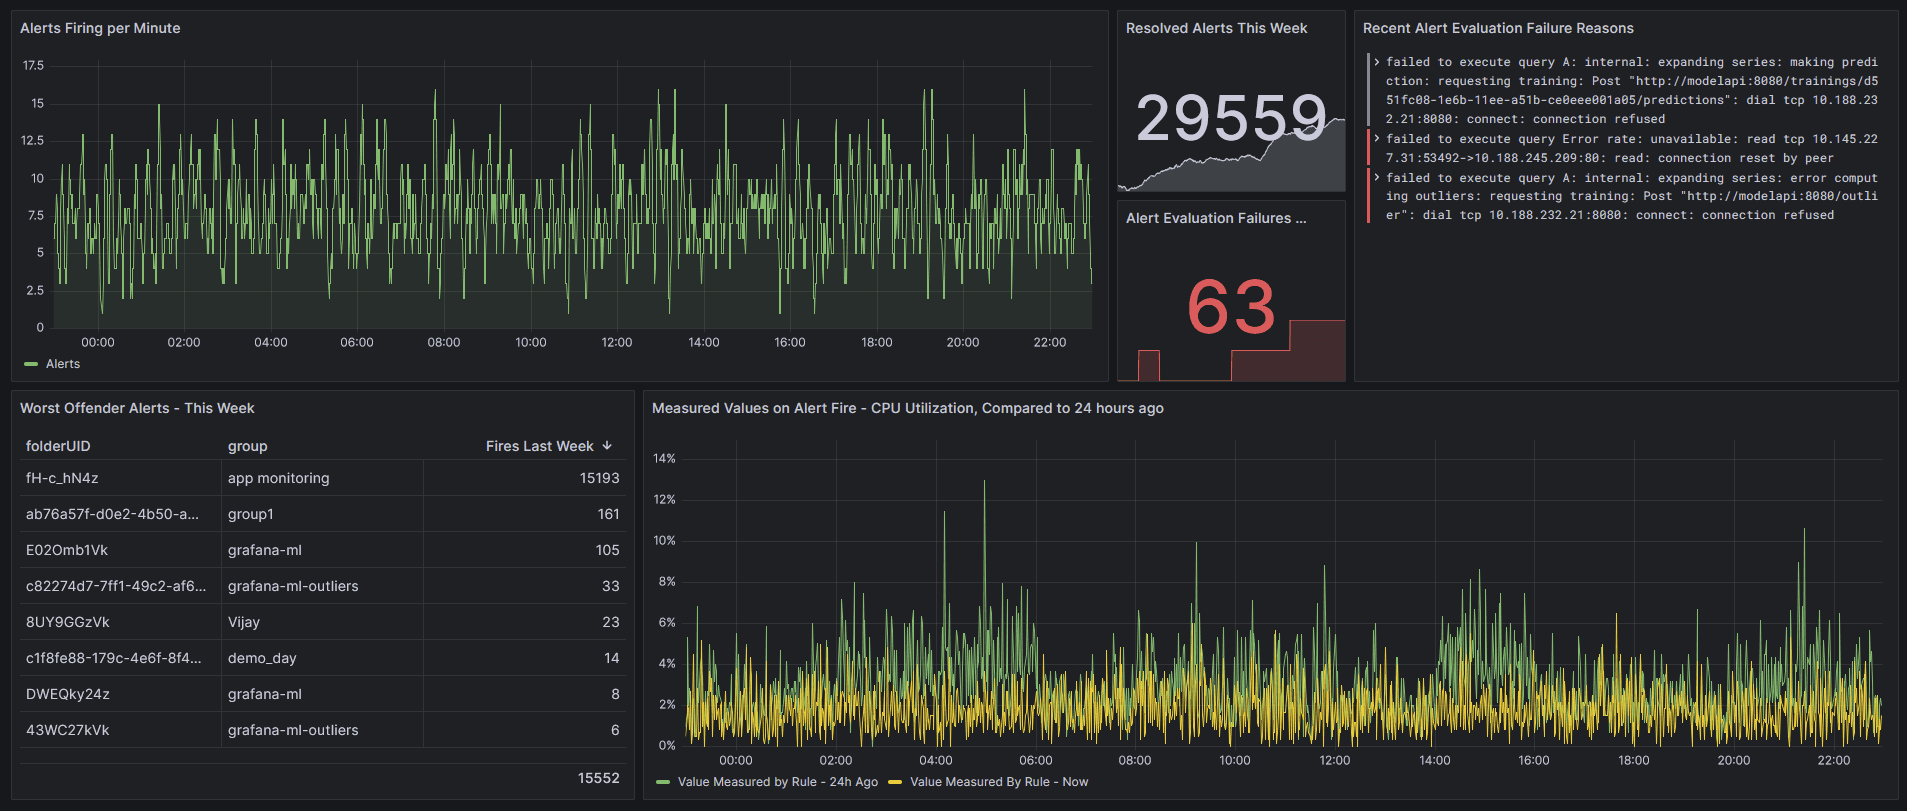
New in Grafana Alerting: a faster, more scalable way to manage your alerts in Grafana
We built a brand new alert rules list page. Find out how this new design will make your on-call life a little easier and get insights into how we...
Read more
Products
Grafana Cloud
Monitor, analyze, and act faster with AI-powered observability.
LGTM+ Stack
Key Capabilities
Observability Solutions
Open Source
Community resources
Dashboard templates
Try out and share prebuilt visualizations
Prometheus exporters
Get your metrics into Prometheus quickly
end-to-end solutions
Opinionated solutions that help you get there easier and faster
monitor infrastructure
Out-of-the-box KPIs, dashboards, and alerts for observability
visualize any data
Instantly connect all your data sources to Grafana
Learn
Community and events
Resources
Help build the future of open source observability software Open positions
Check out the open source projects we support Downloads
Grafana Cloud
Monitor, analyze, and act faster with AI-powered observability.
Observability Solutions
The actually useful free plan
10k series Prometheus metrics
50GB logs, 50GB traces, 50GB profiles
500VUk k6 testing
20+ Enterprise data source plugins
100+ pre-built solutions
end-to-end solutions
Opinionated solutions that help you get there easier and faster
visualize any data
Instantly connect all your data sources to Grafana
Konrad Lalik
Frontend engineer
Want to stay on top of Grafana and Observability news? Sign up for our newsletter.
Alejandro Fraenkel · 5 Aug 2025 · 9 min read
We built a brand new alert rules list page. Find out how this new design will make your on-call life a little easier and get insights into how we...
Read more
Alex Weaver · 10 Jul 2023 · 9 min read
Read more
Konrad Lalik · 13 Apr 2023 · 8 min read
Read more