Stop juggling dashboards with grouping-level variables
If your dashboard includes both an API gateway and a database, changing something like an $instance variable affects all panels at once. To avoid this, you might have to split up services across separate dashboards, which defeats the goal of having a unified view.
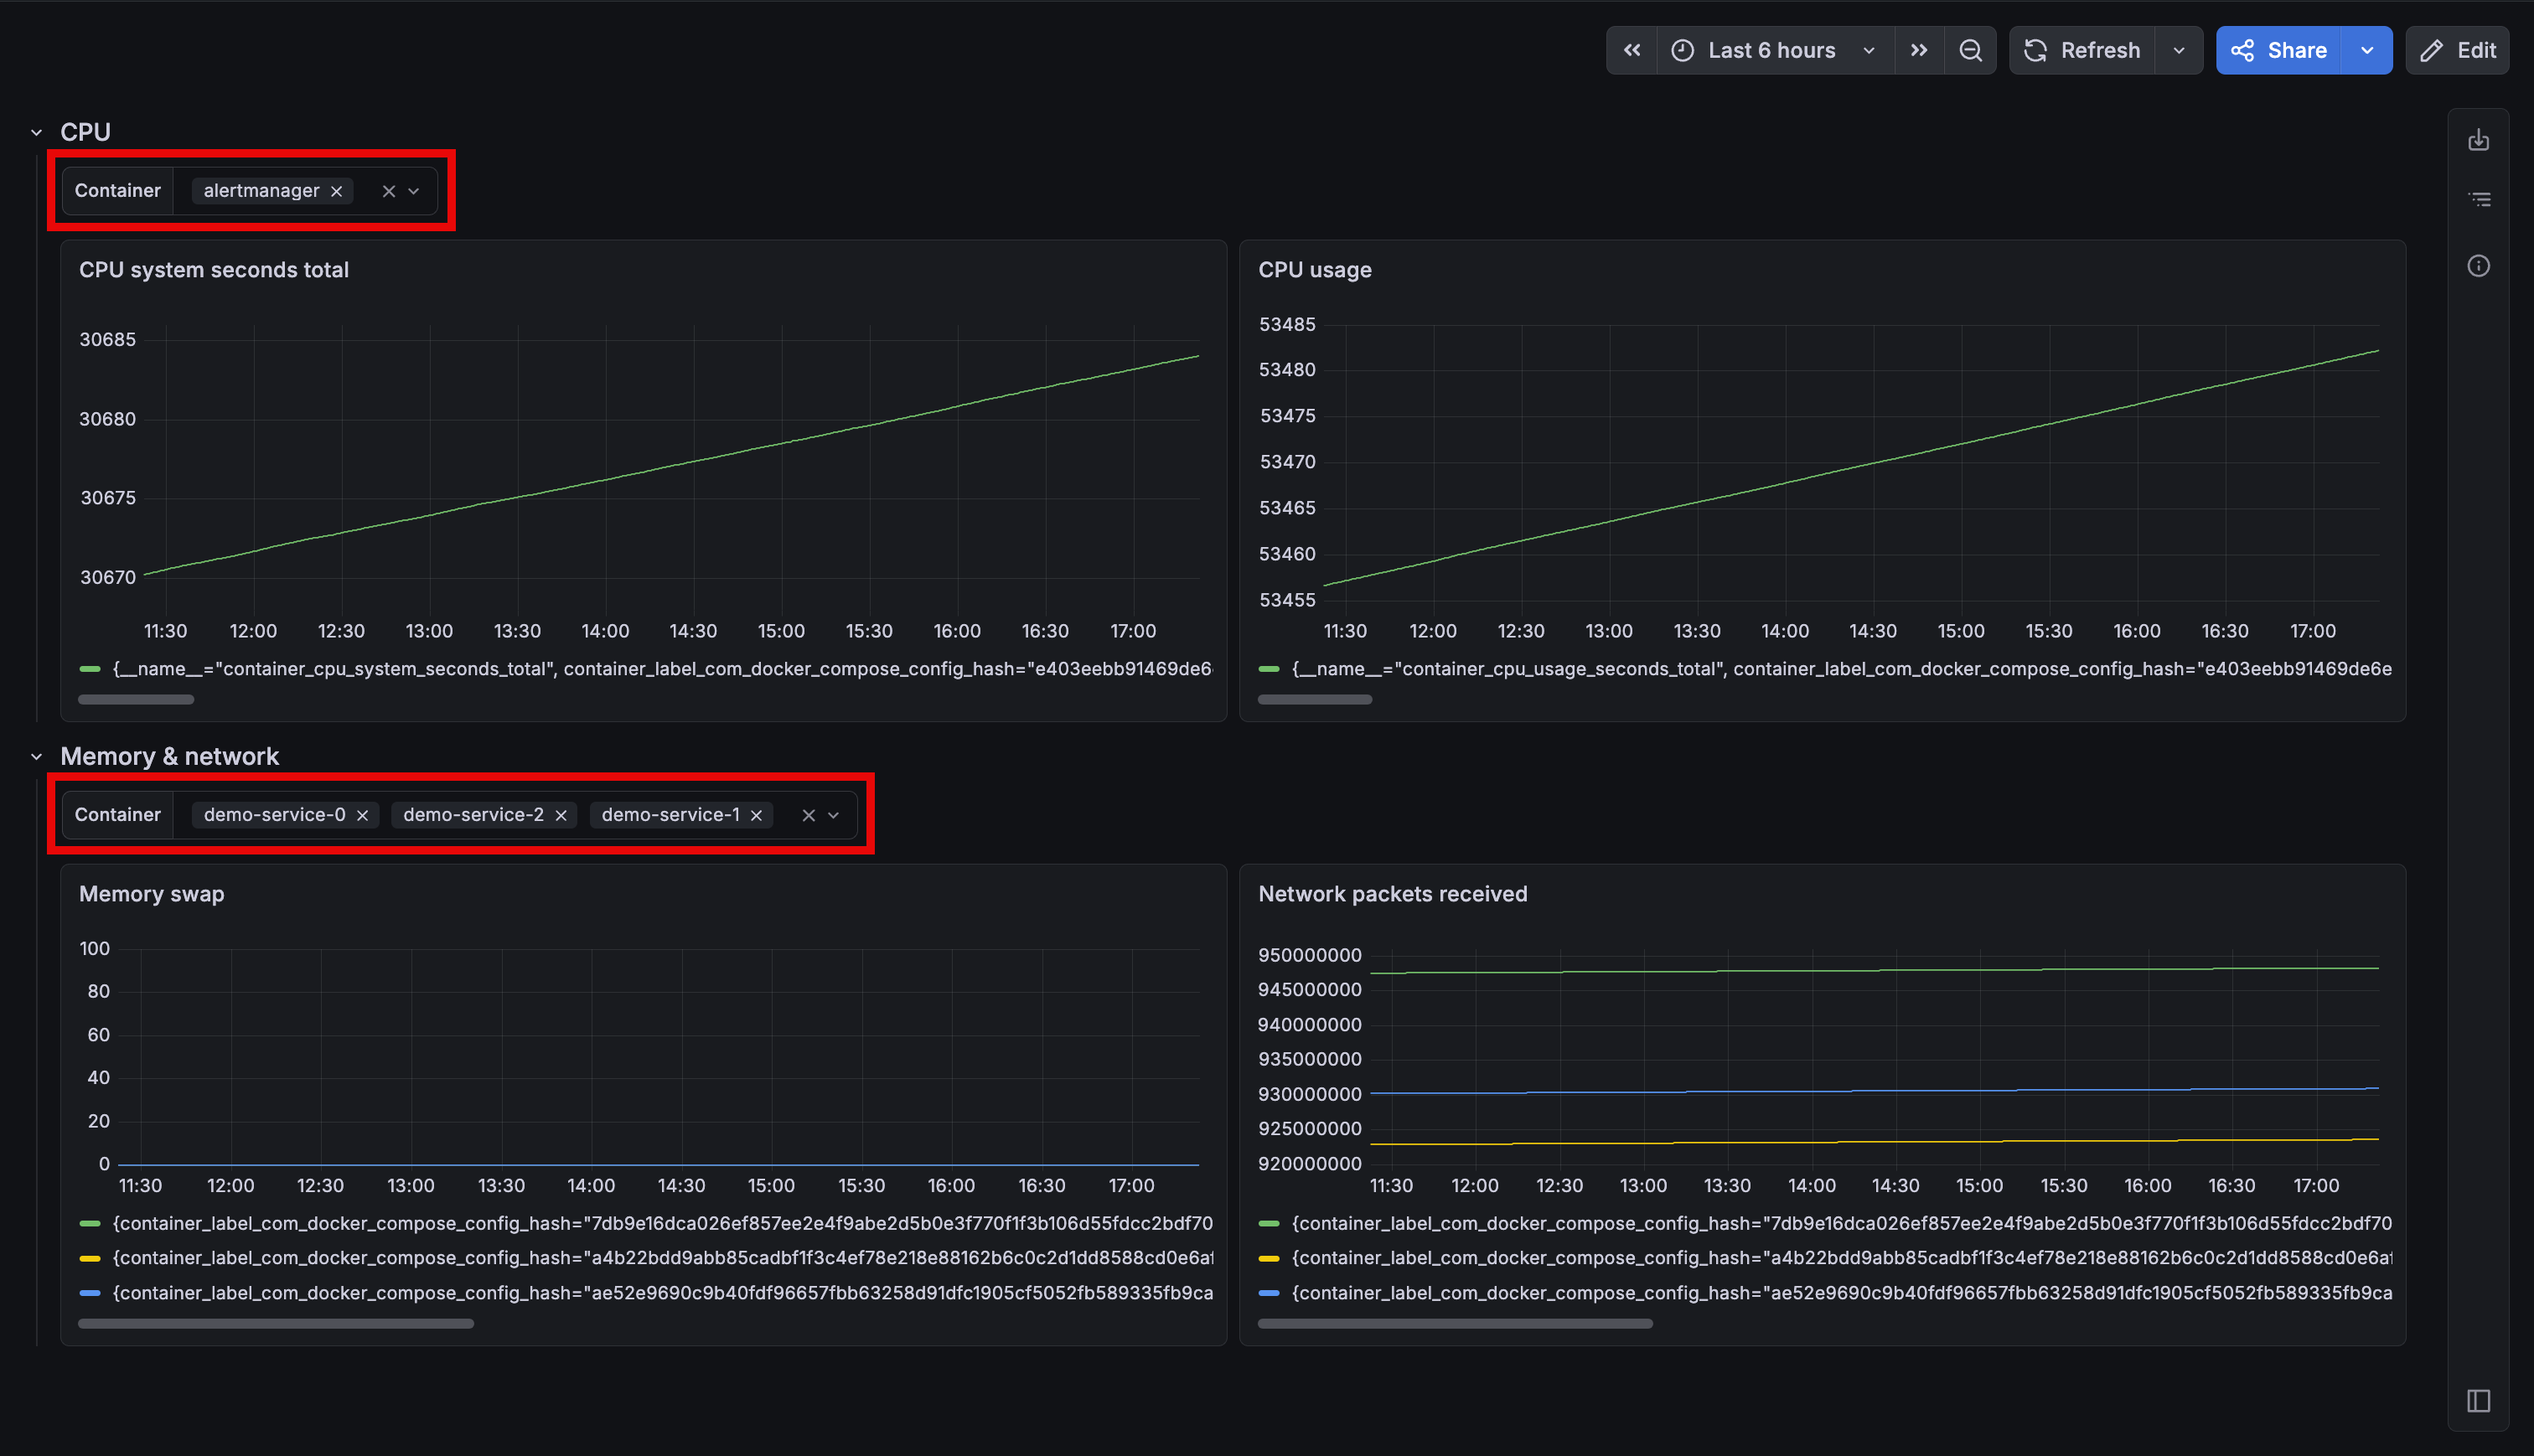
Grouping-level variables address this by letting each row or tab have its own independent filters. For example, an API gateway row can use one set of instances, while a database row uses another within the same dashboard, while sharing the same time range. The underlying dashboard remains unchanged unless you choose to add grouping-level variables.
You can add variables directly to any row or tab. Panels in that section resolve grouping-level variables first, then fall back to dashboard-level variables, while panels in other sections remain unaffected.
The panel query editor’s autocomplete is context-aware, showing only the variables available to the panel you’re editing. Also, grouping-level variables carry over when converting between row and tab layouts, and work with repeating rows and tabs.
For more details on this feature, refer to the grouping-level variables documentation.
This feature will be rolled out to Grafana Cloud stacks over the next few weeks. To try it out in self-managed Grafana, enable the dashboardSectionVariables feature toggle.
Note
In Grafana v13, we released the Filter and Group by feature in public preview. It renames the Filters variable (formerly ad hoc filters) and extends it by adding grouping for Prometheus and Loki data sources.
Grouping-level variables are supported for all variables, including the generally available Filters. However, it’s not currently supported for the Filter and group by feature.