Customize suggested dashboards with Grafana Assistant + feature improvements
You can now customize suggested dashboards directly with Grafana Assistant, making it easier to turn recommendations into dashboards tailored to your environment.
When you build a dashboard from a data source, you’ll see a Customize with Assistant option when you hover your cursor over a suggestion. This launches Grafana Assistant with a preconfigured prompt that guides you through adapting the selected dashboard:
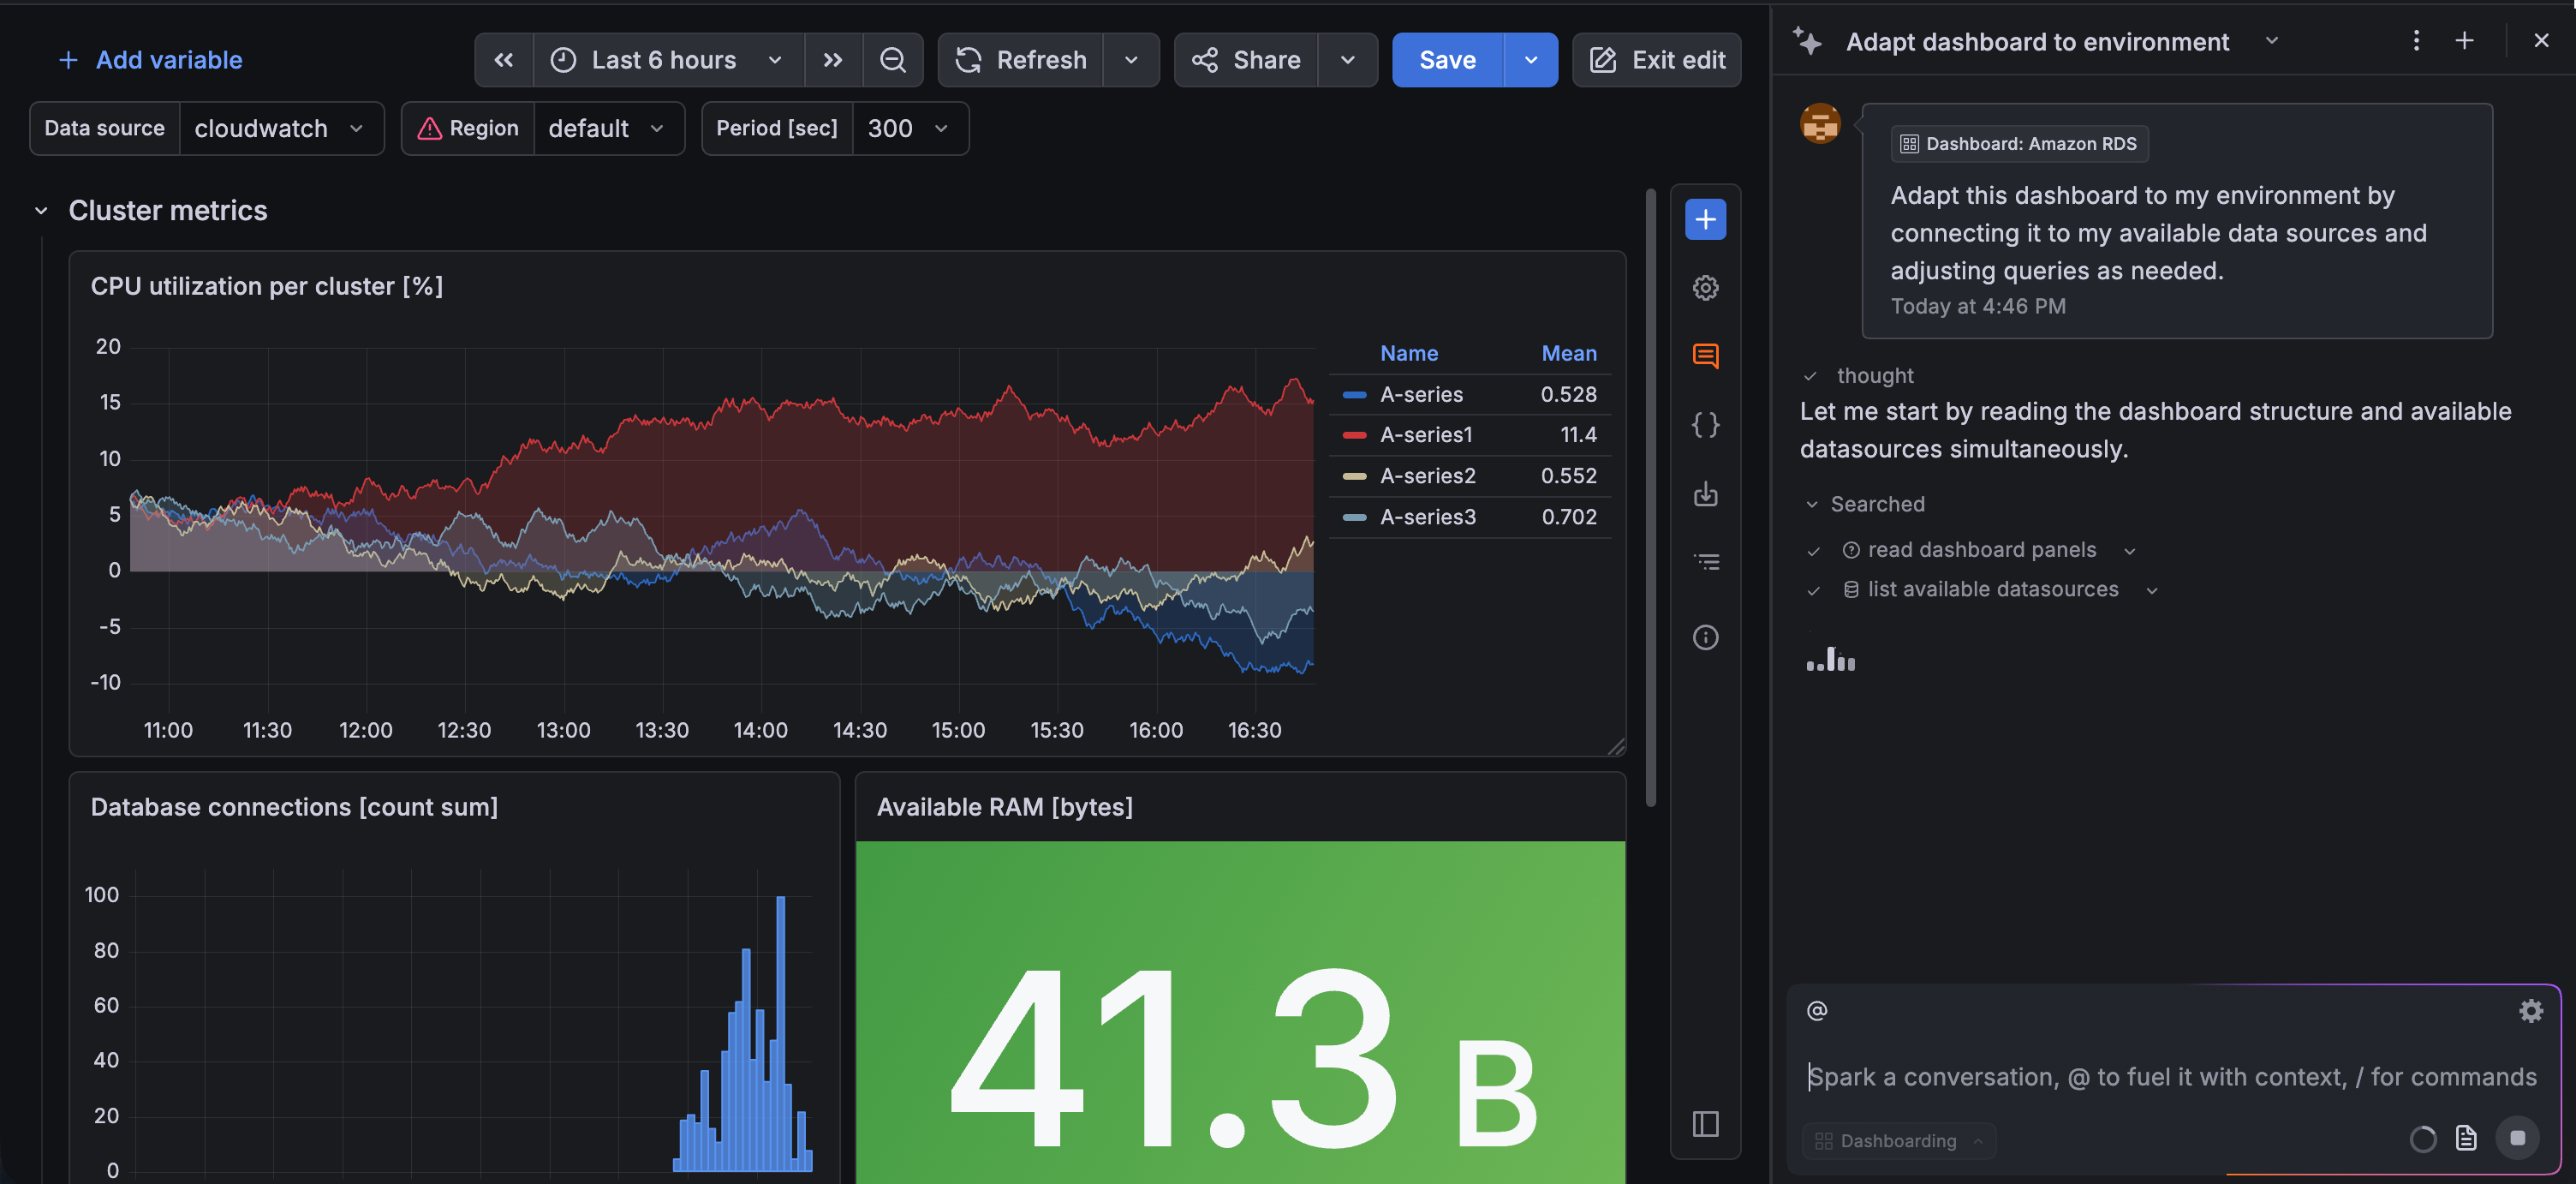
Grafana Assistant analyzes the selected dashboard, inspects its panels, and helps you:
- Connect panels to your available data sources
- Adjust queries to match your environment
- Refine or extend the dashboard with guidance
This update extends Assistant support to suggested dashboards, so you can quickly go from “suggested” to fully working dashboards without manual reconfiguration.
Improvements
We’ve also made significant improvements to suggested dashboards.
On the Data sources page and elsewhere, the Build a dashboard button has been replaced by drop-down list with the options From suggestions and Blank, giving you the choice to use a suggested dashboard or not:
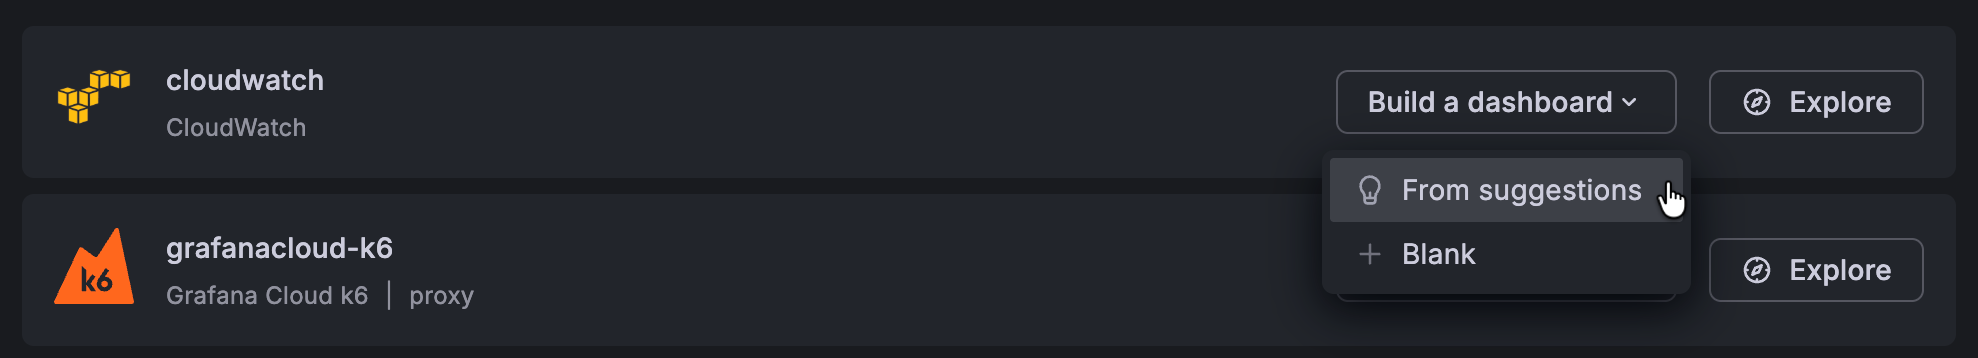
In addition, the From suggestions option is only enabled if suggested dashboards are available for the data source. If there are no suggestions available, Grafana displays a warning, and you won’t be able to select the option.
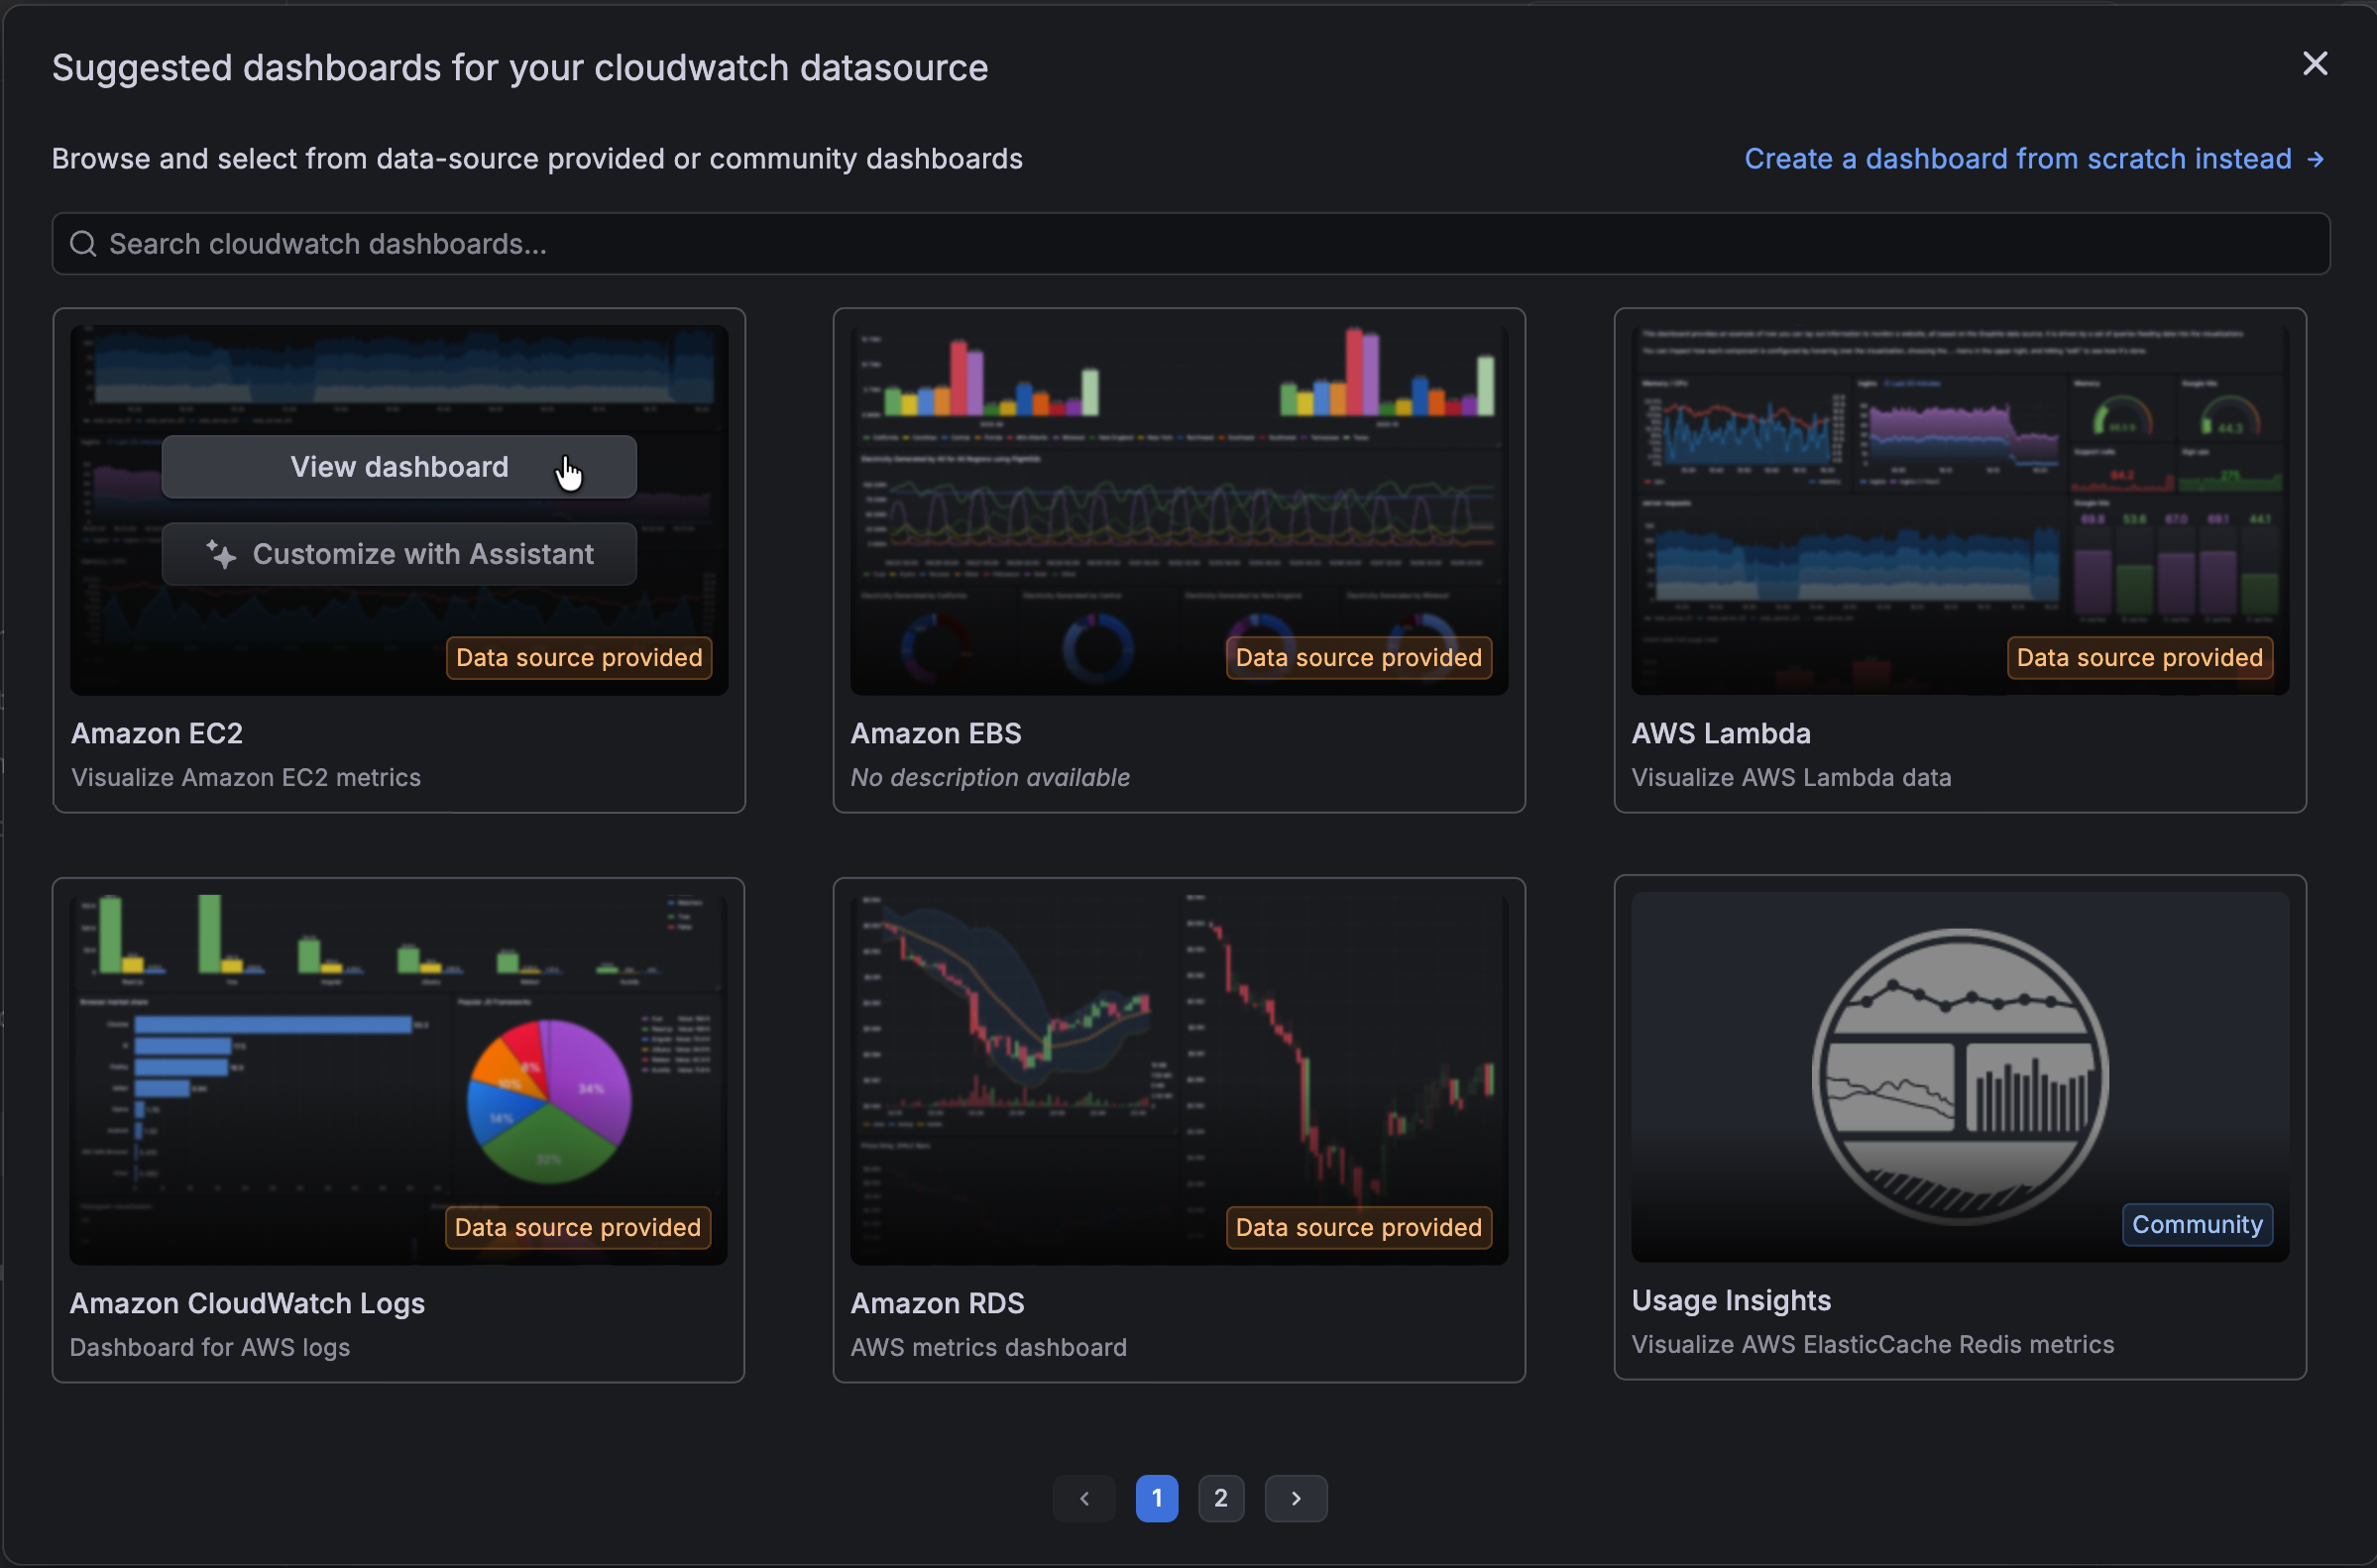
When you click From suggestions, instead of being taken directly to Dashboards, you remain in Data sources and have the option to select a suggestion or still create a dashboard from scratch.
Provisioned suggestions and Community suggestions are no longer divided into tabs, but instead tagged, with provisioned data sources appearing first in the list. If there are more than six suggested dashboards, you can use the page numbers or arrow buttons at the bottom of the dialog box to navigate between pages of suggestions, or use the search to find a specific suggestion:
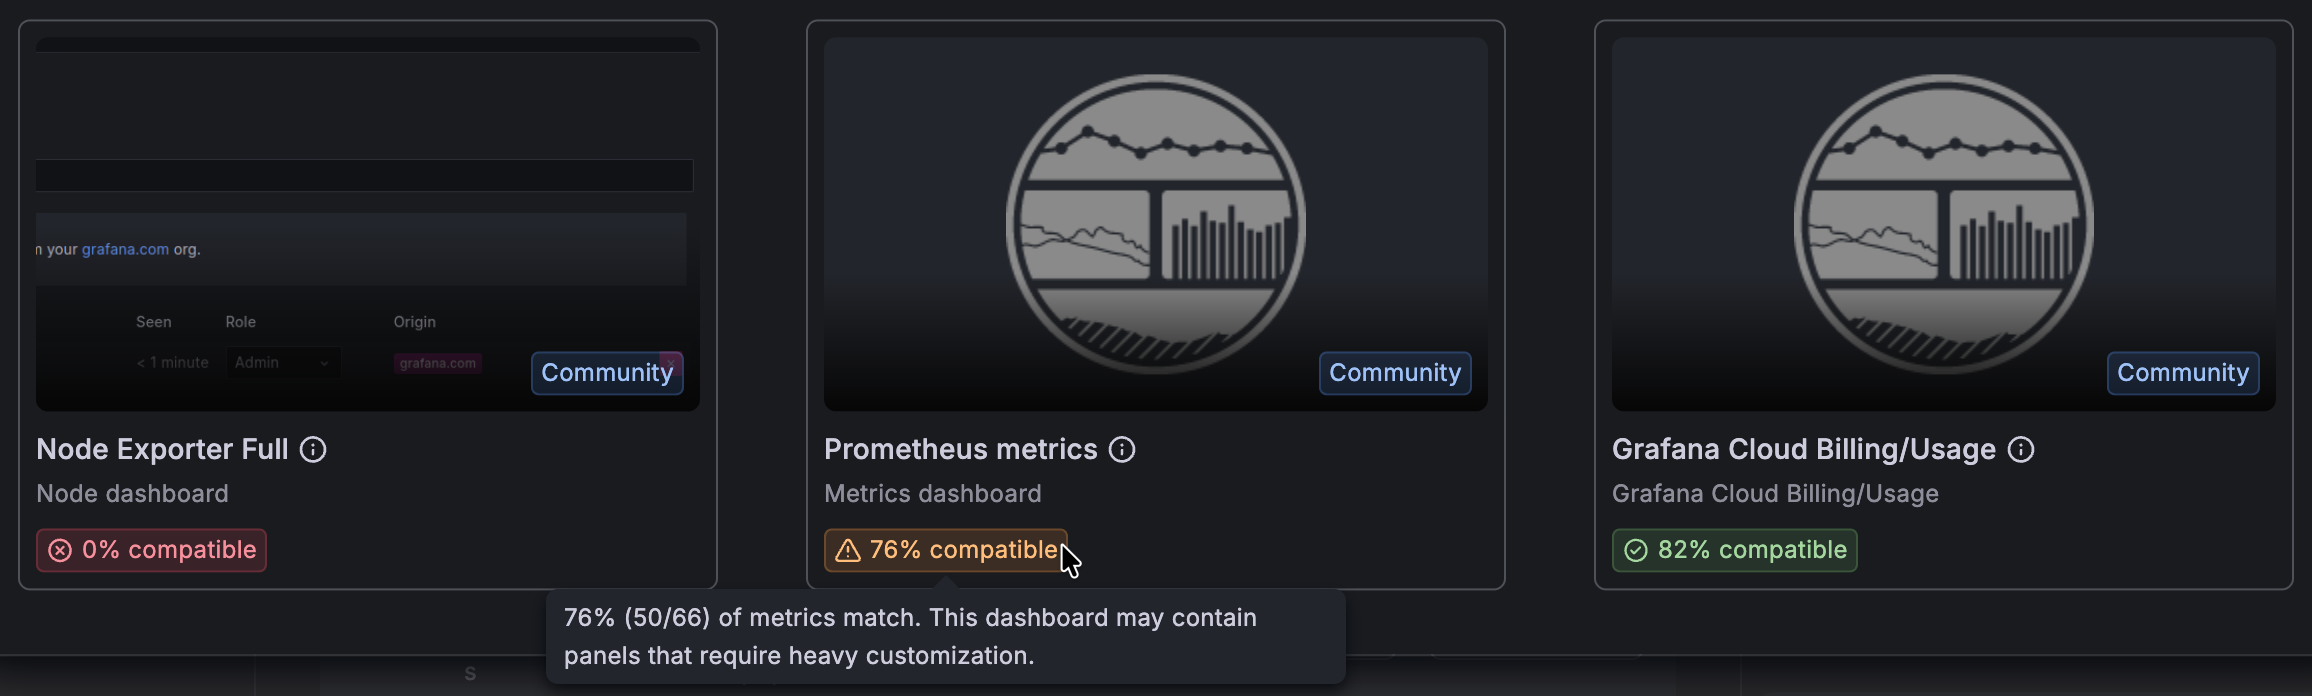
For Prometheus data sources, Grafana compares the metrics of your data source against those of the suggested dashboard to assess how much you might need to update the dashboard to make it useful. Using that analysis, Grafana assigns the dashboard a compatibility score:
Finally, if after viewing the suggested dashboard, you find it doesn’t meet your needs, you can still go back and choose a different suggestion or start a new dashboard by clicking one of the options in the banner:
