Correlate Frontend issues on a Geographic Map
Teams can now quickly spot geographic patterns in performance and errors and drill into the regions driving issues. The new Geolocation tab turns location data into an interactive investigation experience, making it easy to identify hotspots, compare regions, and understand why users are impacted.
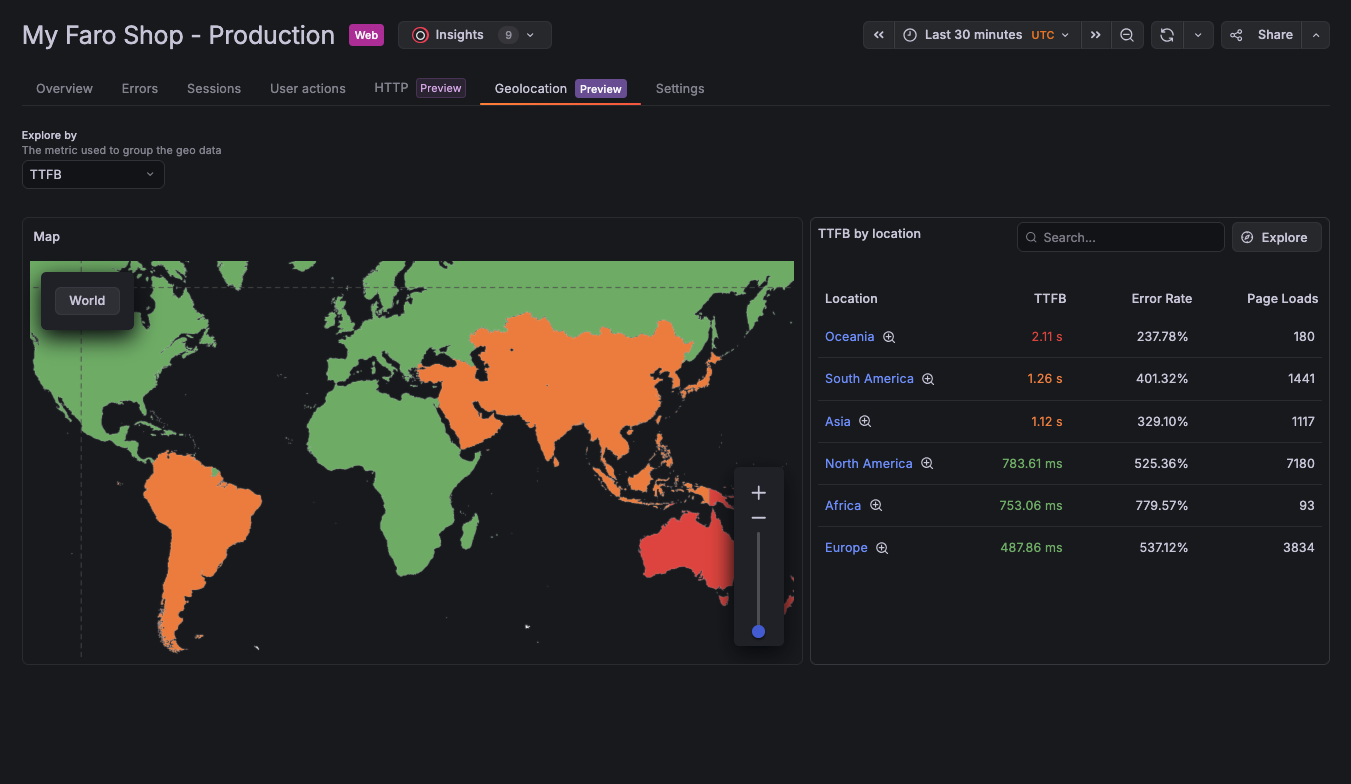
Geographic analysis is now built directly into Frontend Observability, making it easy to validate location-based performance hypotheses without custom queries or additional tools. With the Geolocation tab, geographic context is a first-class way to investigate frontend issues and validate location-based hypotheses.
Core Features:
- Visualize performance and error hotspots on an interactive, color-coded map
- Drill down from global to local regions to isolate problem areas
- Switch between Core Web Vitals and Error Rate to compare by different user experience KPIs
- Jump directly from a region into filtered error or performance views
Use Cases
- Find regions with slow loads or high error rates after a deployment
- Validate CDN placement and regional infrastructure decisions
- Detect localization or network-specific issues during location-based rollouts
- Prioritize performance optimizations based on real user impact by region
To use this Geolocation Map feature, you will need to turn on geolocation for your application. Learn how to get started in our documentation.