Monitor and Troubleshoot Critical Steps in your User Journeys
User Actions is a new capability in Grafana Frontend Observability that helps you track, analyze, and troubleshoot the most important interactions users perform in your web applications.
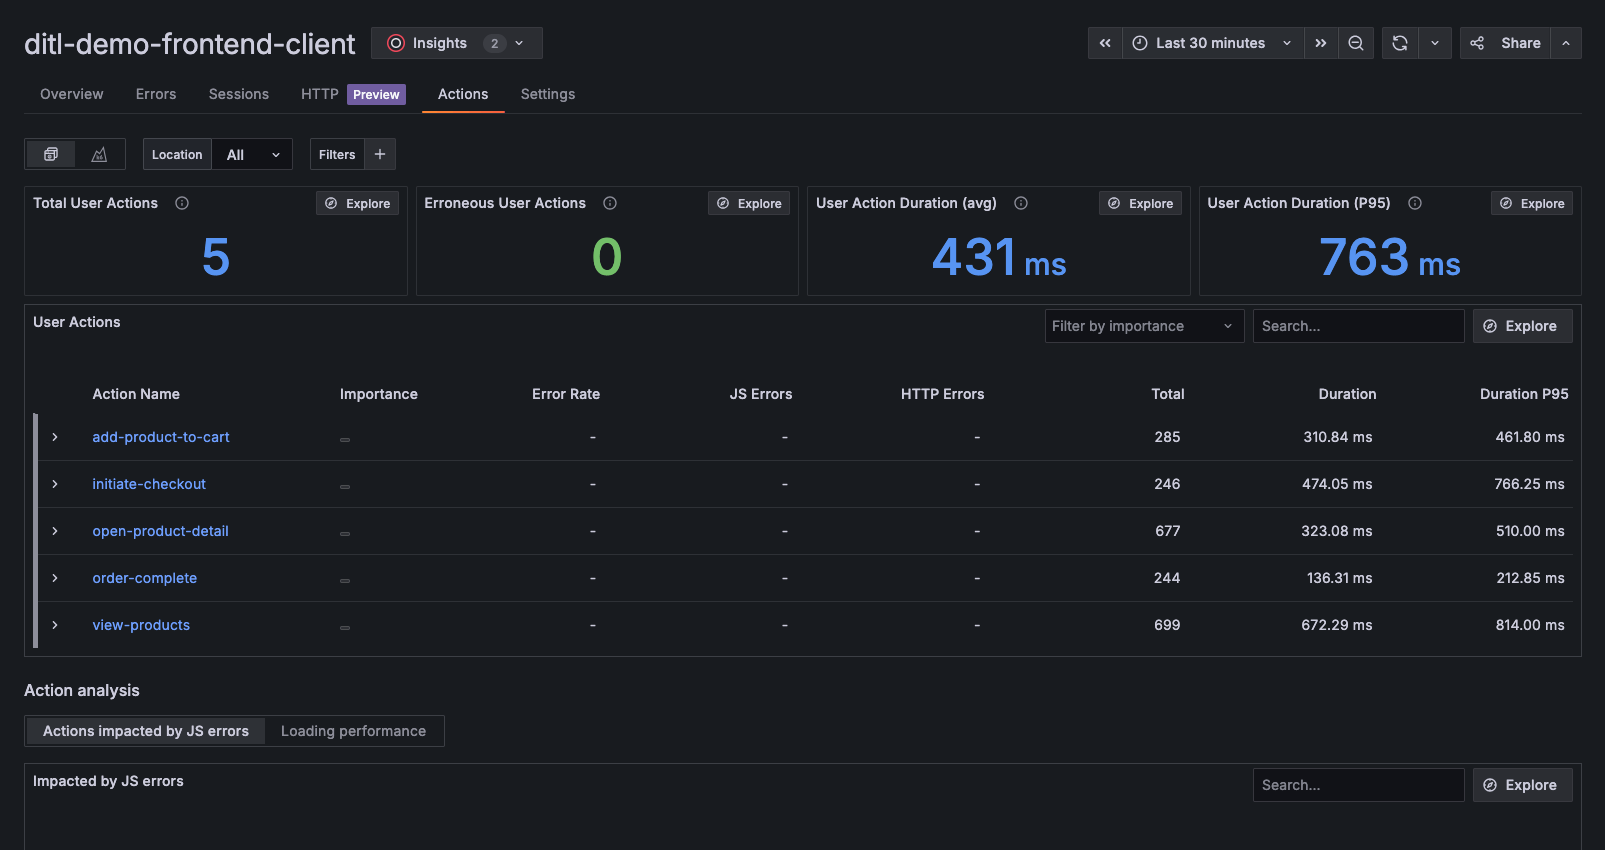
Instead of sifting through raw browser events, you can now explicitly label and monitor meaningful actions—like Checkout, Sign Up, or Search. Grafana automatically displays RED metrics for each action and ties them to related traces, HTTP requests, errors, and sessions. This gives teams a complete, intent-driven view of the user experience from the frontend through the backend.
With User Actions, you can:
- Monitor the health of business-critical workflows by seeing which actions aren’t performing as expected.
- Spot slow or error-prone actions before they impact users
- Drill into traces, sessions, and errors for fast root-cause analysis
- Prioritize work by labeling critical actions to focus on actions that has the most impact on your users and teams
- Triage actions instantly in the RCA workbench to quickly identify any underlying service issues impacting your user
User Actions are tightly integrated into the Frontend Observability overview, the action list, action detail pages, and the Grafana Knowledge Graph. They also enable richer insights across your application’s frontend, network, and backend performance.
Start capturing User Actions today using automatic or manual instrumentation via the Faro Web SDK. Learn how to get started in our documentation.