Introducing Assistant Investigations: now in public preview
We are excited to announce the Public Preview of Grafana Assistant Investigations in Grafana Cloud.
Assistant Investigations gives you a faster path from “what is happening” to “what to do next.” When an incident spans services or signals, you switch the Assistant to Investigation mode, describe the problem, and let specialist agents explore metrics, logs, traces, profiles, and even SQL in parallel. The workflow runs inside Grafana Cloud, respects your permissions, and keeps findings grounded in your telemetry.
What are investigations?
Investigations coordinate multiple agents at once. A lead investigator plans the work while Prometheus, Loki, Tempo, and Pyroscope specialists gather evidence. A reporter compiles results into a structured report you can trust. You get a live activity feed during the run, then a finished artifact with a Summary, a detailed Report, a Timeline, and an Activity log.
The experience is conversational. You steer with plain language, add @ mentions for services or data sources, and correct scope as you learn. Use thumbs up or thumbs down to nudge agents toward the right paths. The more context you provide, the better the result.
Context carries through every step. Discovery-powered infrastructure memories keep service names, dependencies, and label hints current so agents start with the right map. Mentions pull that context into the investigation automatically, which reduces guesswork and keeps the findings aligned with your environment.
You choose when to escalate. Stay in chat for quick checks. Launch an investigation when you need breadth or a durable write-up. Agents fan out across Prometheus, Loki, Tempo, Pyroscope, and SQL data sources, then return a focused narrative you can paste into incident channels or tickets.
Get started with Assistant Investigations
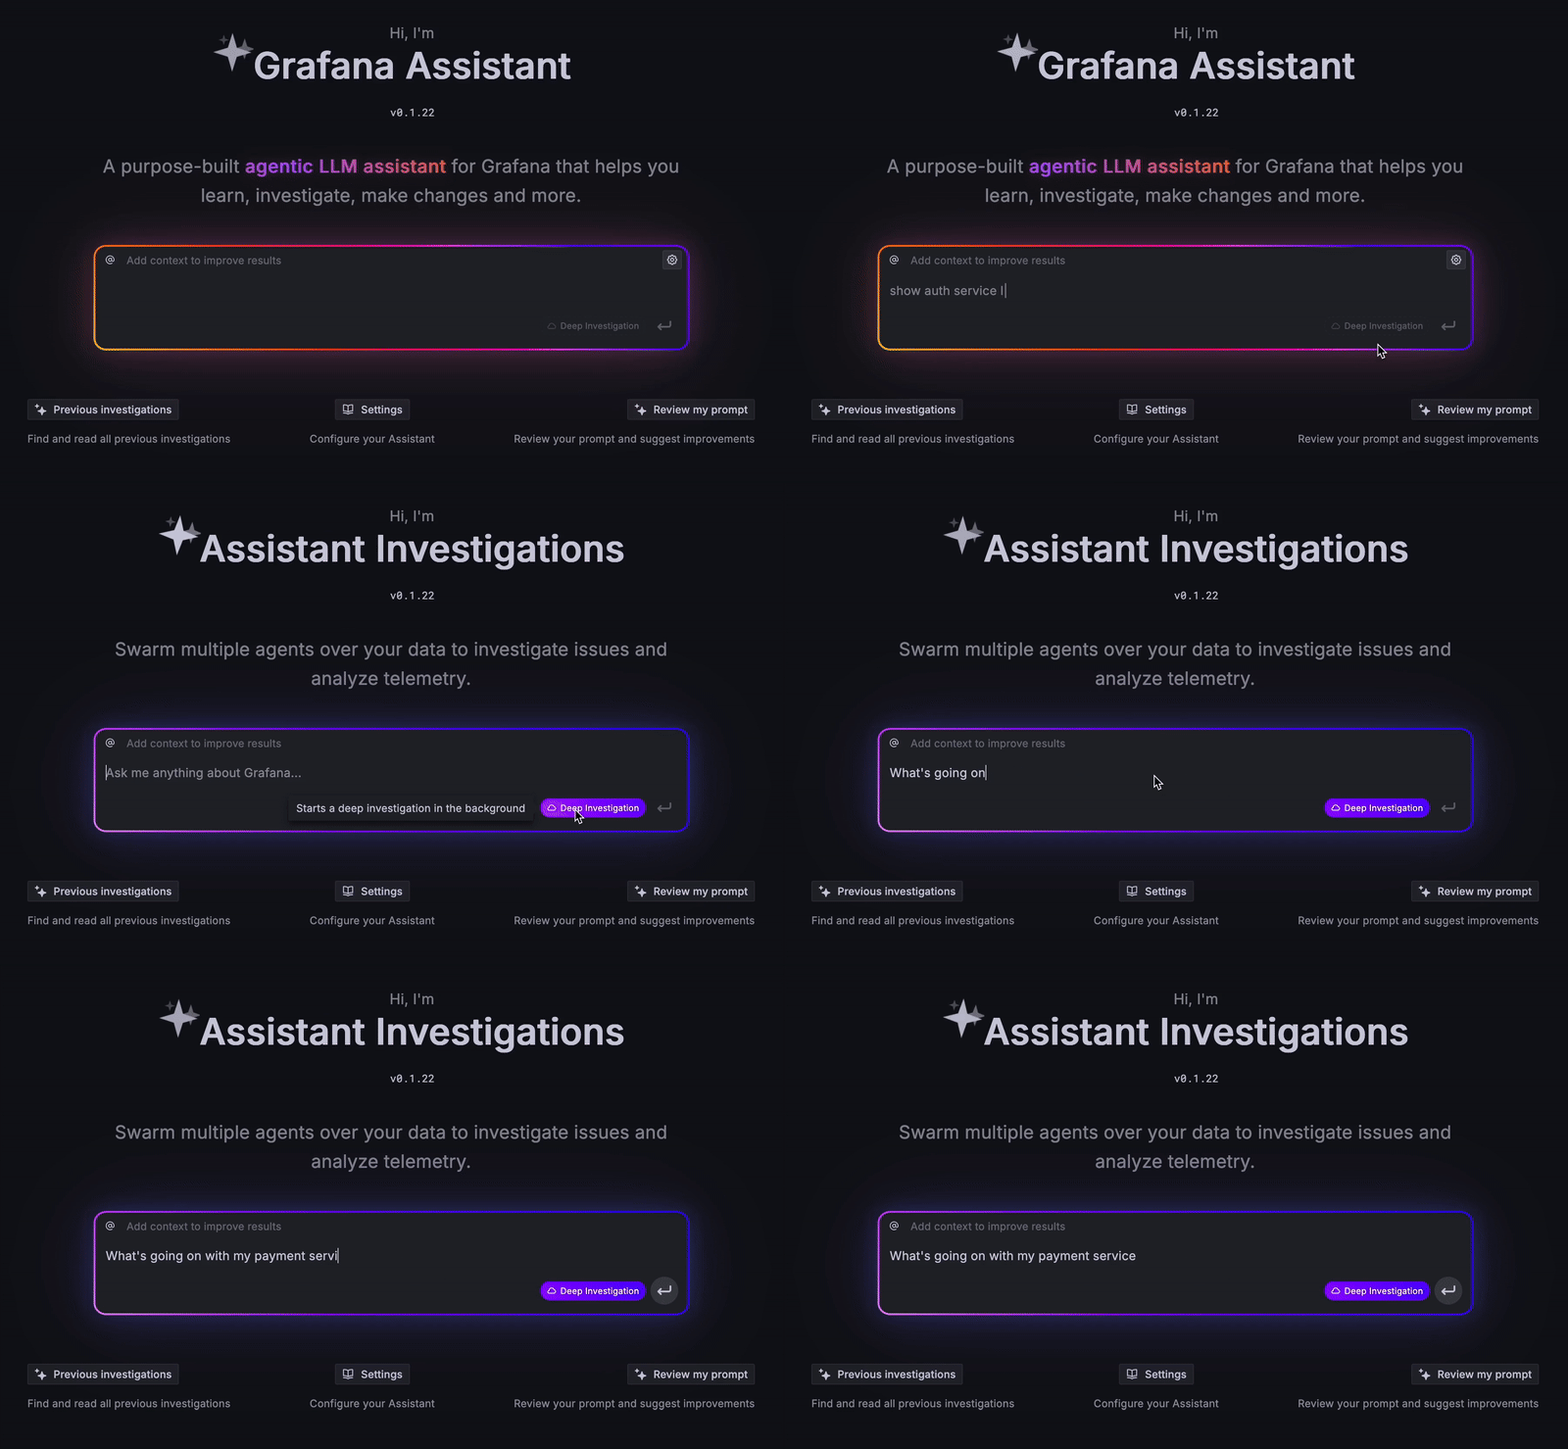
Enable Investigations for your organization, grant the Assistant Investigation User role where needed, then open the Assistant and select Deep Investigation. Describe the symptom, timeframe, and scope. Add @ mentions to anchor data sources or dashboards. You can monitor progress live and request adjustments at any time.

What to try first: pick a recent alert, launch a Deep Investigation, and ask, “Why did checkout latency spike after 17:30?” Watch agents collect evidence, read the Summary, then use the Timeline to brief your team. If the scope changes, add a new hint or mention the service you care about and keep going.
Now in public preview
Security and privacy follow Grafana Cloud standards. The Assistant operates within your existing RBAC, routes calls through Grafana Cloud, and encrypts data in transit and at rest. Your organization’s data is not used to train external models. Sub-processors are configured for zero retention, and usage is logged for auditing and quality.
Assistant Investigations is a public preview. Support is best effort and changes may occur before GA.
The feature is free to use until January 1, 2026, with fair-usage allowances that include a soft limit of 50 investigations per user per month.