Get started with Grafana Alerting - Link alerts to visualizations
This tutorial is a continuation of the Get started with Grafana Alerting - Route alerts using dynamic labels tutorial.
In this tutorial you will learn how to:
- Link alert rules to time series panels for better visualization
- View alert annotations directly on dashboards for better context
- Write Prometheus queries
Before you begin
Interactive learning environment
- Alternatively, you can try out this example in our interactive learning environment. It’s a fully configured environment with all the dependencies already installed.
Grafana OSS
- If you opt to run a Grafana stack locally, ensure you have the following applications installed:
- Docker Compose (included in Docker for Desktop for macOS and Windows)
- Git
- If you opt to run a Grafana stack locally, ensure you have the following applications installed:
Set up the Grafana stack
To observe data using the Grafana stack, download and run the following files.
Clone the tutorial environment repository.
git clone https://github.com/tonypowa/grafana-prometheus-alerting-demo.gitChange to the directory where you cloned the repository:
cd grafana-prometheus-alerting-demoBuild the Grafana stack:
docker compose buildBring up the containers:
docker compose up -dThe first time you run
docker compose up -d, Docker downloads all the necessary resources for the tutorial. This might take a few minutes, depending on your internet connection.
Note
If you already have Grafana, Loki, or Prometheus running on your system, you might see errors, because the Docker image is trying to use ports that your local installations are already using. If this is the case, stop the services, then run the command again.
Use case: monitoring and alerting for system health with Prometheus and Grafana
In this use case, we focus on monitoring the system’s CPU, memory, and disk usage as part of a monitoring setup. The demo app, launches a stack that includes a Python script to simulate metrics, which Grafana collects and visualizes as a time-series visualization.
The script simulates random CPU and memory usage values (10% to 100%) every 10 seconds and exposes them as Prometheus metrics.
Objective
You’ll build a time series visualization to monitor CPU and memory usage, define alert rules with threshold-based conditions, and link those alerts to your dashboards to display real-time annotations when thresholds are breached.
Step 1: Create a visualization to monitor metrics
To keep track of these metrics you can set up a visualization for CPU usage and memory consumption. This will make it easier to see how the system is performing.
The time-series visualization supports alert rules to provide more context in the form of annotations and alert rule state. Follow these steps to create a visualization to monitor the application’s metrics.
Log in to Grafana:
- Navigate to http://localhost:3000, where Grafana should be running.
- Username and password:
admin
Create a time series panel:
- Navigate to Dashboards.
- Click + Create dashboard.
- Click + Add visualization.
- Select Prometheus as the data source (provided with the demo).
- Enter a title for your panel, e.g., CPU and Memory Usage.
Add queries for metrics:
In the query area, copy and paste the following PromQL query:
** switch to Code mode if not already selected **
flask_app_cpu_usage{instance="flask-prod:5000"}Click Run queries.
This query should display the simulated CPU usage data for the prod environment.
Add memory usage query:
Click + Add query.
In the query area, paste the following PromQL query:
flask_app_memory_usage{instance="flask-prod:5000"}
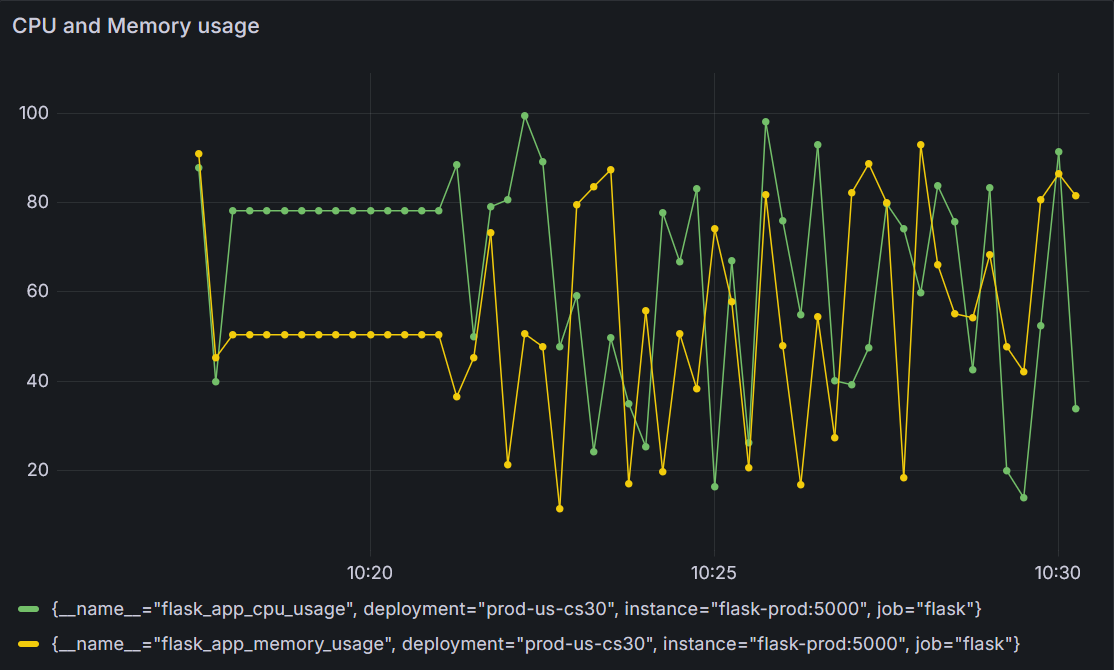
![Time-series panel displaying CPU and memory usage metrics in production. Time-series panel displaying CPU and memory usage metrics in production.]()
Time-series panel displaying CPU and memory usage metrics in production. Click Save dashboard. Name it:
cpu-and-memory-metrics.
We have our time-series panel ready. Feel free to combine metrics with labels such as flask_app_cpu_usage{instance=“flask-staging:5000”}, or other labels like deployment.
Step 2: Create alert rules
Follow these steps to manually create alert rules and link them to a visualization.
Create an alert rule for CPU usage
- Navigate to Alerts & IRM > Alerting > Alert rules from the Grafana sidebar.
- Click + New alert rule rule to create a new alert.
Enter alert rule name
Make it short and descriptive, as this will appear in your alert notification. For instance, cpu-usage .
Define query and alert condition
Select Prometheus data source from the drop-down menu.
In the query section, enter the following query:
** switch to Code mode if not already selected **
flask_app_cpu_usage{instance="flask-prod:5000"}Alert condition
Enter 75 as the value for WHEN QUERY IS ABOVE to set the threshold for the alert.
Click Preview alert rule condition to run the queries.
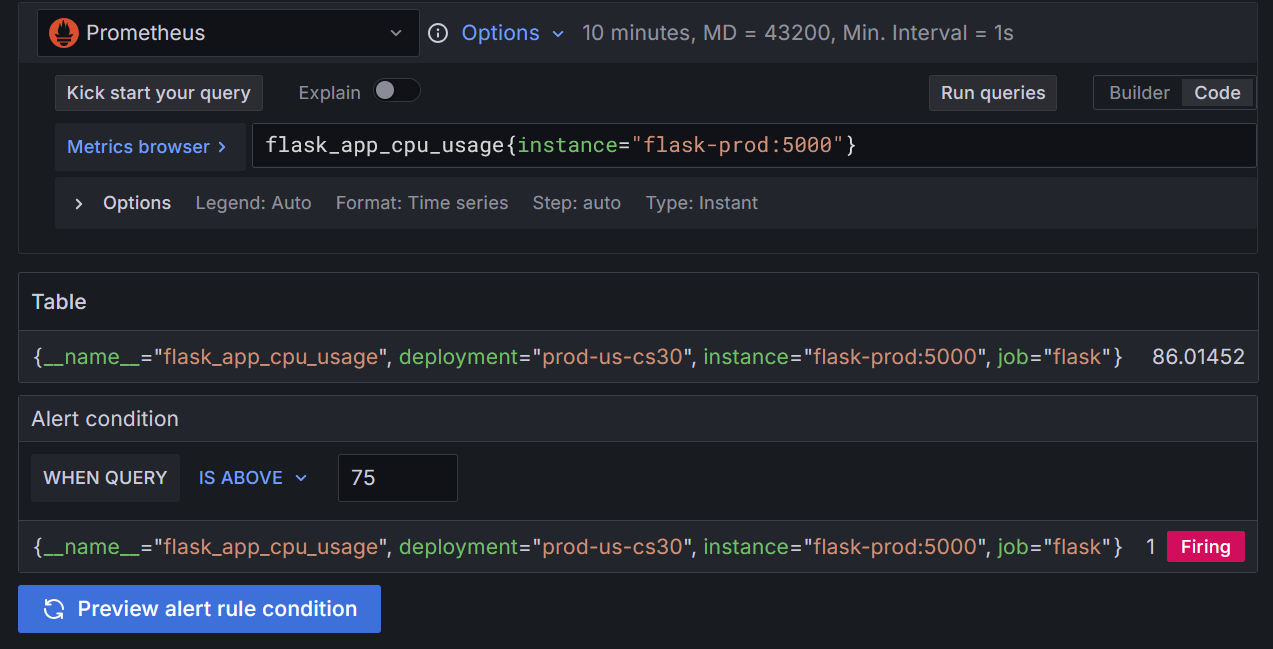
![Preview of a query returning alert instances in Grafana. Preview of a query returning alert instances in Grafana.]()
Preview of a query returning alert instances in Grafana.
The query returns the CPU usage of the Flask application in the production environment. In this case, the usage is
86.01%, which exceeds the configured threshold of75%, causing the alert to fire.
Add folders and labels
- In Folder, click + New folder and enter a name. For example:
system-metrics. This folder contains our alert rules.
Set evaluation behaviour
- Click + New evaluation group. Name it
system-usage. - Choose an Evaluation interval (how often the alert will be evaluated). Choose
1m. - Set the pending period to
0s(None), so the alert rule fires the moment the condition is met (this minimizes the waiting time for the demonstration.). - Set Keep firing for to,
0s, so the alert stops firing immediately after the condition is no longer true.
Configure notifications
Select a Contact point. If you don’t have any contact points, add a Contact point.
For a quick test, you can use a public webhook from webhook.site to capture and inspect alert notifications. If you choose this method, select Webhook from the drop-down menu in contact points.
Configure notification message
To link this alert rule to our visualization click Link dashboard and panel
- Select the folder that contains the dashboard. In this case: system-metrics
- Select the cpu-and-memory-metrics visualization
- Click confirm
You have successfully linked this alert rule to your visualization!
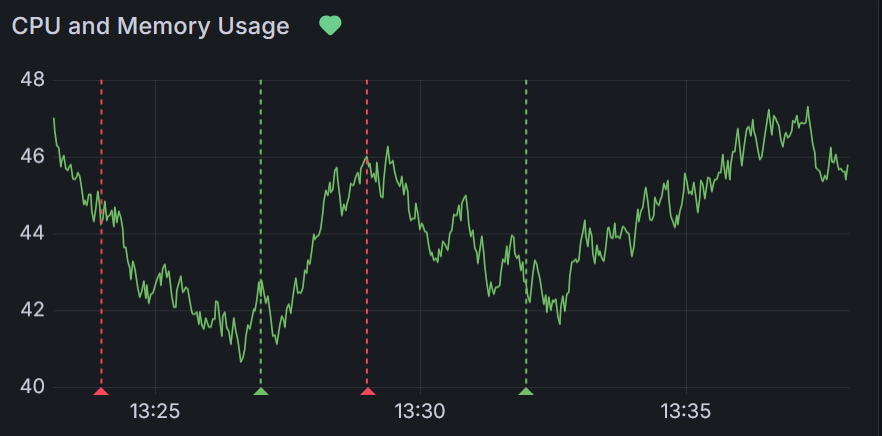
When the CPU usage exceeds the defined threshold, an annotation should appear on the graph to mark the event. Similarly, when the alert is resolved, another annotation is added to indicate the moment it returned to normal.
Try adding a second alert rule using the memory usage metric (flask_app_memory_usage{instance="flask-prod:5000"}) to see how combining multiple alerts can enhance your dashboard.
Check how your dashboard looks now that your alert has been linked to your dashboard panel.
Step 3: Visualizing metrics and alert annotations
After the alert rules are linked to visualization, they should appear as health indicators (colored heart icons: a red heart when the alert is in Alerting state, and a green heart when in Normal state) on the linked panel. In addition, annotations provide helpful context, such as the time the alert was triggered.

Step 4: Receiving notifications
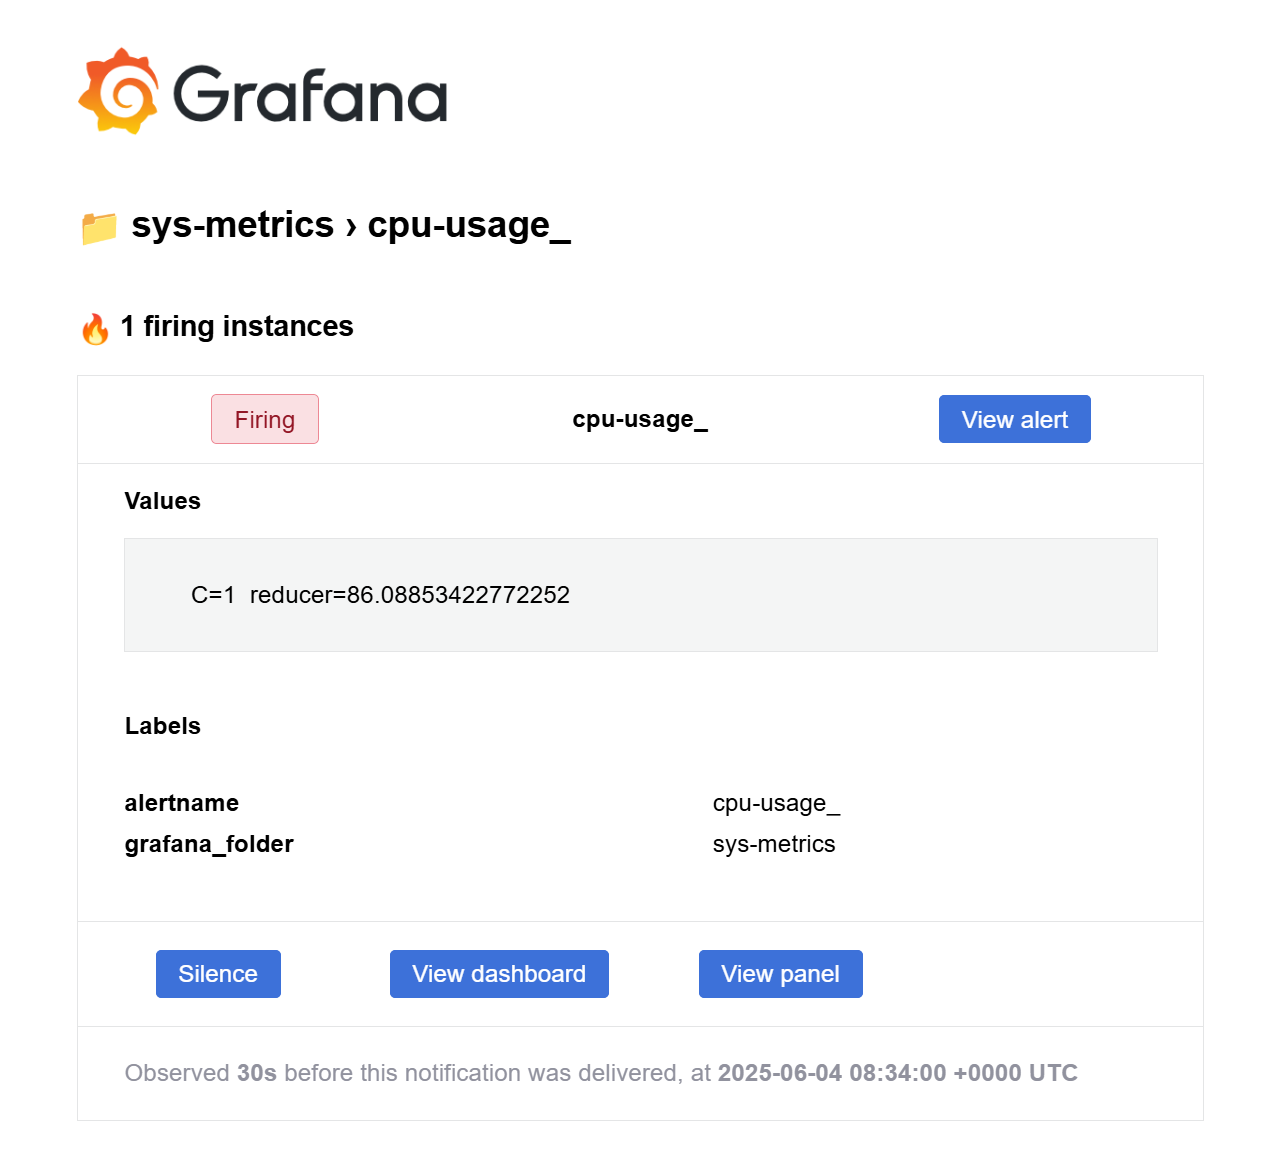
Finally, as part of the alerting process, you should receive notifications at the associated contact point. If you’re receiving alerts via email, the default email template will include two buttons:
View dashboard: links to the dashboard that contains the alerting panel
View panel: links directly to the individual panel where the alert was triggered

Clicking either button opens Grafana with a pre-applied time range relevant to the alert.
By default, this URL includes from and to query parameters that reflect the time window around the alert event (one hour before and after the alert). This helps you land directly in the time window where the alert occurred, making it easier to analyze what happened.
If you want to define a more intentional time range, you can customize your notifications using a notification template. With a template, you can explicitly set from and to values for more precise control over what users see when they follow the dashboard link. The final URL is constructed using a custom annotation (e.g., MyDashboardURL) along with the from and to parameters, which are calculated in the notification template.
Conclusion
You’ve now linked Prometheus-based alert rules to your Grafana visualizations, giving your dashboards real-time context with alert annotations and health indicators. By visualizing alerts alongside metrics, responders can quickly understand what’s happening and when. You also saw how alert notifications can include direct links to the affected dashboard or panel, helping teams jump straight into the right time window for faster troubleshooting.
Have feedback or ideas to improve this tutorial? Let us know.

