How Energinet uses Grafana Enterprise to monitor underwater electricity cables — and solve mysteries
In the waters surrounding Denmark, there are separate yet equally important systems in play: cables that carry electricity between other countries, and vessels including cargo ships, tankers, and local and foreign fishing boats . . . that occasionally damage the cables with their anchors and fishing tools. At Energinet, Denmark’s national transmission system operator for electricity, a team is dedicated to making sure everything runs smoothly. At times, they act as detectives to investigate cable faults and what — or who — caused them. This is the story of how they found the right tool to do it. [Dun-dun]
Energinet is an independent public enterprise owned by the Danish Ministry of Climate, Energy, and Utilities. The company maintains high-voltage substations and cables that run through the North Sea, the Baltic Sea, and The Skagerrak, a strait between Denmark, Sweden, and Norway. The cables also reach Germany and the Netherlands; a 750km cable (more than 460 miles) cable to the UK is under construction. Its main purpose is to maintain the security of the country’s energy supply, incorporate more renewable energy, and ensure equal market access to the grids.
Dealing with underwater cables has its challenges, considering everything has to be monitored remotely. For that reason, staying on top of data to ensure everything is functioning is critical for Energinet’s Asset Preparedness team, both in terms of being aware of issues and knowing their cause. After all, if any of the systems go down, the company’s revenue goes down with it. “We have a lot of interest in protecting our assets and providing evidence if someone is damaging cables,” says Henrik Roland Hansen, an electrical engineer in the Energinet’s Asset Preparedness department. “Repairs not only cost a lot of money, but they also mean lost revenue.”
Hansen works with a team responsible for managing and correcting faults in the system and keeping outages as short as possible. Since early 2022, one monitoring tool has helped Energinet accomplish that: Grafana Enterprise.
“Grafana has helped us get insights into the data in a much faster and smoother way than we were able to do it before,” Hansen explains. Being able to set up alerts as well as unique monitoring solutions to fit the company’s specific needs — such as map-filled dashboards or metrics, logs, and traces directly from cables and high voltage substations and components — he adds, “has brought us closer to our equipment. And now, with Grafana, we find ourselves more digitized than we’ve been in our evolution.”
Limited toolbox
Back in 2010, while Hansen was working as a team leader for the cable asset management team, he realized the company had some holes in its knowledge about cable faults. Part of that was due to what he called “the limited toolbox” that was available for his team. At the time, they were using remote desktops and/or web-based applications to access OT equipment and the SCADA (supervisory control and data acquisition) system HMI, with limited possibilities to do reporting and analysis.
Knowing the location of vessels in relation to cables is also a big part of his team’s job. If a vessel travels inside a protective cable zone, the risk of damage increases. And if a cable is damaged, being able to see which vessel was nearby can help find the culprit. The market for Automatic Identification System (AIS) monitoring — a short-range coastal tracking system used to keep tabs on vessel locations — was limited back then, so Hansen tried developing an internal solution using Google Earth and Delphi software. However, Google’s proprietary restrictions made it impossible. He developed a new solution with Energinet’s WebGis department, but it wasn’t scalable enough. “The amount of data we’re generating from the Danish vessel monitoring is so huge that the web GIS solution we had in place at the time broke down and was simply too slow,” he says.
As a quick fix for their general monitoring of high voltage substation events and analog data, Hansen’s team used Excel to collect data from the SCADA system, but that, too, was an imperfect solution (with a less-than-ideal user interface). One of the biggest issues? “We were not able to centralize the data,” Hansen recalls, “so the spreadsheet was only able to collect data from the SCADA system.” And that system itself was limited, leaving the team unable to monitor data from several components or substations at the same tables or curves. There were also weren’t many tables and graphs available, and the team could not build specific dashboards on the fly. “We needed the SCADA engineer to develop the dashboard, which was futile.”
On top of that, their Excel “dashboards” weren’t living documents, so Hansen says implementing version changes and sharing them between team members was “impossible” and “a nightmare.” For one thing, he recalls, “The same aggregations made from different colleagues could produce different results.” Every time someone made a change, the spreadsheet would need to be re-shared to make sure the other 30 people on the team had the most current info. “It was awful,” Hansen says. “We really needed a managed, centralized approach to work with our data.”
Finding the solution
Hansen was introduced to Grafana by his manager, who had been using it on a home automation project, then began using Grafana OSS to visualize his own home automation, too. “Grafana grows on you,” he says. “I fell in love.”
Given the issues Energinet was having with central data and analysis, he decided to try out Grafana on one of the company’s on-premises servers, where he could connect to the SCADA historical database and other systems. “One of the biggest ‘aha’ moments for our colleagues came when they realized there was no need to set up curves or tables themselves in an excel spreadsheet,” Hansen recalls. “Selecting the time period and filtering data was so much easier, too. And now we can make specific aggregated SQL queries to our historical SCADA data without making special versions of the Excel document.”
Before fully committing to Grafana, however, Hansen’s team tried other solutions, including Microsoft Power BI. “Not many colleagues have time or knowledge to design their own Power BI reports,” he explains. “And a lot of other limiting factors made Power BI not the most suitable tool for handling time series data and engineering analysis.”
Grafana quickly became the obvious choice for Energinet for several reasons. To begin with, Hansen said, “It was easier to set up and a lot more intuitive.” Team members didn’t need to have any special training or expertise to use it, either. This was especially helpful because Energinet uses InfluxDB for some types of monitoring (vessels, pressure, lightning strikes, and more), and queries in Grafana don’t require knowledge of SQL. “They can just push some buttons, see some dropdowns, and then they can select one,” Hansen says. “People actually wanted to work with it.” (That included the “old school technicians,” he adds.)
The new system cut down on query times, too.
Before, it could take someone in our department, for instance, from half an hour to several hours to make a query and create a graphic with the data, depending on how complicated the information was that they needed. Now, with Grafana, we just load the dashboard, then load the data. Even if we don’t have the right dashboard in place already, it takes only a few minutes to set something new up that can do the visualization isolation that they need.
Henrik Roland Hansen, Electrical Engineer, Asset Preparedness Department, Energinet
Gone are the days of updating and copying spreadsheets to share with others, and there’s also no more wasting time on creating a report that is inadvertently similar to one that already exists. Having access to real-time data — and working with standardized dashboards and trend alerting — ensures that the quality of reports are better. “When a report is bad, there might be wrong decisions. Not being able to get any information could lead to millions of euros lost, along with environmental or reputation damages.”
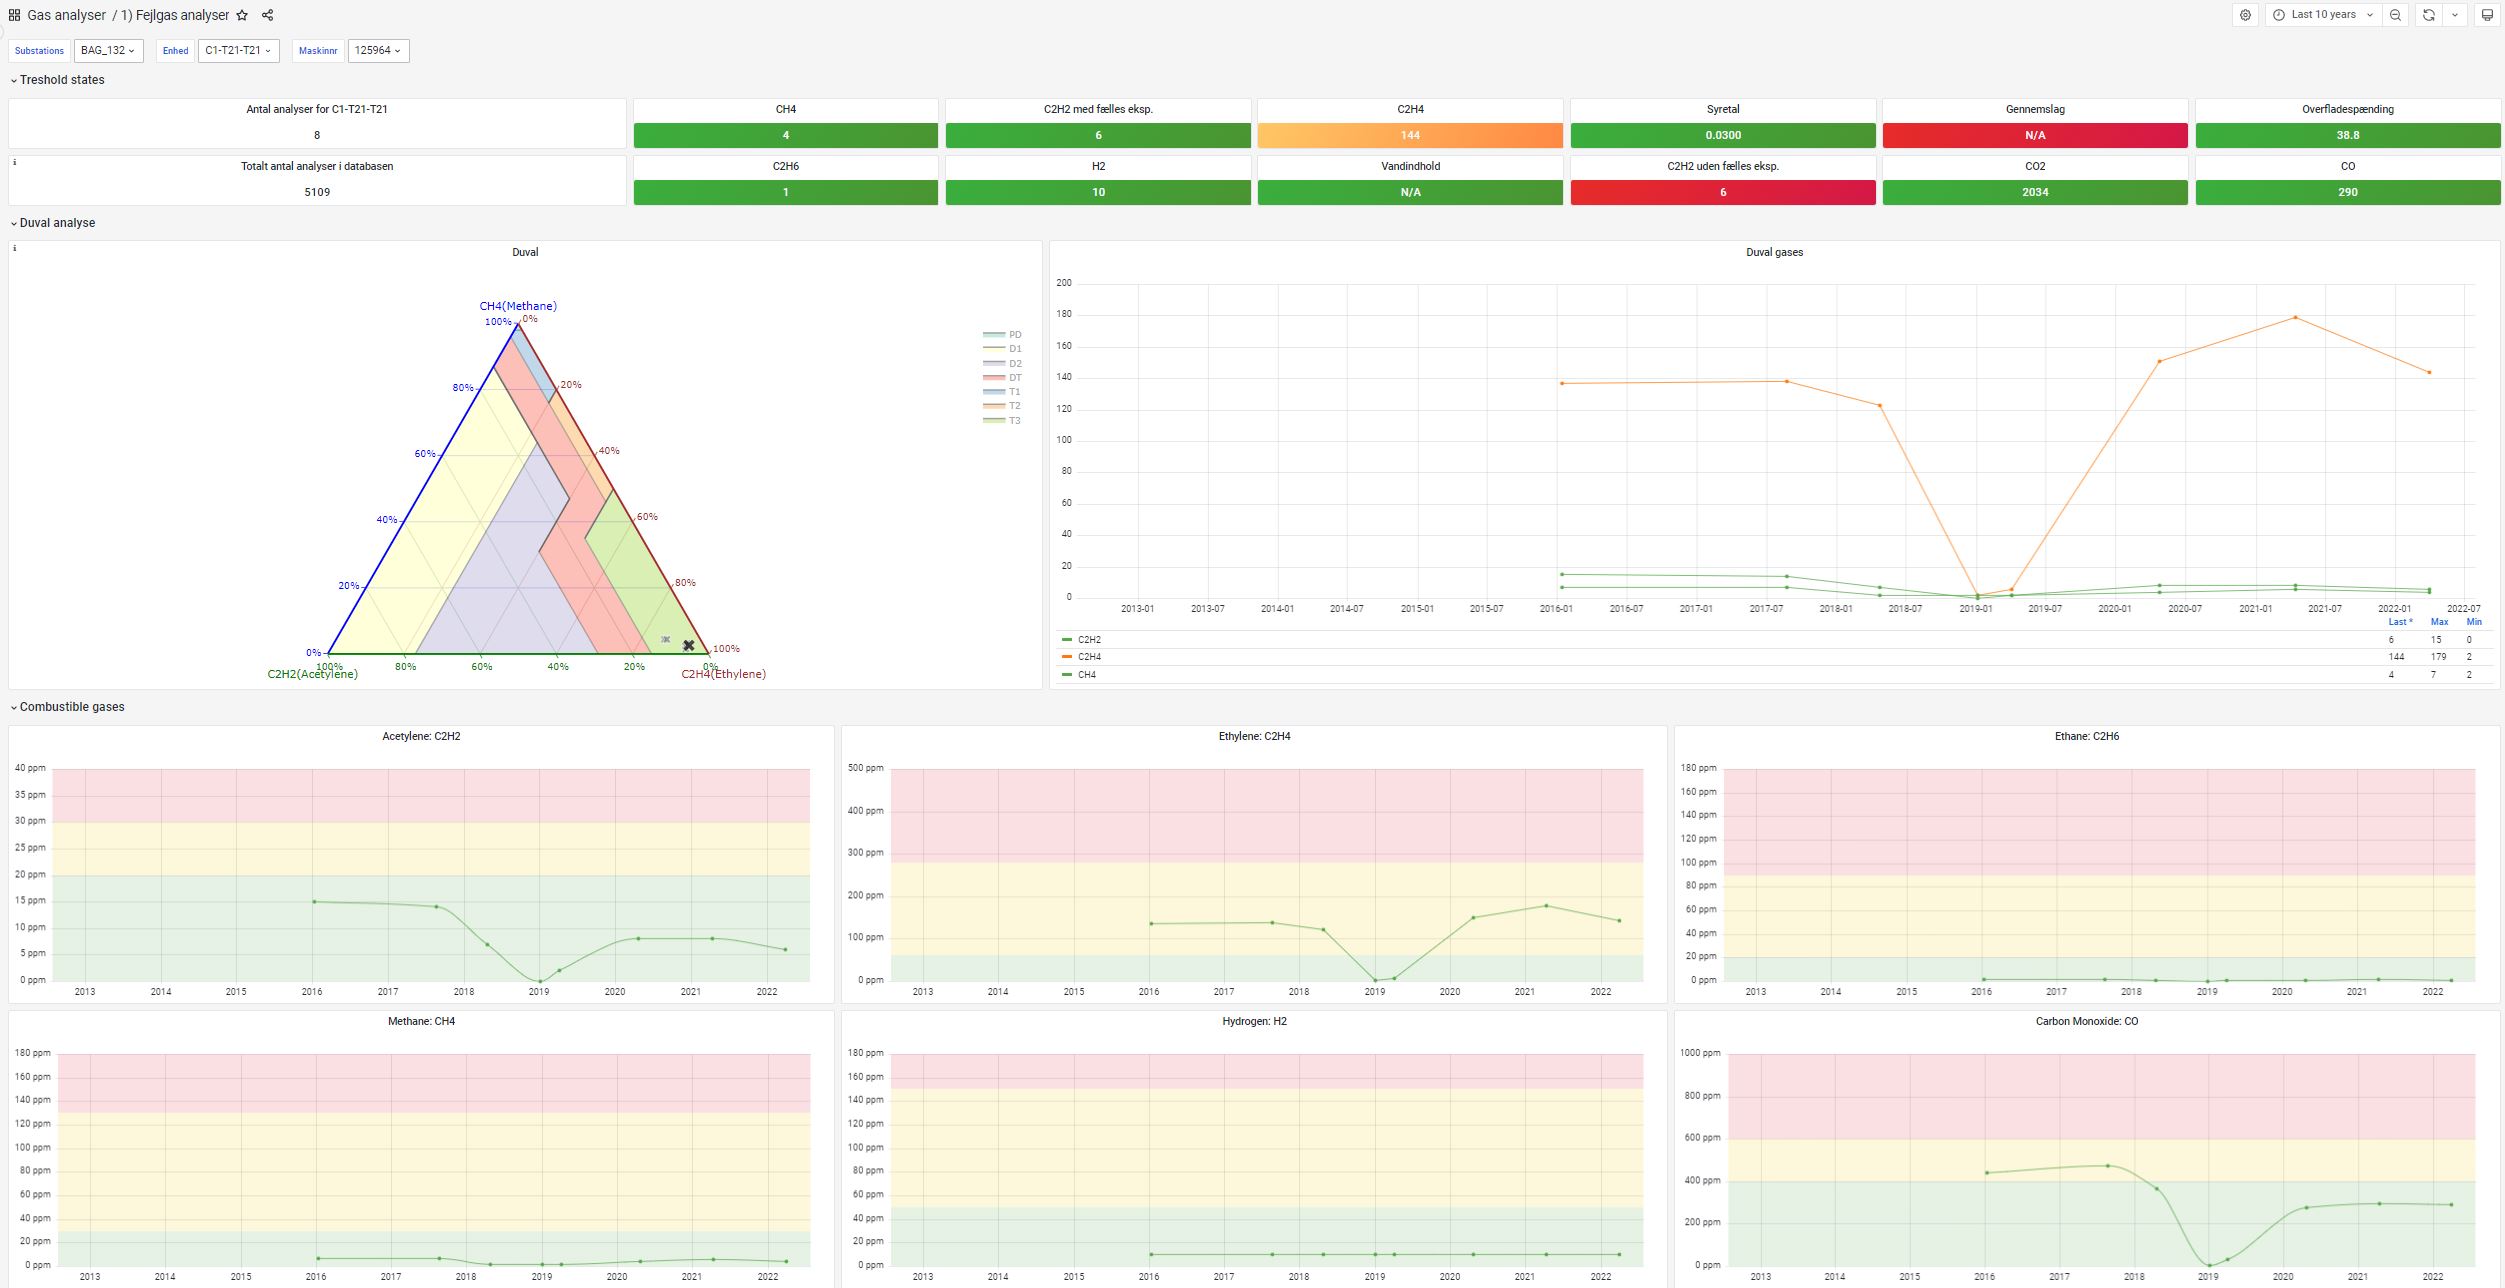
And the list of benefits for Energinet goes on. “Grafana makes it possible to quickly share dashboards between teams, supports many different databases, and is able to do real-time streaming,” he says. “Grafana even allows us to quickly design and deploy special visualizations of engineering tools, like the Duval Triangle.”
Thanks to Grafana’s alerting capabilities, Hansen says it’s made his team better able to detect issues before they become major problems and control the situation. “We’ve located leakages on oil cables because we’ve seen in Grafana that an oil tank level was dropping fast,” he recalls. In one case, he adds, “We actually stopped the leakage on one cable system before it ended with a short circuit, minimizing the oil pollution to the sea.” That never would have been possible if they were still using spreadsheets. “You don’t make alarms in a spreadsheet,” he notes.
Dashboards and detective work
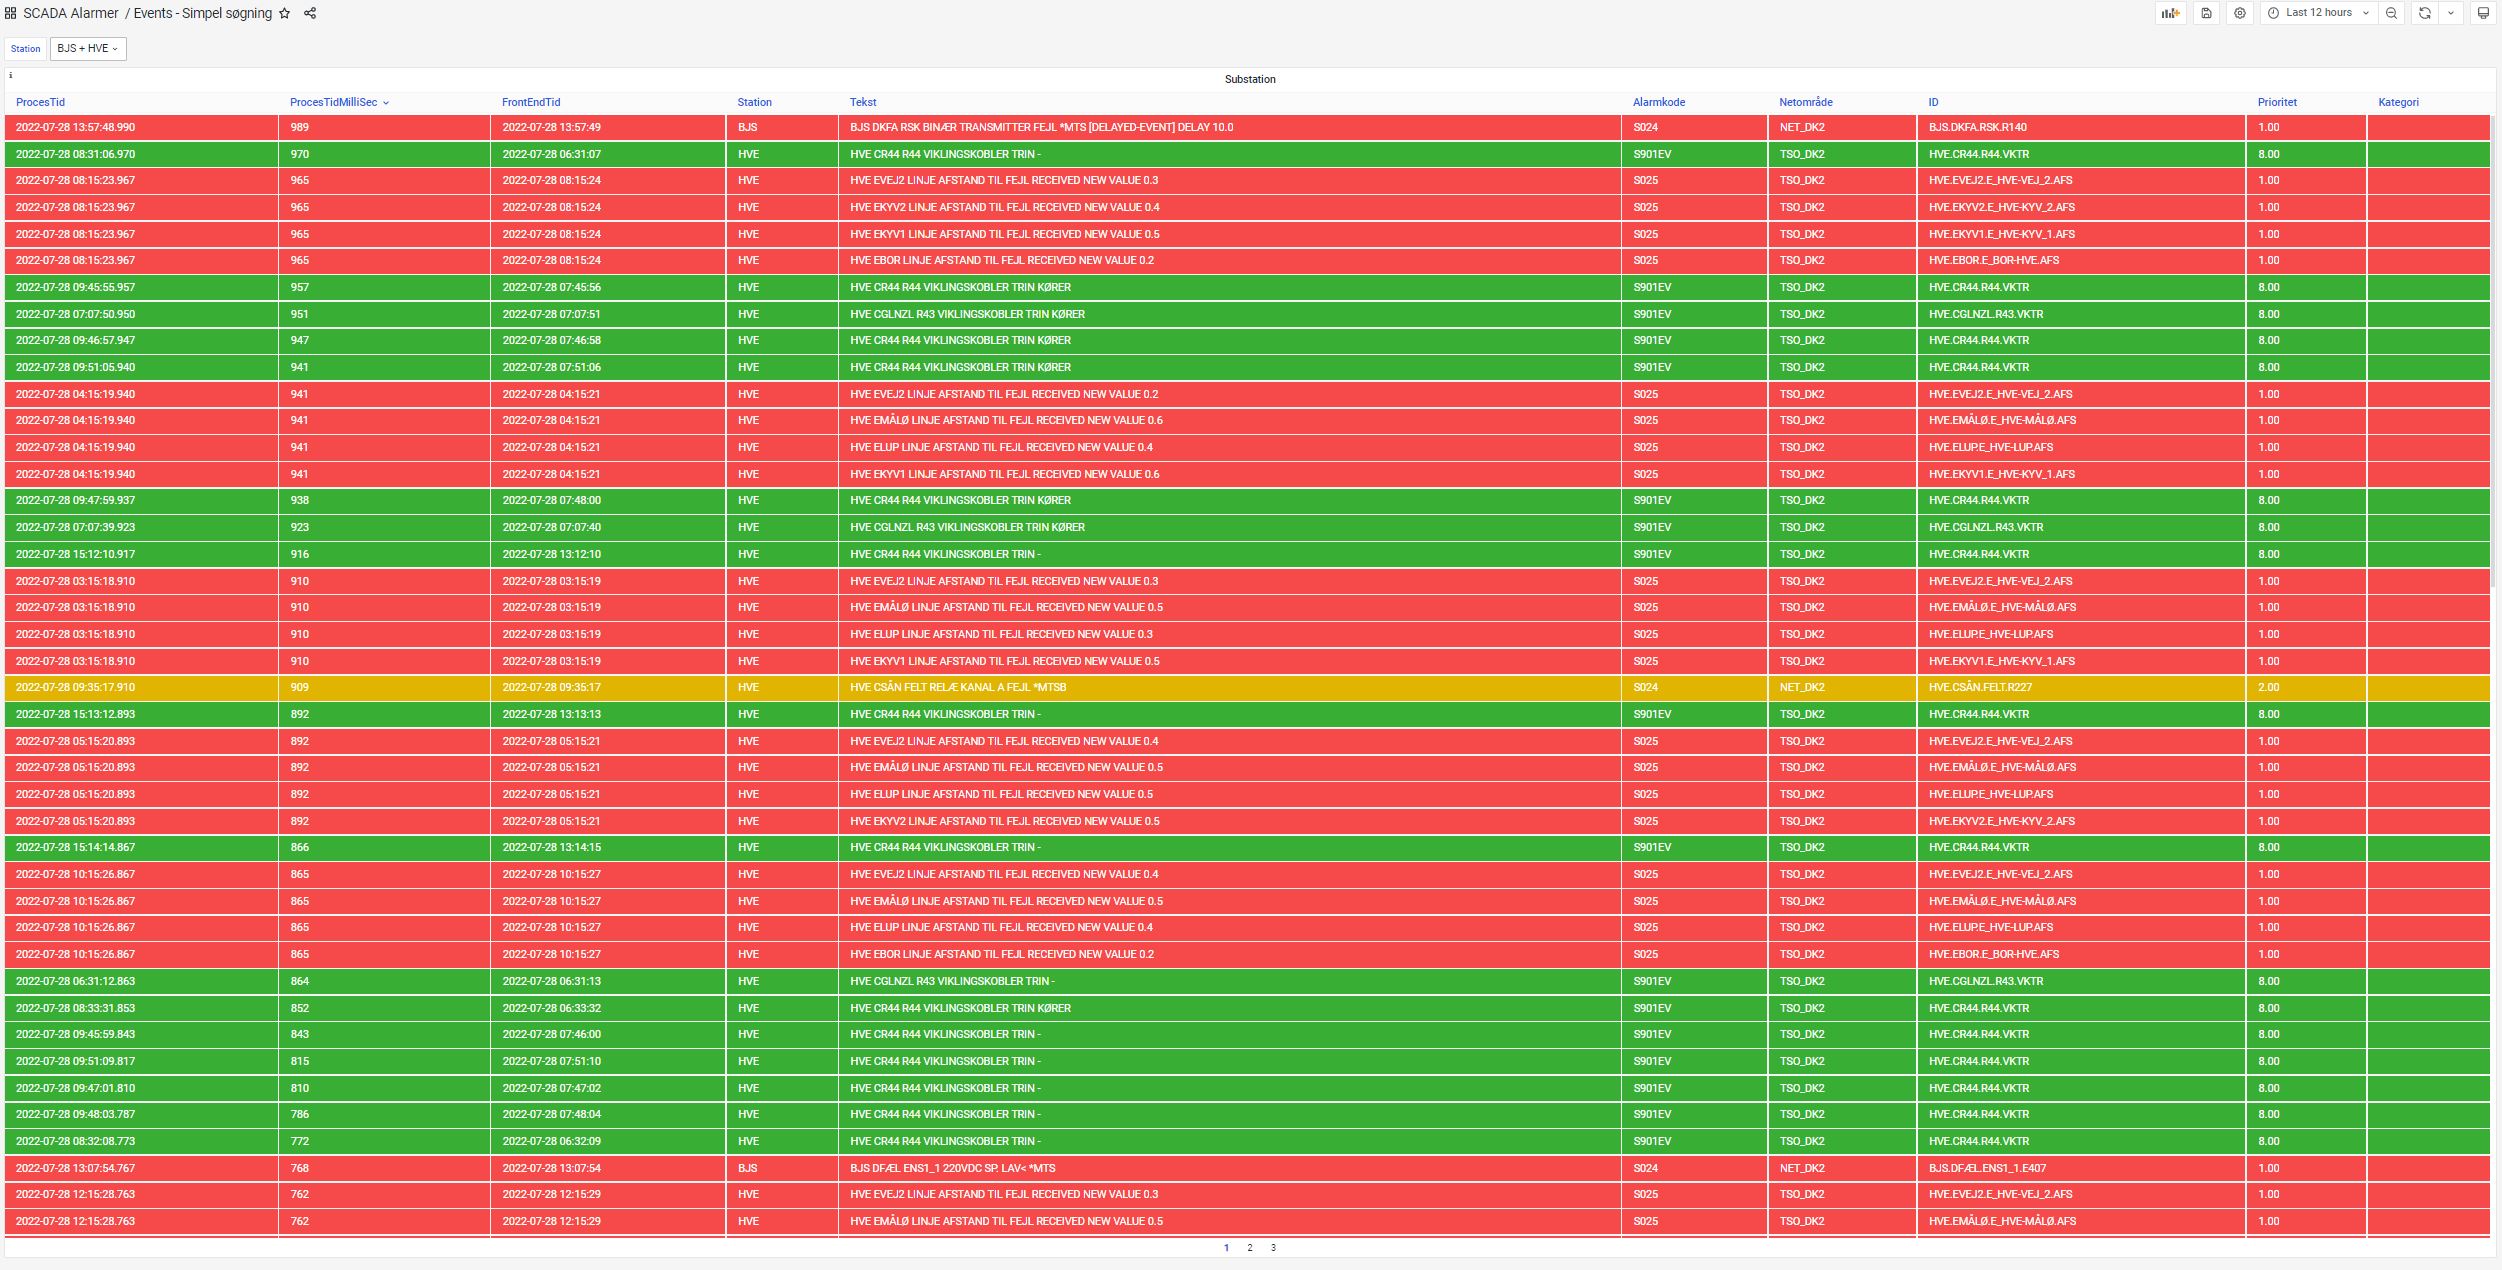
In Grafana dashboards, Energinet monitors data from about 10 to 15 different sources including SCADA, the Danish Meteorological Institute (for lightning strikes on overhead lines), AIS vessel monitoring, and a contractor measuring the content in Energinet’s transformers and reactors. The dashboard also contains alerts on special metrics like leakages on high voltage switchgear. “The power of this is that now all the data we need for operations, asset conditioning, and risk management is available in one centrally managed platform instead of hundreds,” Hansen says. He notes that never would have been possible with some of the other solutions they tested. He also realized Grafana was improving the way his team did their jobs. “It was actually helping us to better analyze and do deep dives into the electrical information we needed from our control system.”
Having all of their data in one place also means Energinet can be more proactive in terms of avoiding problems. “We have cases where we find trends that are moving towards failure that we can stop or handle before they end in a major incident,” Hansen says. “We’ve also gotten better at managing the risk to cables that are vulnerable due to intense fishing, and finding potential anchoring vessels before they might pull in the anchor and damage the cables, which could take one to six months to repair.”
Another perk of using the Grafana dashboard is being able to compare data in one place and gain important — and even instant — insights. For example, Hansen’s team can measure the voltage from their SCADA system and combine it with SAP data (assets, maintenance, substation readings and more), and make an annotation where there was a planned or unplanned outage. “It makes it easier for people to understand why we had an outage in the system,” he says.
Grafana’s geomap panel is one of Hansen’s favorite features on Energinet’s dashboard. “It’s perfect for what we want to do,” he says. “I’ve built it showing cables and protection zones.” When Energinet is alerted to a cable fault — also in the dashboard — Hansen’s team begins their detective work. By analyzing the data they are monitoring with Grafana, they can determine if the fault was caused by something internal or if a third party is responsible for the damage. That happens when a vessel hits a cable with its anchor or fishing tools.

“Sometimes we just don’t get the information straightaway, so we have to combine a lot of information to get the evidence that a specific vessel did the damage on the cable,” Hansen says. His team can pinpoint vessels’ locations and cross-reference that with historical data about a location. (And if it’s still anchoring inside the cable zone, that’s good to know: “We can minimize the risk of it taking off with the anchor and pulling the cable.”)
Hansen recalls a specific incident in February 2022, when his boss called him one morning and asked him to check if there was a vessel close to the connections going between Sweden and the island of Bornholm at the time of fault. Hansen quickly logged on to Grafana to check what was happening. “I’ve always set up my dashboard so I could see all the vessel traffic,” he says. “I was looking at the data, and with the historical data, I could see one vessel was about 200 meters past one of the cables. I said, ‘This is the guy.’ " Shortly after that, Hansen received a call from the authorities, asking if he’d seen anything in his monitoring because they were looking for the culprit, too. “He told me it was a vessel from the Netherlands, but I could see it was a vessel from another country. I gave him the vessel’s Maritime Mobile Service Identity (MMSI), and then we hung up.” A few hours later, the authorities came back to Energinet with photos of the vessel. “They were pulling up the anchor, which had been bent after it hit the cable and dragged along the seabed. Luckily he didn’t hit anything else — at least not to our knowledge.”
Over the years, Hansen’s team has been able to catch several anchor draggers and fishing vessels that have hit and damaged the cables. The offenders have been found liable and had to pay for the damages, which could cost several millions.
But Energinet isn’t only concerned about what’s happening in or on the water. The company can use Grafana to pinpoint problems in its own control rooms, where switching operators increase voltage on reactors in their system when necessary. “Some people may not be that good at controlling the voltage, so they switch them a lot or not enough,” Hansen explains.
“You can actually see that one guy was switching a lot and the other guys were not.” Rather than simply placing blame, it leads to questions such as, “Why was he doing this? Was he not trained enough?” As a result, the company can improve employee performance.
Because Grafana is so easy to use, anyone on Hansen’s team can be involved in monitoring. “If I’m not working, someone else can look up the information or even set up a new dashboard — it’s quite easy.”
Bonus benefits
Hansen’s team has improved its planning abilities since they adopted Grafana as their monitoring tool. Now they can plan outages, or keep track of how much petrol is in the tanks on an offshore platform. “We are operating wind turbine offshore platforms, so when we lose connection to the land, we need to start up the generators,” he says. If the generators use up all of their petrol, they have to send out a ship — which can be a complicated endeavor. “We can now plan it much more precisely and in accordance with the weather,” he explains, “as sometimes you can’t pull out a hose or even a tank on offshore transformer platforms due to high waves.”
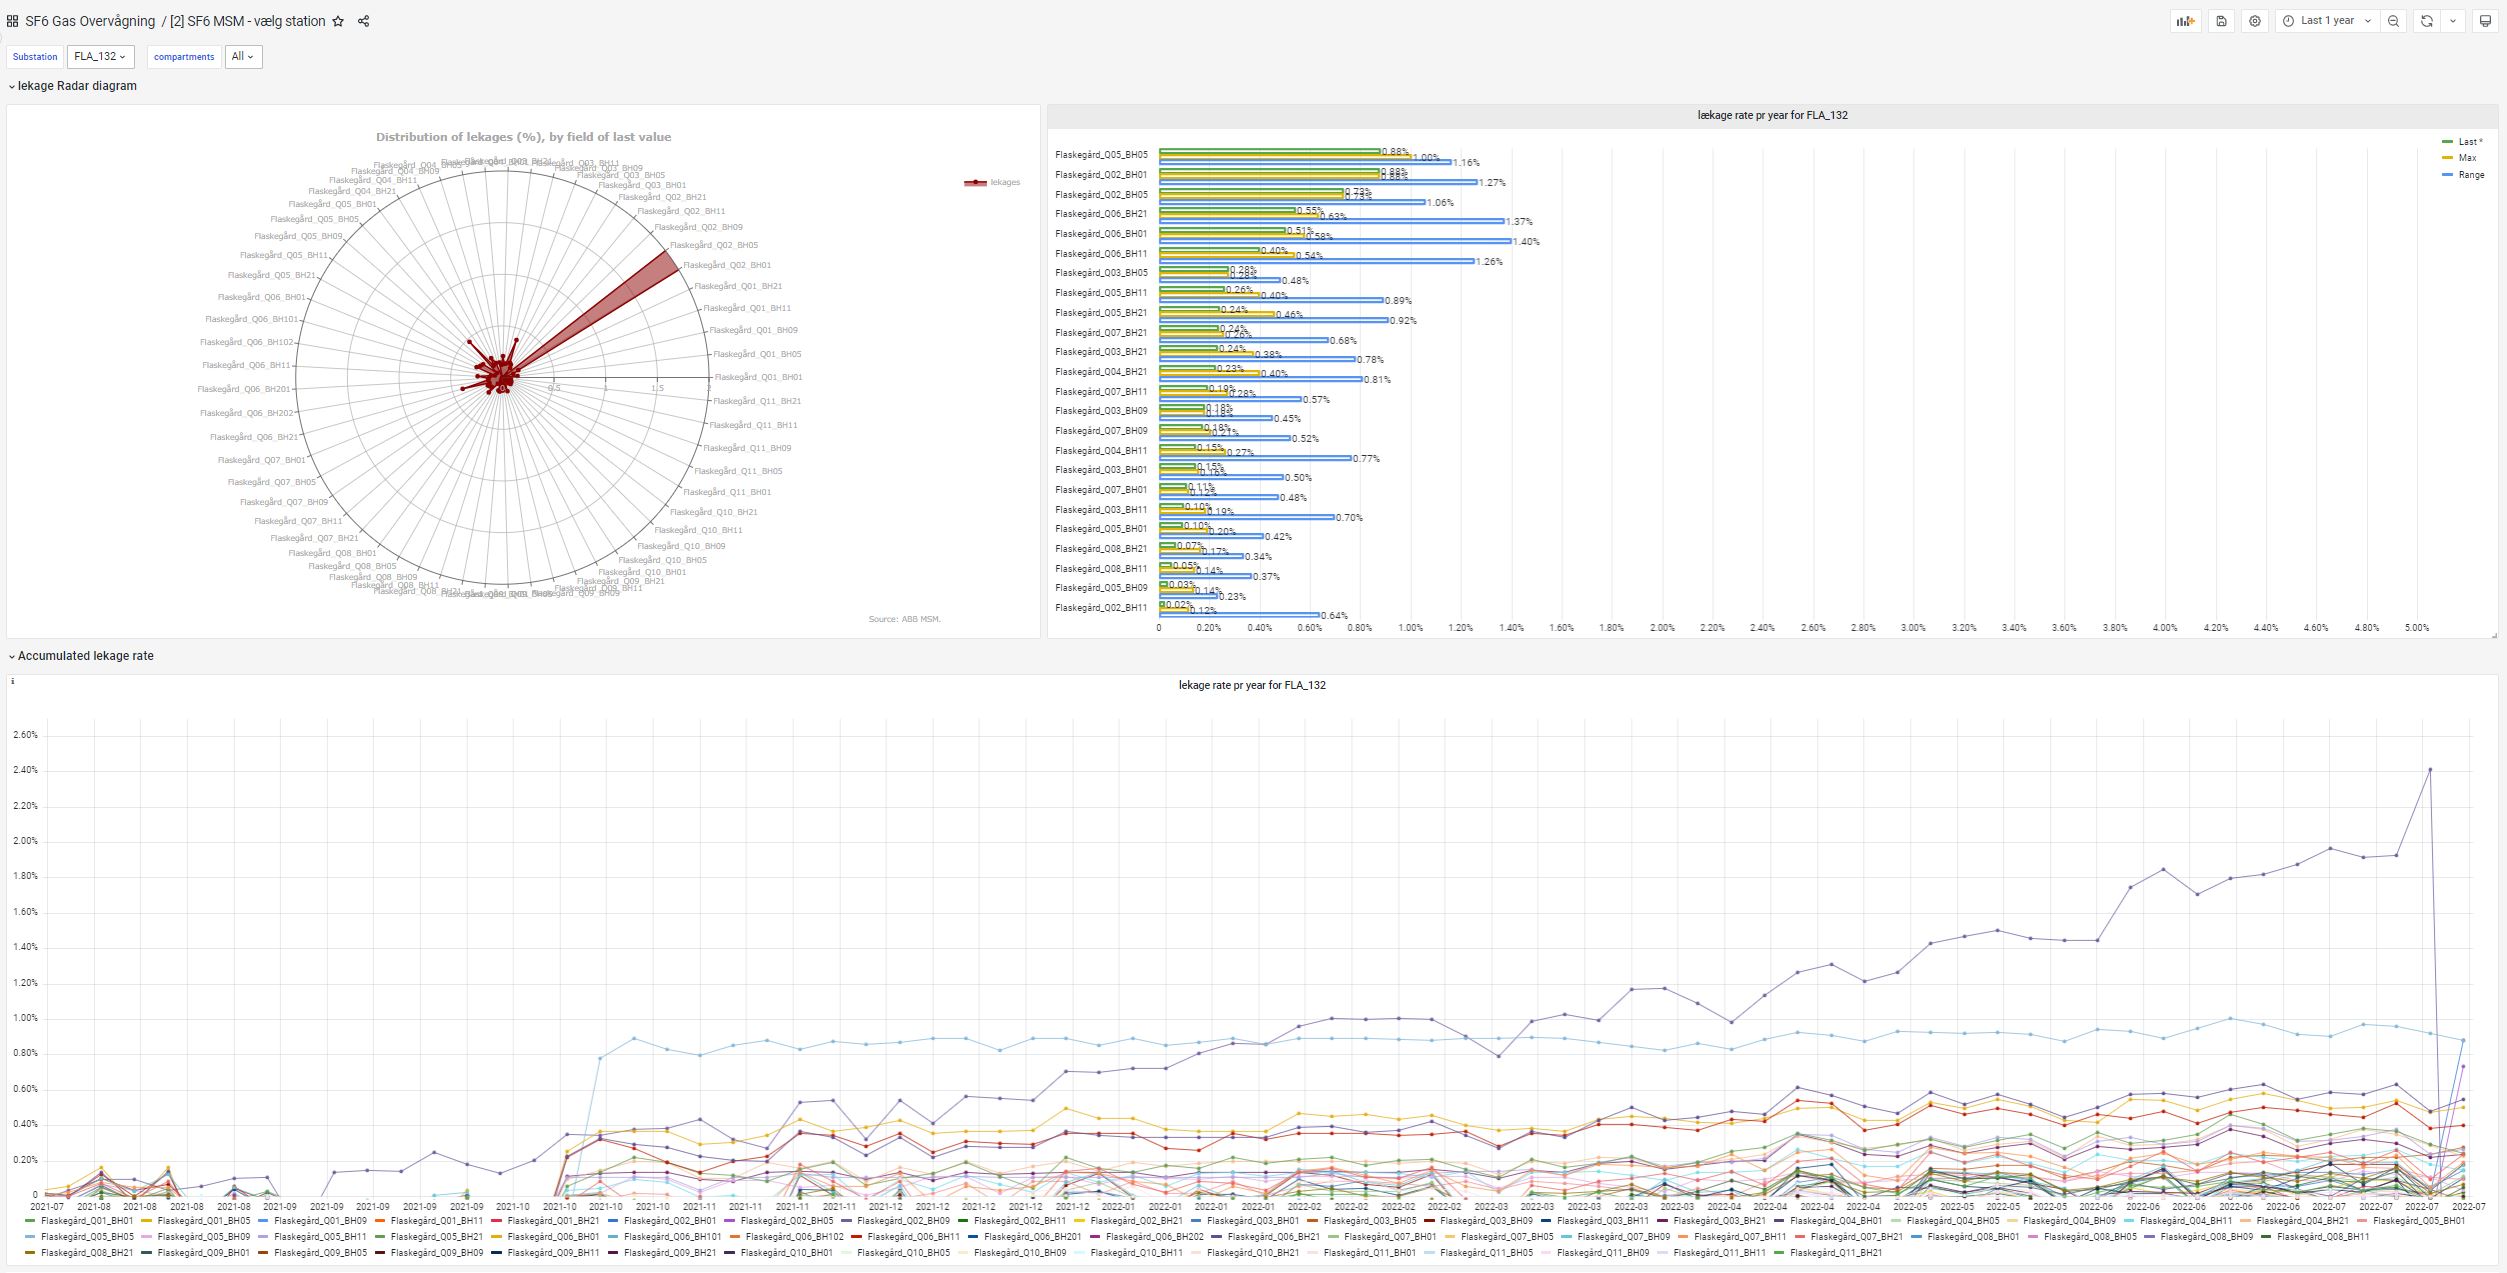
Grafana alerts even help Energinet minimize its impact on the environment. In one current project, the company is mounting 2,400 sensors to monitor leakage rates on its circuit breakers in order to minimize the amount of SF6 gas leakage — used to insulate the high voltage in the circuit breakers. Sulfur hexafluoride (SF6) is an extremely potent and persistent greenhouse gas.
Ideal match
Hansen says that over the years, Grafana as a product has been getting “better and better” and supporting even more of Energinet’s needs. Meanwhile, his experience with the Grafana team and community has been consistently positive and productive. “Faults I found in the OSS version of Grafana were reacted to and solved quite fast by the community,” he says. “Grafana Labs has been there for us when we needed it.”
For Hansen, one of the great additional benefits of Grafana is that it’s open source software and scalable — two features that other monitoring solutions didn’t offer.
When you buy a proprietary system from a specific company, you cannot touch it yourself. But with the open and composable nature of Grafana, if we are working on monitoring something new, we can easily just set up a new dashboard and move forward right away.
Henrik Roland Hansen, Electrical Engineer, Asset Preparedness Department, Energinet
Looking ahead
As he looks to the future, he expects more Energinet teams to embrace Grafana. “I’ve had discussions with folks from the Electrical and Gas TSO (transmission system operator) department, and when they’re looking at Grafana, they say, ‘This is the tool we are missing.’”
When Energinet implemented Grafana, there were about 30 people using it. Currently, the company has about 120 users divided across asset operations, system operation, and the automation department. Hansen expects that number will grow to 250 or 300. “Even our control center people are using Grafana to look at the alerts from the system from the historical database.”
That growth spurred the company to switch to Grafana Enterprise, which will be part of Energinet’s recently established Asset Health Center, a unit that would monitor non-critical alarms, metrics, trends, and data quality in order to minimize outages, risk manage assets that have reached end of life, and more. Hansen said the company would also like to explore the reporting tool inside Grafana for its performance reporting.
The one thing he never wants to imagine is a future where he no longer has Grafana and it’s back to spreadsheets: “My colleagues and I would cry.”