Monitor Squid easily with Grafana
Easily monitor your deployment of Squid, an open source proxy server used to improve web performance and provide content caching for web clients, with Grafana Cloud’s out-of-the-box monitoring solution. The Grafana Cloud forever-free tier includes 3 users and up to 10k metrics series to support your monitoring needs.
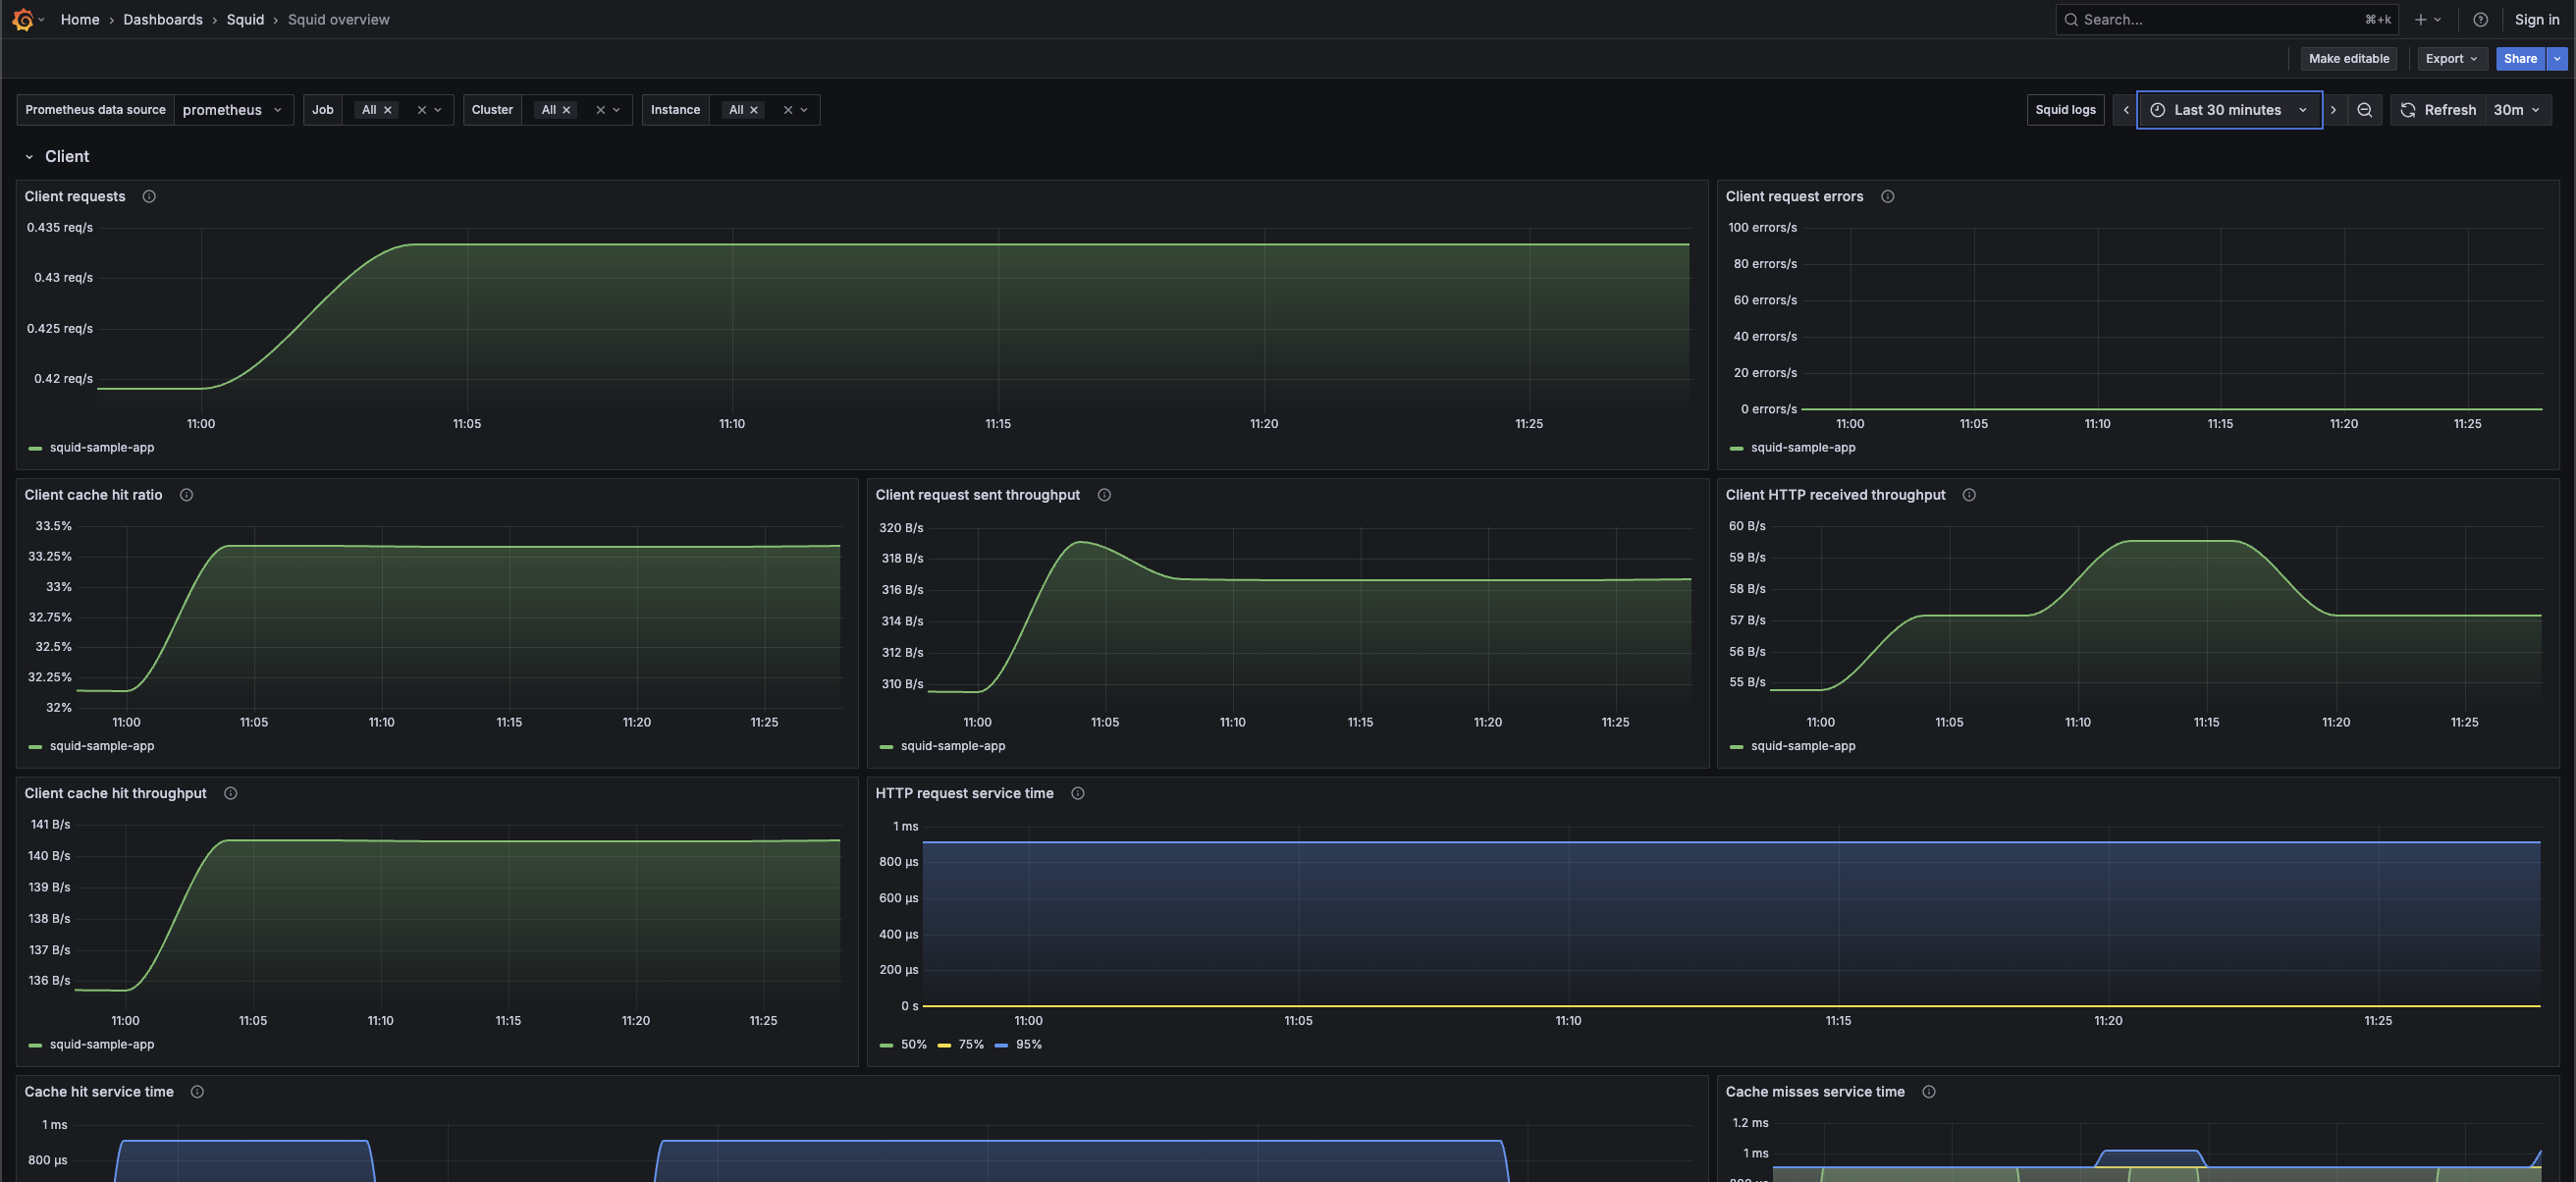
Squid overview dashboard (client)
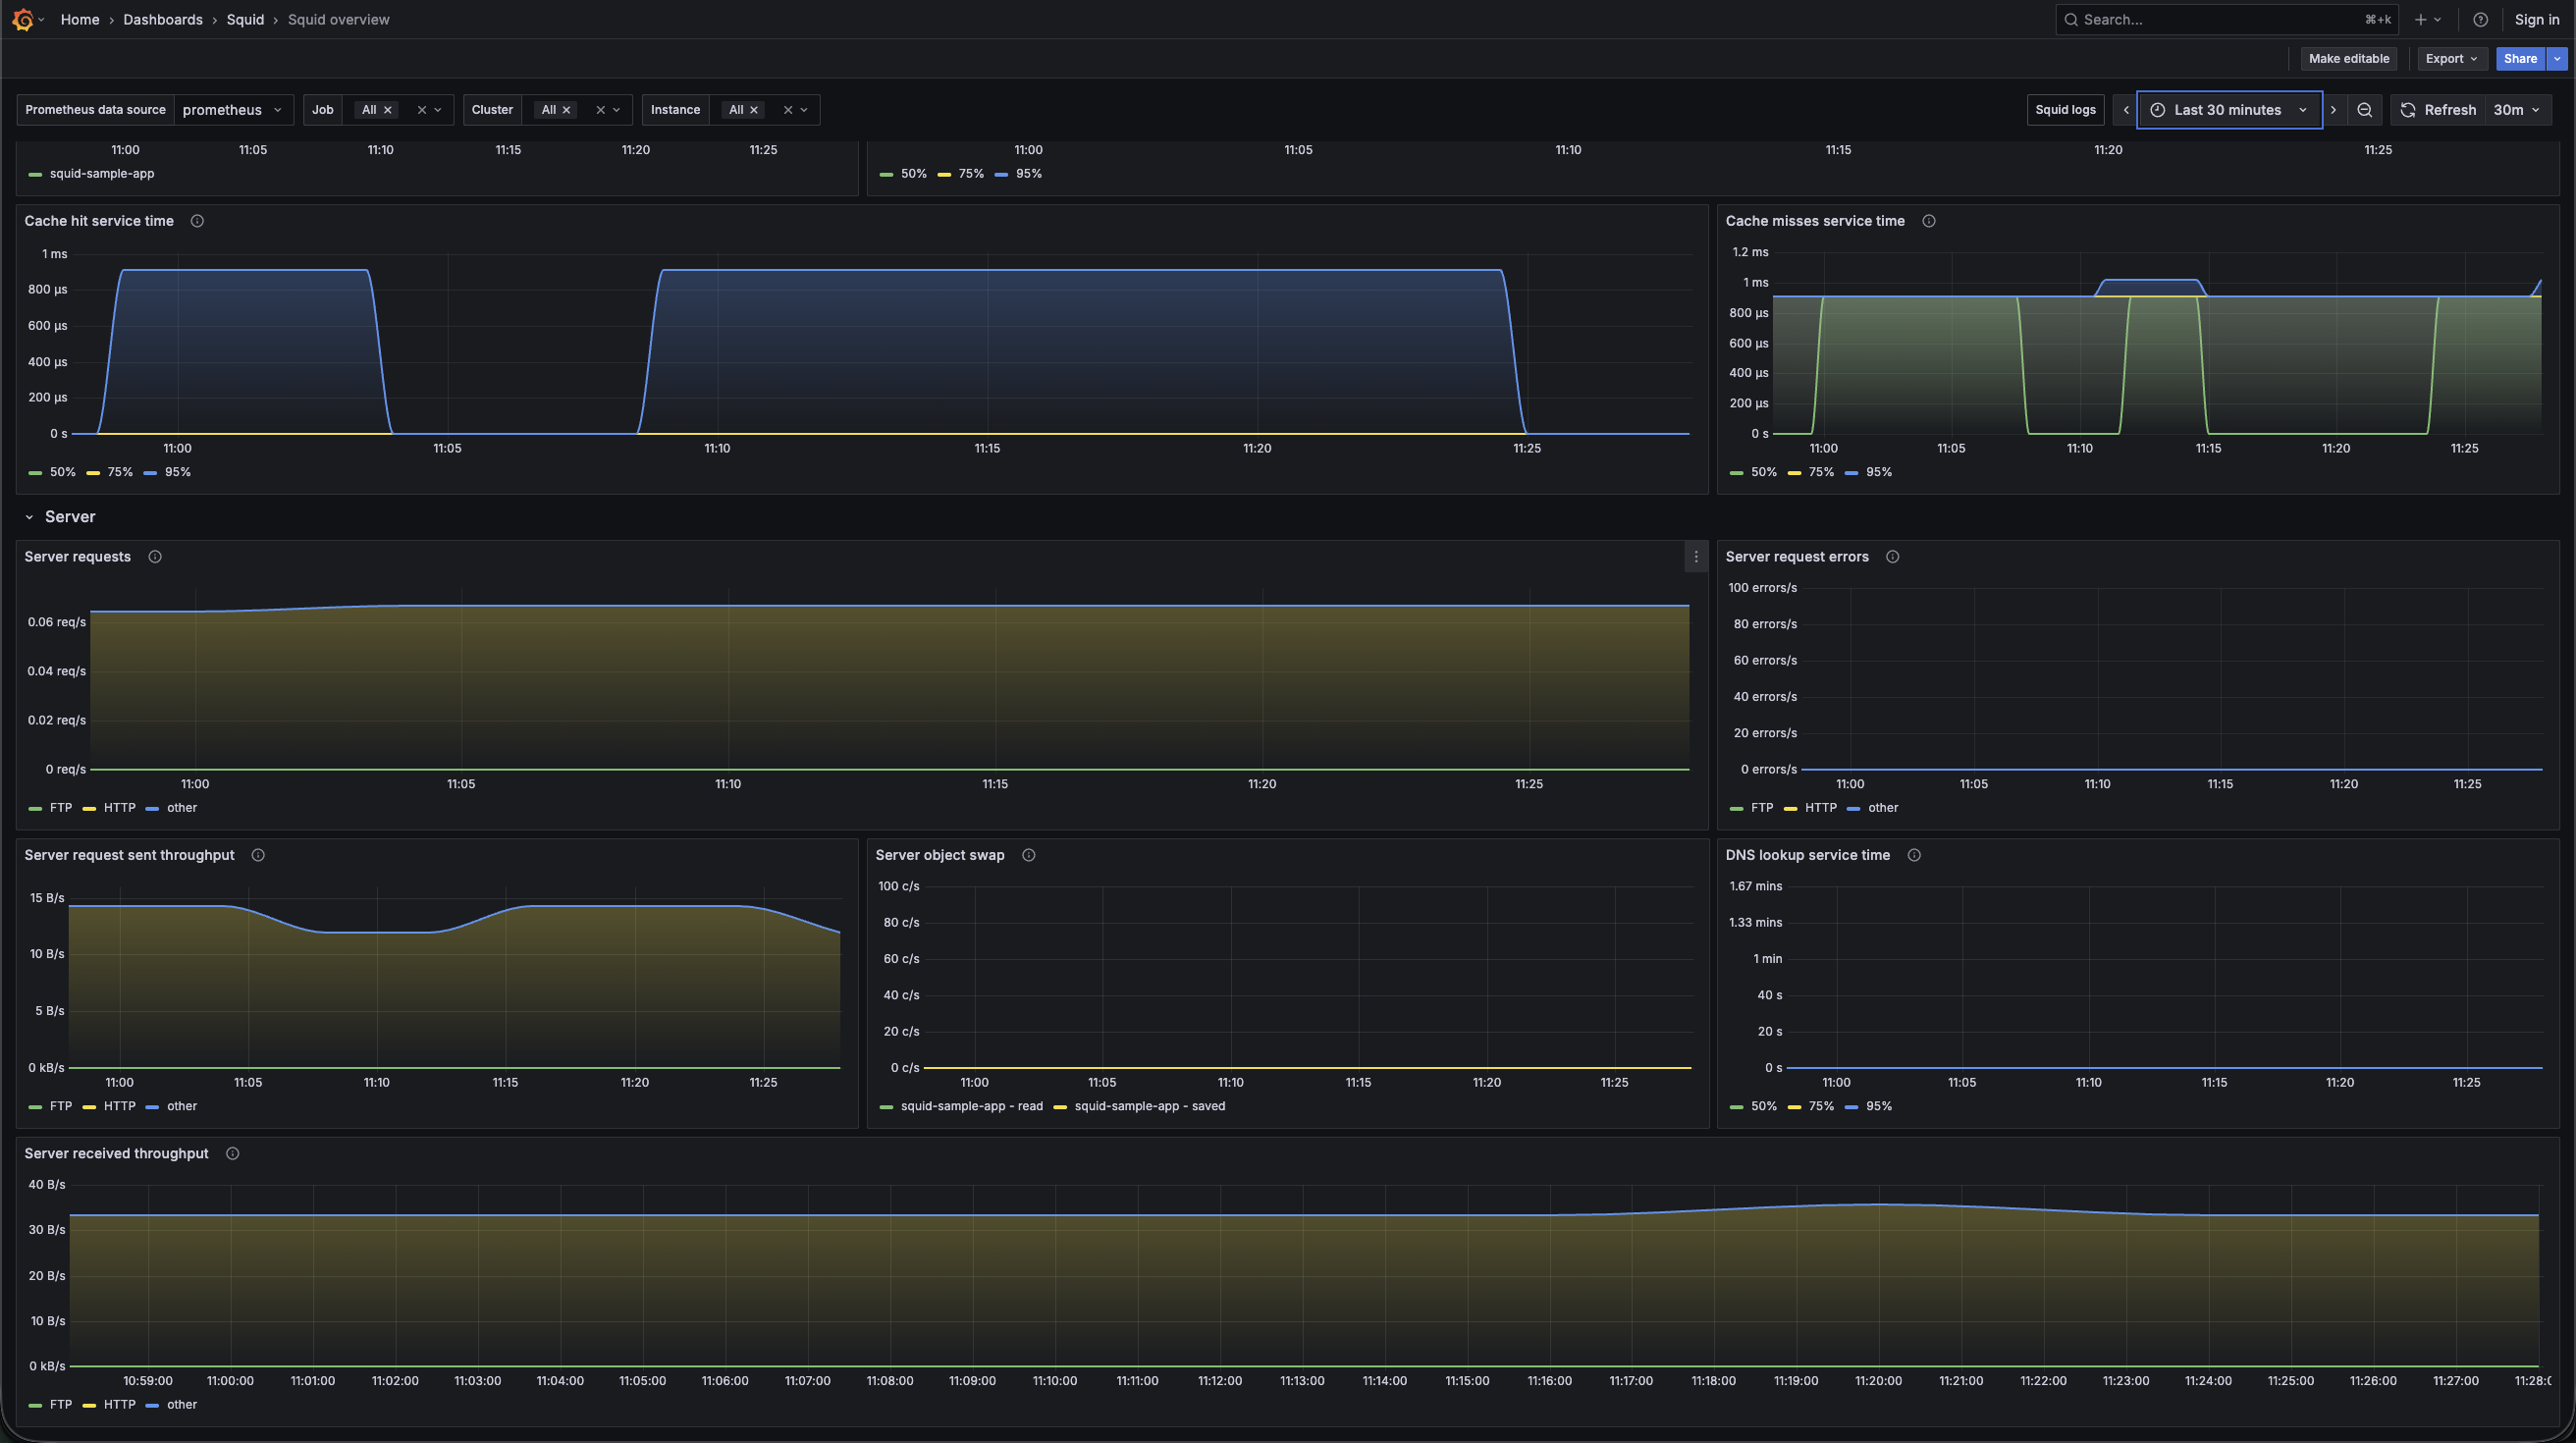
Squid overview dashboard (server)
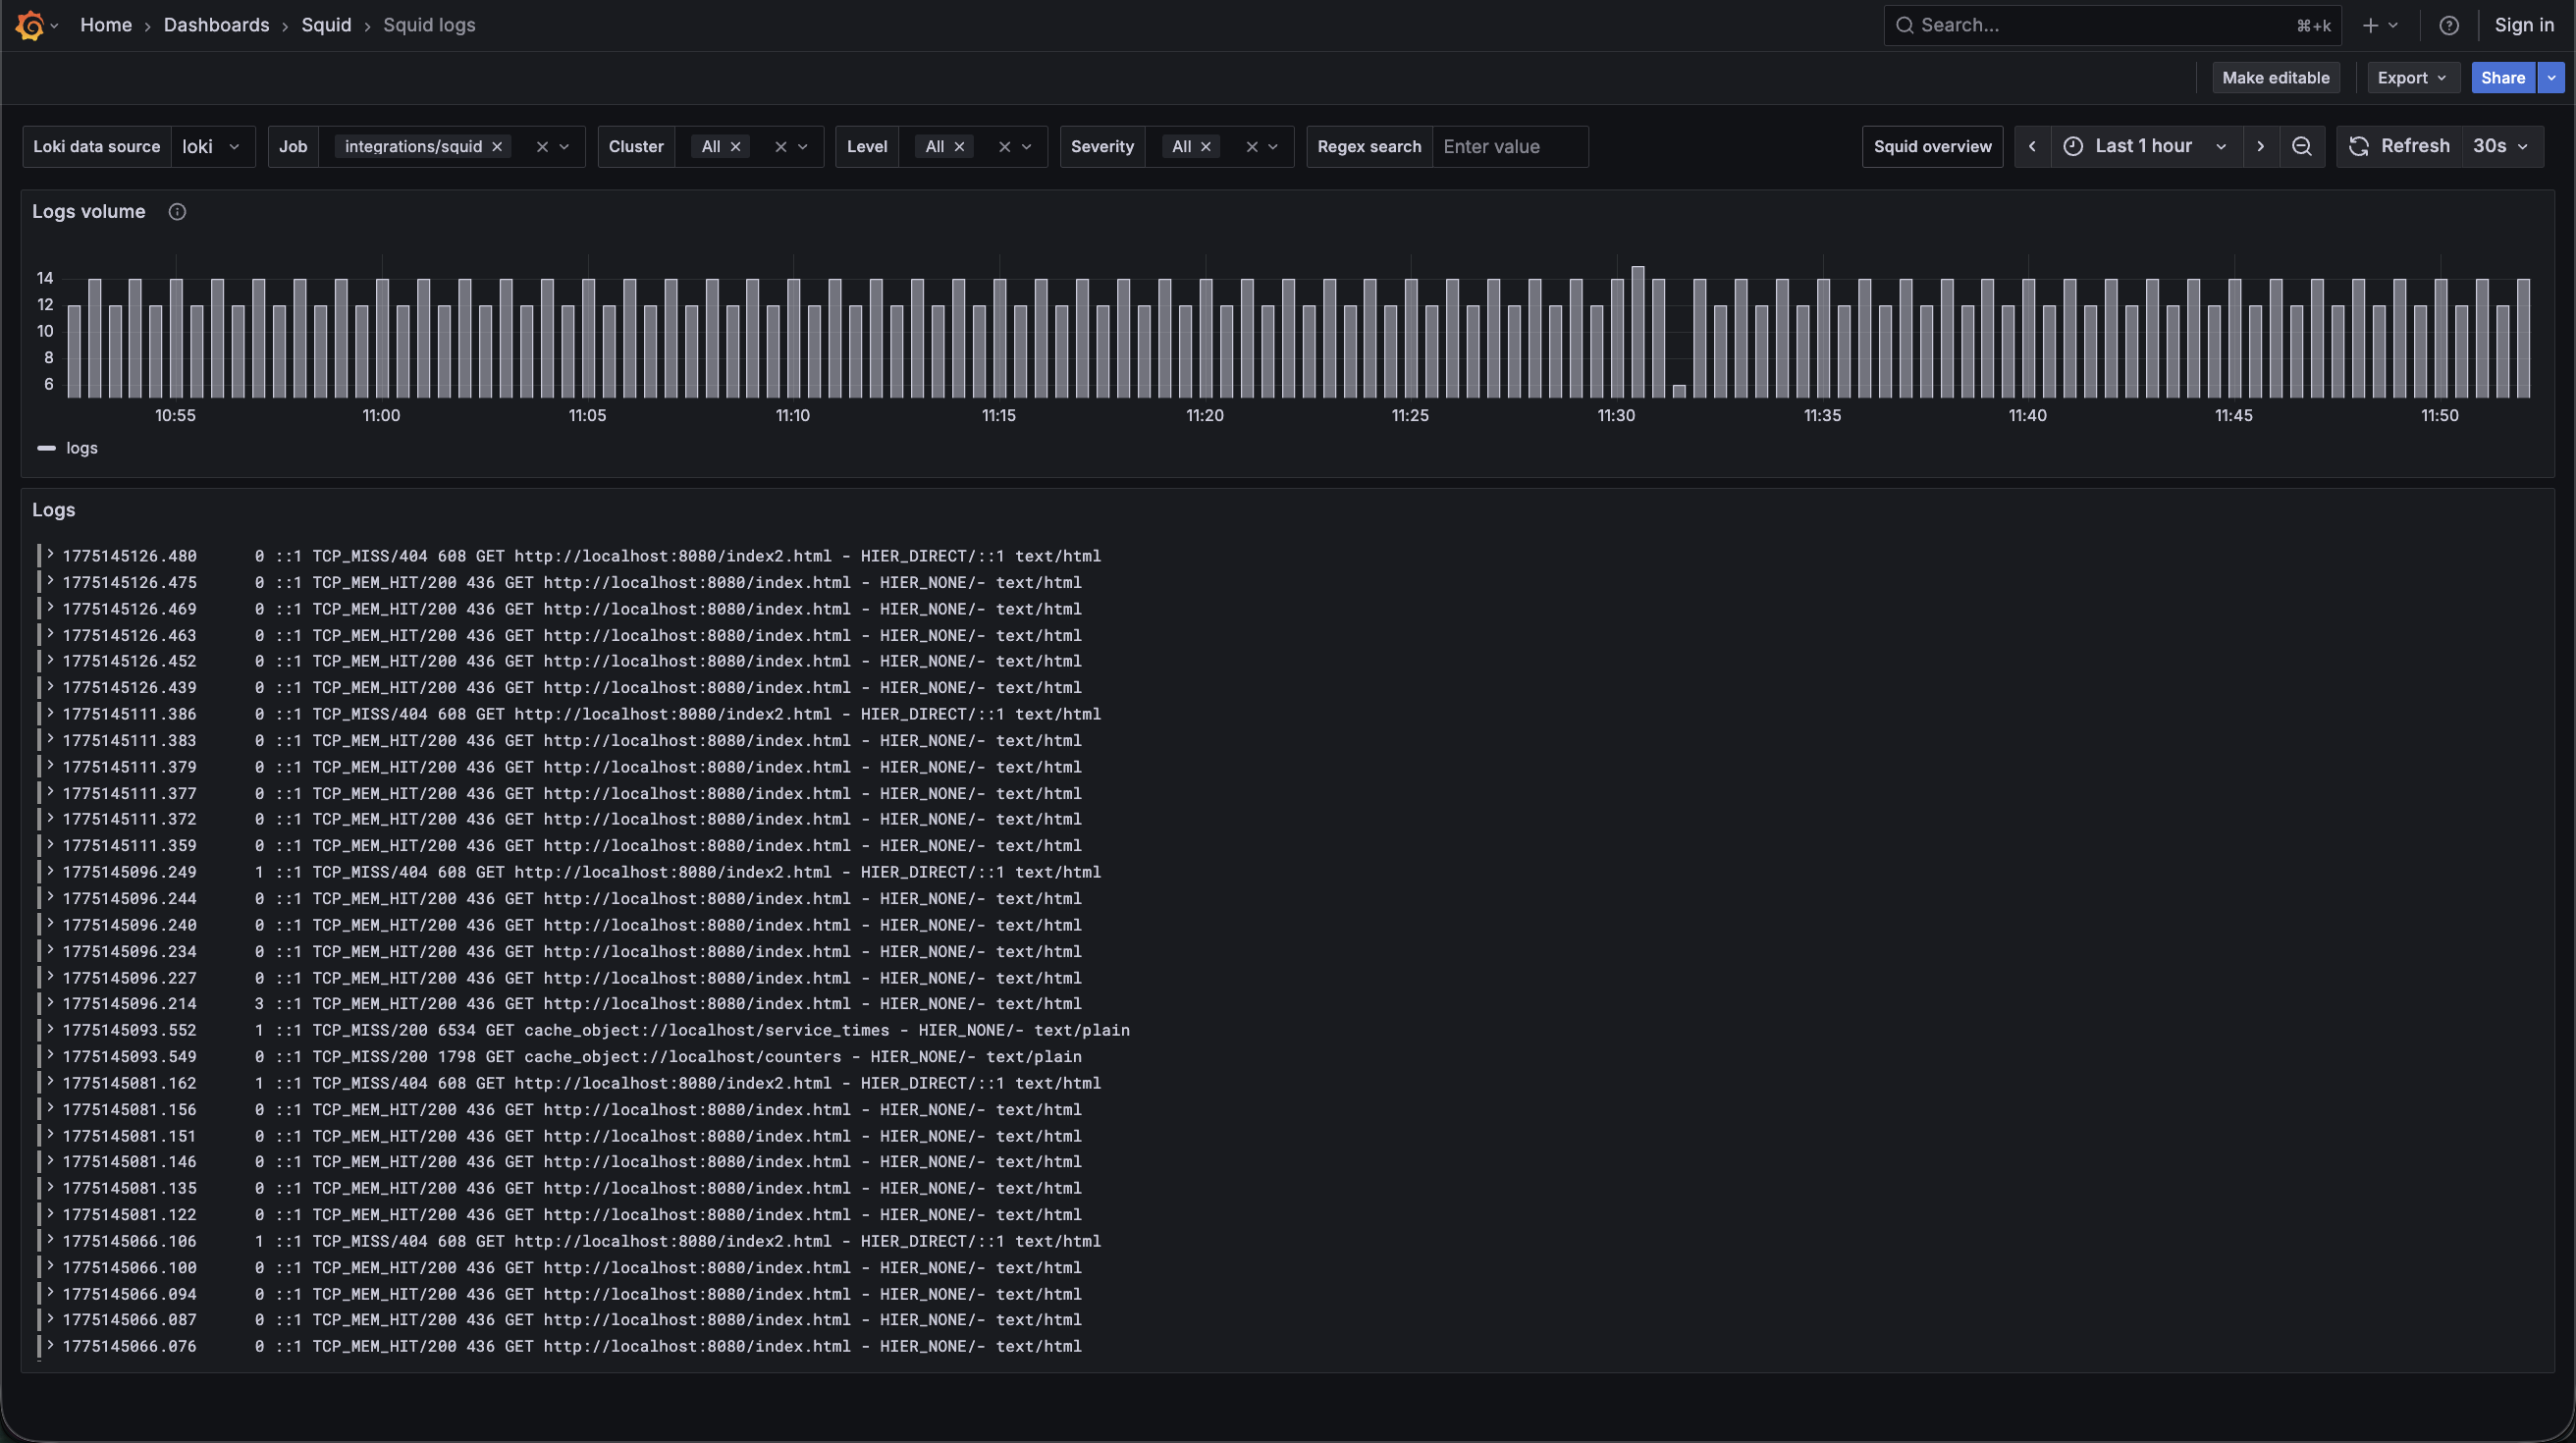
Squid logs dashboard
Key metrics
squid_Cache_Hits_50
squid_Cache_Hits_75
squid_Cache_Hits_95
squid_Cache_Misses_50
squid_Cache_Misses_75
squid_Cache_Misses_95
squid_DNS_Lookups_50
squid_DNS_Lookups_75
squid_DNS_Lookups_95
squid_HTTP_Requests_All_50
squid_HTTP_Requests_All_75
squid_HTTP_Requests_All_95
squid_client_http_errors_total
squid_client_http_hit_kbytes_out_bytes_total
squid_client_http_hits_total
squid_client_http_kbytes_in_kbytes_total
squid_client_http_kbytes_out_kbytes_total
squid_client_http_requests_total
squid_server_ftp_errors_total
squid_server_ftp_kbytes_in_kbytes_total
squid_server_ftp_kbytes_out_kbytes_total
squid_server_ftp_requests_total
squid_server_http_errors_total
squid_server_http_kbytes_in_kbytes_total
squid_server_http_kbytes_out_kbytes_total
squid_server_http_requests_total
squid_server_other_errors_total
squid_server_other_kbytes_in_kbytes_total
squid_server_other_kbytes_out_kbytes_total
squid_server_other_requests_total
squid_swap_ins_total
squid_swap_outs_total
Key alerting rules included
SquidHighPercentageOfHTTPServerRequestErrors
SquidHighPercentageOfFTPServerRequestErrors
SquidHighPercentageOfOtherServerRequestErrors
SquidHighPercentageOfClientRequestErrors
SquidLowCacheHitRatio